Las Vegas, NV Investment Properties for Sale
Browse homes for sale and investment properties in Las Vegas, NV. Refine your search by price, property type, or more.
Best cash flowing properties in Las Vegas, NV
Active
$224,000
2
bds
|
2
ba
|
978
sqft
|
built
1989
227 N Lamb Blvd, Las Vegas, NV 89110
$-474
Cash flow
-11.0%
Cash-on-Cash Return
3.7%
Cap rate
0.6%
Rent to Value Ratio
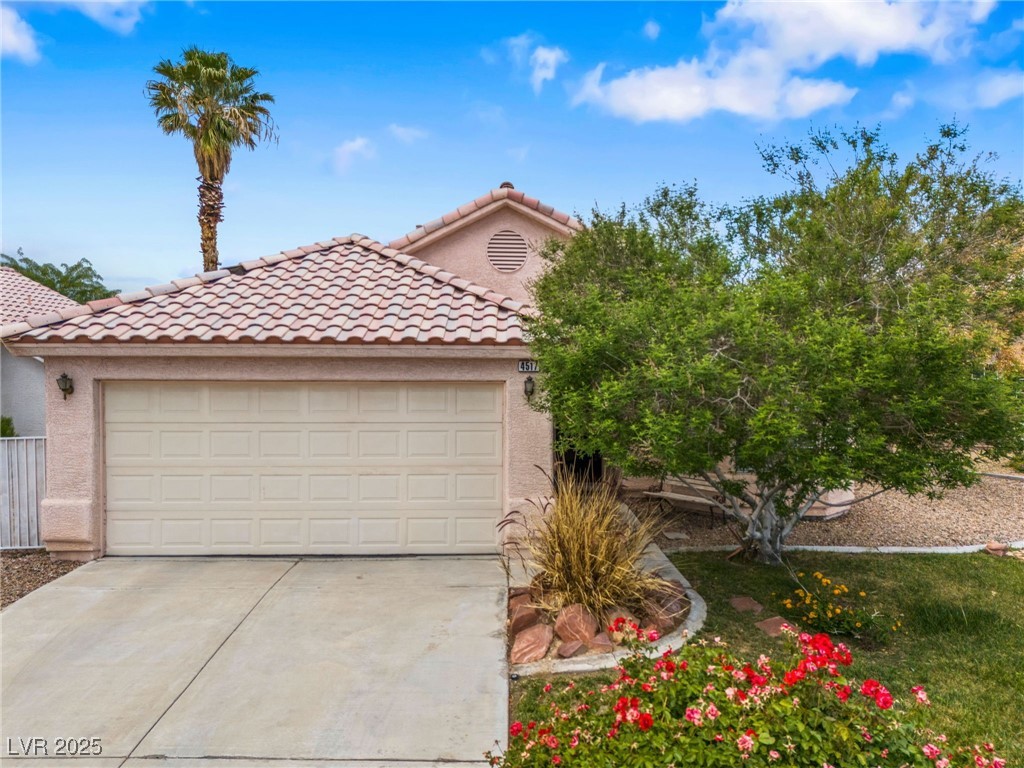
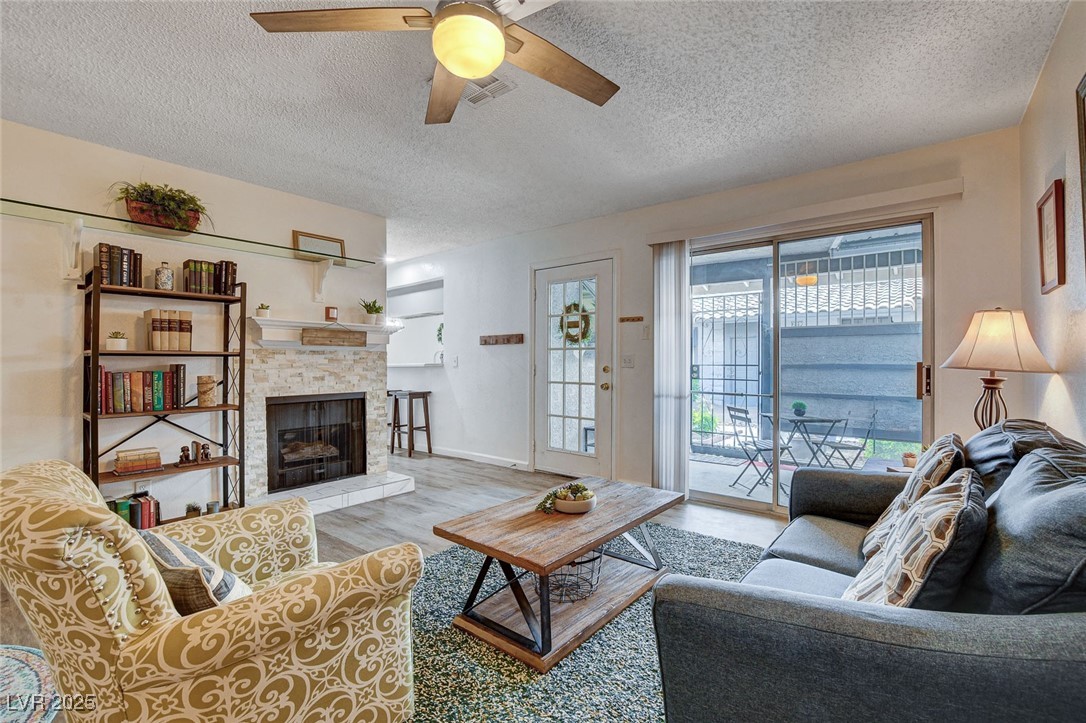
Active under contract
$375,000
3
bds
|
2
ba
|
1,244
sqft
|
built
1994
4517 Rodman Dr, Las Vegas, NV 89130
$-845
Cash flow
-11.8%
Cash-on-Cash Return
3.6%
Cap rate
0.5%
Rent to Value Ratio
5,424 out of 5,551 properties for sale in Las Vegas, NV
Limited Results Shown
Create a free account, or log in to reveal all property listings and enjoy the complete experience.
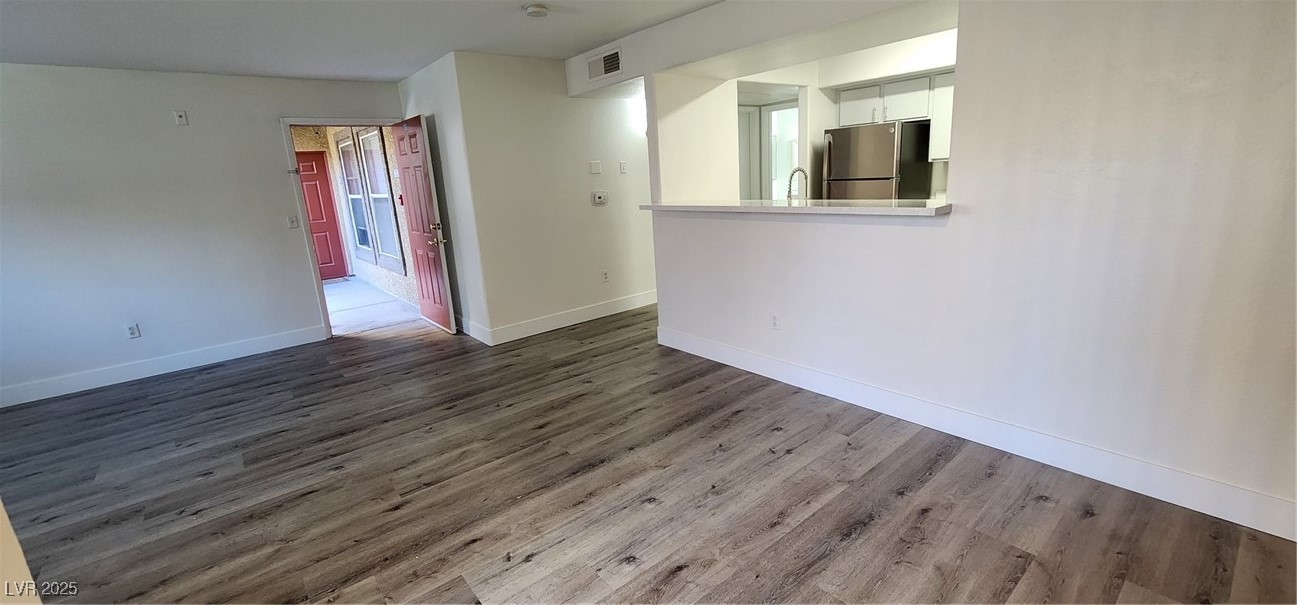
Active
$273,600
2
bds
|
2
ba
|
1,089
sqft
|
built
1997
2300 E Silverado Ranch Blvd, Las Vegas, NV 89183
$-852
Cash flow
-16.2%
Cash-on-Cash Return
2.5%
Cap rate
0.6%
Rent to Value Ratio
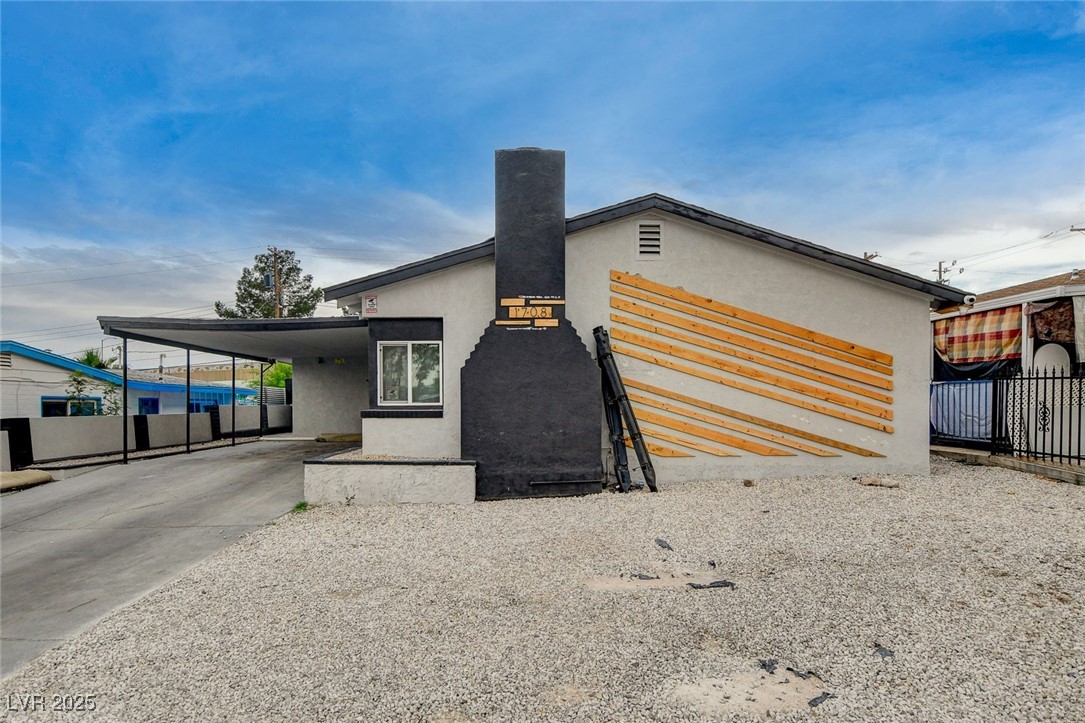
Active
$470,000
4
bds
|
2
ba
|
1,504
sqft
|
built
1952
1708 Poplar Ave, Las Vegas, NV 89101
$-929
Cash flow
-10.3%
Cash-on-Cash Return
3.9%
Cap rate
0.5%
Rent to Value Ratio
Active
$615,000
2
bds
|
2
ba
|
1,405
sqft
|
built
2006
322 Karen Ave, Las Vegas, NV 89109
$-1,791
Cash flow
-15.2%
Cash-on-Cash Return
2.8%
Cap rate
0.6%
Rent to Value Ratio
Active
$925,000
5
bds
|
5
ba
|
3,866
sqft
|
built
2022
7260 Grace Estate Ave, Las Vegas, NV 89113
$-2,995
Cash flow
-16.9%
Cash-on-Cash Return
2.4%
Cap rate
0.4%
Rent to Value Ratio
Active
$1,395,000
4
bds
|
3
ba
|
3,245
sqft
|
built
2014
12283 Lost Treasure Ave, Las Vegas, NV 89138
$-4,278
Cash flow
-16.0%
Cash-on-Cash Return
2.6%
Cap rate
0.4%
Rent to Value Ratio
Active
$875,000
3
bds
|
2
ba
|
3,381
sqft
|
built
2005
5651 Deer Creek Falls Ct, Las Vegas, NV 89118
$-2,628
Cash flow
-15.7%
Cash-on-Cash Return
2.7%
Cap rate
0.4%
Rent to Value Ratio

Active
$6,808,888
6
bds
|
8
ba
|
10,855
sqft
|
built
1994
5020 Spanish Heights Dr, Las Vegas, NV 89148
$-33,657
Cash flow
-25.8%
Cash-on-Cash Return
0.4%
Cap rate
0.1%
Rent to Value Ratio
Active
$1,225,000
4
bds
|
4
ba
|
3,146
sqft
|
built
2022
10196 Sequoia Glen Ave, Las Vegas, NV 89166
$-3,827
Cash flow
-16.3%
Cash-on-Cash Return
2.5%
Cap rate
0.4%
Rent to Value Ratio
Active
$1,590,000
4
bds
|
4
ba
|
4,088
sqft
|
built
2022
5725 El Royale Ct, Las Vegas, NV 89149
$-4,072
Cash flow
-13.4%
Cash-on-Cash Return
3.2%
Cap rate
0.5%
Rent to Value Ratio
Active
$1,149,000
4
bds
|
3
ba
|
2,807
sqft
|
built
2003
78 Siddall Ave, Las Vegas, NV 89183
$-3,953
Cash flow
-17.9%
Cash-on-Cash Return
2.2%
Cap rate
0.3%
Rent to Value Ratio
Active
$1,237,500
6
bds
|
5
ba
|
3,952
sqft
|
built
2020
3929 Reyes Ave, Las Vegas, NV 89141
$-4,549
Cash flow
-19.2%
Cash-on-Cash Return
1.9%
Cap rate
0.3%
Rent to Value Ratio
Active
$1,585,000
4
bds
|
4
ba
|
3,076
sqft
|
built
2023
436 Crown Mesa Ave, Las Vegas, NV 89138
$-6,227
Cash flow
-20.5%
Cash-on-Cash Return
1.6%
Cap rate
0.3%
Rent to Value Ratio
Active
$1,894,999
5
bds
|
5
ba
|
5,288
sqft
|
built
2019
4576 Amazing View St, Las Vegas, NV 89129
$-7,347
Cash flow
-20.2%
Cash-on-Cash Return
1.6%
Cap rate
0.3%
Rent to Value Ratio
Active
$1,999,000
4
bds
|
5
ba
|
4,094
sqft
|
built
2016
12024 Girasole Ave, Las Vegas, NV 89138
$-5,188
Cash flow
-13.5%
Cash-on-Cash Return
3.2%
Cap rate
0.5%
Rent to Value Ratio
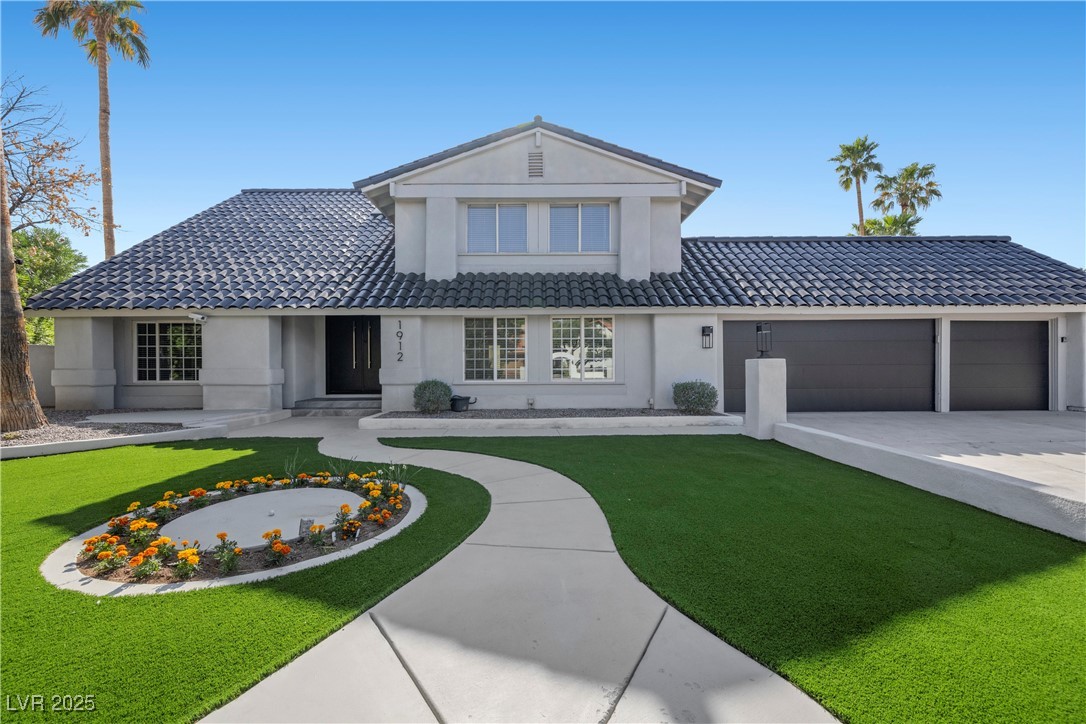
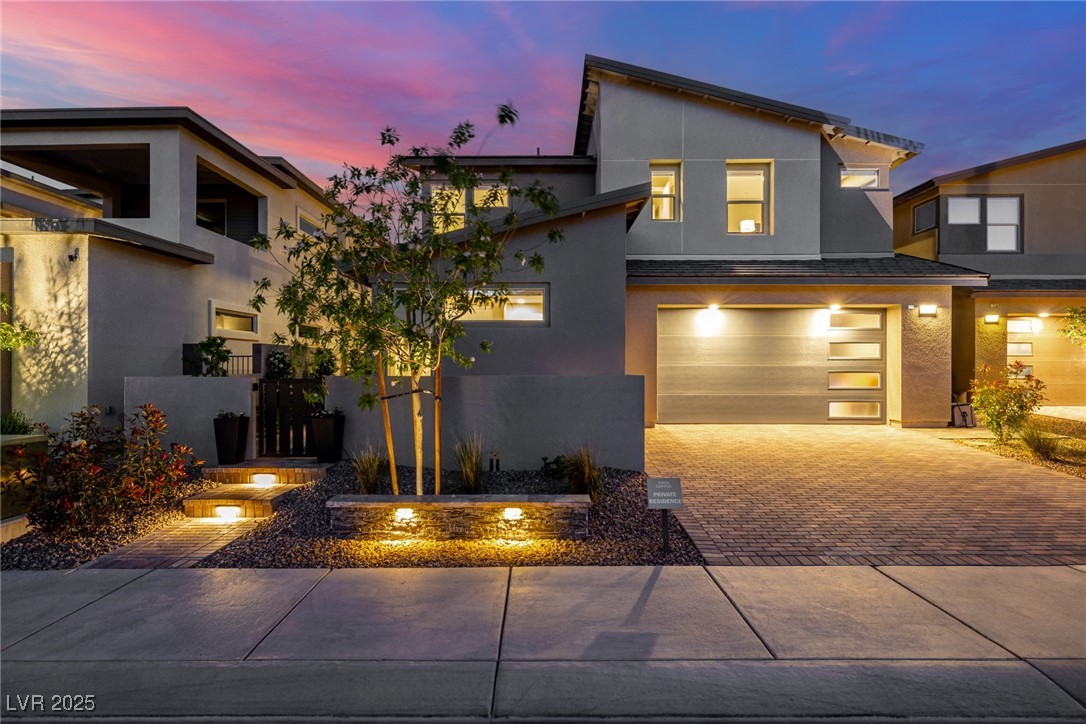
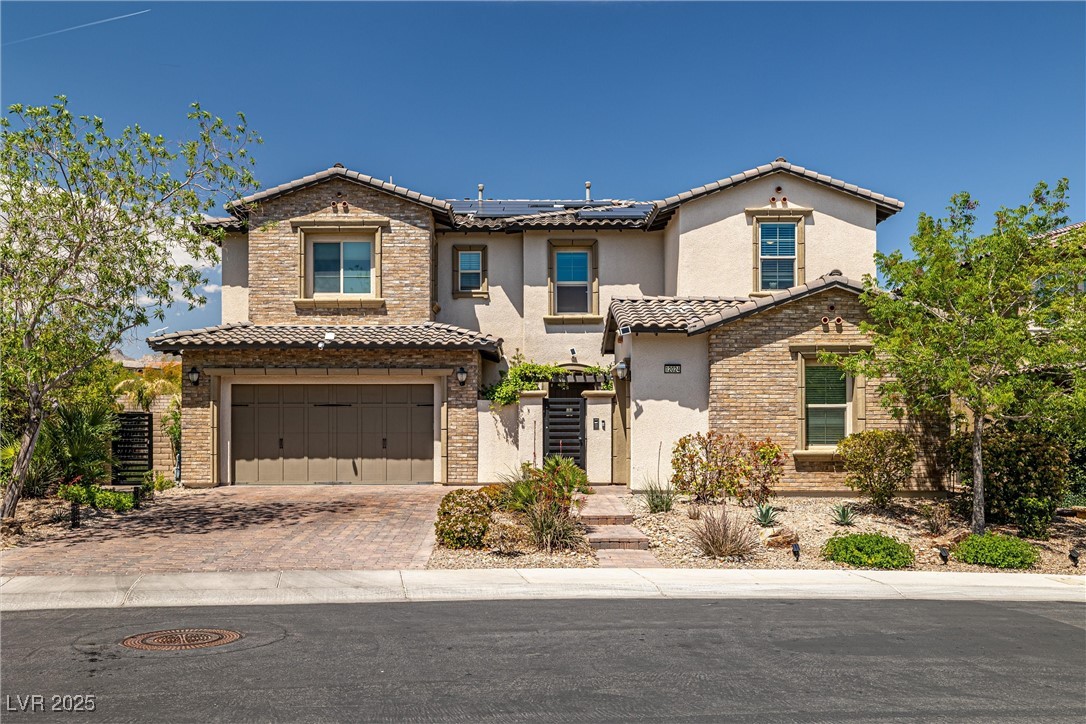
Active
$1,500,000
6
bds
|
5
ba
|
4,395
sqft
|
built
1981
1912 Calanda Ct, Las Vegas, NV 89102
$-3,295
Cash flow
-11.5%
Cash-on-Cash Return
3.6%
Cap rate
0.5%
Rent to Value Ratio
Active
$445,000
3
bds
|
3
ba
|
1,739
sqft
|
built
1996
3919 Lilac Haze St, Las Vegas, NV 89147
$-1,132
Cash flow
-13.3%
Cash-on-Cash Return
3.2%
Cap rate
0.4%
Rent to Value Ratio
Active
$765,000
5
bds
|
4
ba
|
3,279
sqft
|
built
2024
10851 Hanwicke Harbor Ave, Las Vegas, NV 89166
$-3,054
Cash flow
-20.8%
Cash-on-Cash Return
1.5%
Cap rate
0.3%
Rent to Value Ratio
Active
$2,250,000
4
bds
|
6
ba
|
6,070
sqft
|
built
1983
7001 Alamitos Cir, Las Vegas, NV 89120
$-6,154
Cash flow
-14.3%
Cash-on-Cash Return
3.0%
Cap rate
0.4%
Rent to Value Ratio
Active
$2,560,000
4
bds
|
5
ba
|
3,776
sqft
|
built
2016
15 Gemstar Ln, Las Vegas, NV 89135
$-10,981
Cash flow
-22.4%
Cash-on-Cash Return
1.1%
Cap rate
0.2%
Rent to Value Ratio
Pending
$960,000
3
bds
|
3
ba
|
2,528
sqft
|
built
2014
7763 Brisk Ocean Ave, Las Vegas, NV 89178
$-3,530
Cash flow
-19.2%
Cash-on-Cash Return
1.9%
Cap rate
0.3%
Rent to Value Ratio
Active
$899,000
4
bds
|
3
ba
|
4,078
sqft
|
built
2011
7931 Campers Village Ave, Las Vegas, NV 89178
$-2,930
Cash flow
-17.0%
Cash-on-Cash Return
2.4%
Cap rate
0.4%
Rent to Value Ratio
Active
$899,900
6
bds
|
4
ba
|
3,057
sqft
|
built
1998
6116 Golden Saddle St, Las Vegas, NV 89130
$-2,890
Cash flow
-16.8%
Cash-on-Cash Return
2.4%
Cap rate
0.4%
Rent to Value Ratio

Active
$1,099,000
4
bds
|
4
ba
|
3,807
sqft
|
built
2015
3428 Iron Hagen Ct, Las Vegas, NV 89141
$-3,086
Cash flow
-14.7%
Cash-on-Cash Return
2.9%
Cap rate
0.4%
Rent to Value Ratio
Active
$1,188,000
6
bds
|
4
ba
|
3,720
sqft
|
built
1995
2508 Monarch Bay Dr, Las Vegas, NV 89128
$-3,893
Cash flow
-17.1%
Cash-on-Cash Return
2.4%
Cap rate
0.4%
Rent to Value Ratio
Active
$3,200,000
4
bds
|
6
ba
|
5,283
sqft
|
built
2000
9713 Highridge Dr, Las Vegas, NV 89134
$-14,738
Cash flow
-24.0%
Cash-on-Cash Return
0.8%
Cap rate
0.2%
Rent to Value Ratio
Active
$1,250,000
6
bds
|
6
ba
|
6,148
sqft
|
built
1970
1420 S 8th St, Las Vegas, NV 89104
$-1,899
Cash flow
-7.9%
Cash-on-Cash Return
4.5%
Cap rate
0.6%
Rent to Value Ratio
Active
$415,000
3
bds
|
2
ba
|
1,254
sqft
|
built
1998
9323 W Rochelle Ave, Las Vegas, NV 89147
$-939
Cash flow
-11.8%
Cash-on-Cash Return
3.6%
Cap rate
0.5%
Rent to Value Ratio
Active
$485,000
4
bds
|
0
ba
|
1,480
sqft
|
built
1942
333 N 13th St, Las Vegas, NV 89101
$-1,744
Cash flow
-18.8%
Cash-on-Cash Return
2.0%
Cap rate
0.3%
Rent to Value Ratio
Active
$2,975,000
3
bds
|
4
ba
|
4,276
sqft
|
built
2005
360 E Desert Inn Rd, Las Vegas, NV 89109
$-11,995
Cash flow
-21.0%
Cash-on-Cash Return
1.4%
Cap rate
0.3%
Rent to Value Ratio
Active
$1,795,000
3
bds
|
4
ba
|
2,827
sqft
|
built
2018
6103 Stone Rise St, Las Vegas, NV 89135
$-7,381
Cash flow
-21.5%
Cash-on-Cash Return
1.3%
Cap rate
0.2%
Rent to Value Ratio
Active
$1,975,000
4
bds
|
5
ba
|
4,335
sqft
|
built
2006
7682 Rafter Ct, Las Vegas, NV 89139
$-6,547
Cash flow
-17.3%
Cash-on-Cash Return
2.3%
Cap rate
0.3%
Rent to Value Ratio
Active
$3,395,000
3
bds
|
4
ba
|
2,795
sqft
|
built
2006
9101 Alta Dr, Las Vegas, NV 89145
$-17,989
Cash flow
-27.6%
Cash-on-Cash Return
-0.1%
Cap rate
0.2%
Rent to Value Ratio
Active under contract
$984,500
5
bds
|
3
ba
|
2,819
sqft
|
built
1985
2721 Family Ct, Las Vegas, NV 89117
$-3,015
Cash flow
-16.0%
Cash-on-Cash Return
2.6%
Cap rate
0.4%
Rent to Value Ratio
Active
$2,775,000
4
bds
|
6
ba
|
7,713
sqft
|
built
1989
42 Sawgrass Ct, Las Vegas, NV 89113
$-9,542
Cash flow
-17.9%
Cash-on-Cash Return
2.2%
Cap rate
0.4%
Rent to Value Ratio
Active
$900,000
4
bds
|
3
ba
|
3,219
sqft
|
built
2018
4001 Turquoise Falls St, Las Vegas, NV 89129
$-2,897
Cash flow
-16.8%
Cash-on-Cash Return
2.4%
Cap rate
0.4%
Rent to Value Ratio
Active
$1,283,000
4
bds
|
4
ba
|
2,999
sqft
|
built
1951
2711 Ashby Ave, Las Vegas, NV 89102
$-2,836
Cash flow
-11.5%
Cash-on-Cash Return
3.6%
Cap rate
0.5%
Rent to Value Ratio

Active
$785,000
5
bds
|
4
ba
|
3,496
sqft
|
built
2008
10220 Radcliffe Peak Ave, Las Vegas, NV 89166
$-1,817
Cash flow
-12.1%
Cash-on-Cash Return
3.5%
Cap rate
0.5%
Rent to Value Ratio
Active
$224,000
2
bds
|
2
ba
|
978
sqft
|
built
1989
227 N Lamb Blvd, Las Vegas, NV 89110
$-474
Cash flow
-11.0%
Cash-on-Cash Return
3.7%
Cap rate
0.6%
Rent to Value Ratio
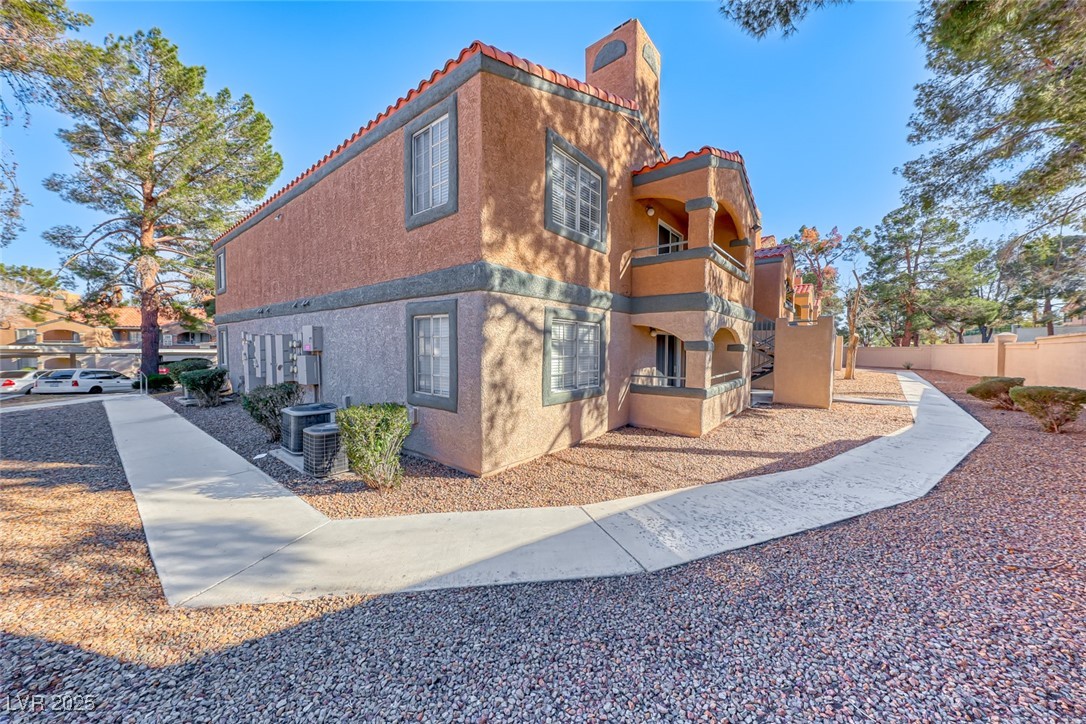
Active
$250,000
2
bds
|
2
ba
|
876
sqft
|
built
1989
211 Mission Laguna Ln, Las Vegas, NV 89107
$-849
Cash flow
-17.7%
Cash-on-Cash Return
2.2%
Cap rate
0.5%
Rent to Value Ratio
Active under contract
$375,000
3
bds
|
2
ba
|
1,244
sqft
|
built
1994
4517 Rodman Dr, Las Vegas, NV 89130
$-845
Cash flow
-11.8%
Cash-on-Cash Return
3.6%
Cap rate
0.5%
Rent to Value Ratio