Laughlin, NV Investment Properties for Sale
Browse homes for sale and investment properties in Laughlin, NV. Refine your search by price, property type, or more.
Best cash flowing properties in Laughlin, NV

Active
$140,000
2
bds
|
2
ba
|
986
sqft
|
built
1989
2064 Mesquite Ln, Laughlin, NV 89029
$-38
Cash flow
-1.4%
Cash-on-Cash Return
5.4%
Cap rate
1.0%
Rent to Value Ratio
Active
$118,500
1
bds
|
1
ba
|
572
sqft
|
built
1990
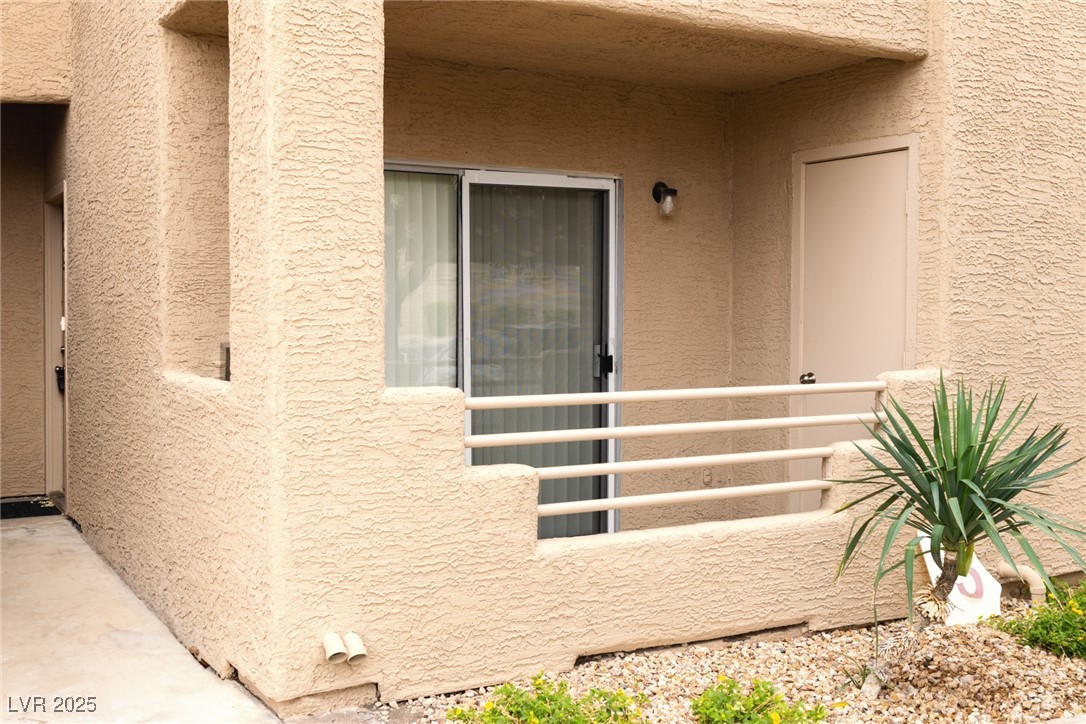
3550 Bay Sands Dr, Laughlin, NV 89029
$-75
Cash flow
-3.3%
Cash-on-Cash Return
4.9%
Cap rate
1.0%
Rent to Value Ratio
140 out of 145 properties for sale in Laughlin, NV
Limited Results Shown
Create a free account, or log in to reveal all property listings and enjoy the complete experience.

Active
$282,500
2
bds
|
2
ba
|
1,056
sqft
|
built
1987
1892 Maricopa Dr, Laughlin, NV 89029
$-466
Cash flow
-8.6%
Cash-on-Cash Return
3.7%
Cap rate
0.5%
Rent to Value Ratio

Active
$239,900
3
bds
|
3
ba
|
1,617
sqft
|
built
1993
2223 Rugged Mesa Dr, Laughlin, NV 89029
$-487
Cash flow
-10.6%
Cash-on-Cash Return
3.2%
Cap rate
0.7%
Rent to Value Ratio
Active
$147,000
1
bds
|
1
ba
|
716
sqft
|
built
1990
3550 Bay Sands Dr, Laughlin, NV 89029
$-182
Cash flow
-6.5%
Cash-on-Cash Return
4.2%
Cap rate
0.8%
Rent to Value Ratio
Active
$178,500
2
bds
|
1
ba
|
911
sqft
|
built
1984
3811 Desert Marina Dr, Laughlin, NV 89029
$-401
Cash flow
-11.7%
Cash-on-Cash Return
3.0%
Cap rate
0.7%
Rent to Value Ratio
Active
$150,000
2
bds
|
1
ba
|
810
sqft
|
built
1984
3750 Desert Marina Dr, Laughlin, NV 89029
$-315
Cash flow
-11.0%
Cash-on-Cash Return
3.2%
Cap rate
0.8%
Rent to Value Ratio

Active
$161,900
2
bds
|
1
ba
|
810
sqft
|
built
1984
3740 Desert Marina Dr, Laughlin, NV 89029
$-385
Cash flow
-12.4%
Cash-on-Cash Return
2.8%
Cap rate
0.7%
Rent to Value Ratio
Active
$192,500
2
bds
|
2
ba
|
900
sqft
|
built
1989
2191 Bay Club Dr, Laughlin, NV 89029
$-505
Cash flow
-13.7%
Cash-on-Cash Return
2.5%
Cap rate
0.6%
Rent to Value Ratio
Active
$128,000
1
bds
|
1
ba
|
700
sqft
|
built
1989
1964 Las Palmas Ln, Laughlin, NV 89029
$-256
Cash flow
-10.4%
Cash-on-Cash Return
3.3%
Cap rate
0.9%
Rent to Value Ratio
Active
$169,500
2
bds
|
1
ba
|
810
sqft
|
built
1984
3800 Desert Marina Dr, Laughlin, NV 89029
$-418
Cash flow
-12.9%
Cash-on-Cash Return
2.7%
Cap rate
0.7%
Rent to Value Ratio
Active
$389,000
3
bds
|
2
ba
|
1,906
sqft
|
built
1985
2063 Avalon Dr, Laughlin, NV 89029
$-627
Cash flow
-8.4%
Cash-on-Cash Return
3.7%
Cap rate
0.5%
Rent to Value Ratio

Active
$174,950
2
bds
|
1
ba
|
810
sqft
|
built
1984
3791 Desert Marina Dr, Laughlin, NV 89029
$-305
Cash flow
-9.1%
Cash-on-Cash Return
3.6%
Cap rate
0.8%
Rent to Value Ratio
Active
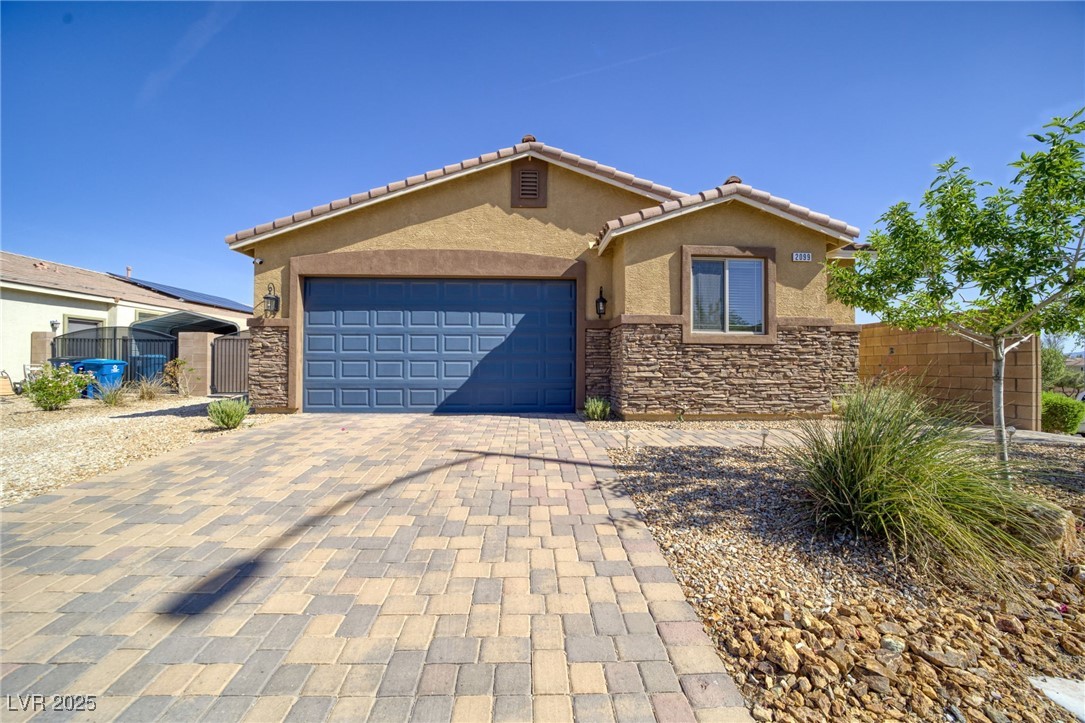
$434,000
4
bds
|
3
ba
|
1,906
sqft
|
built
2016
2099 Port Royal Dr, Laughlin, NV 89029
$-961
Cash flow
-11.6%
Cash-on-Cash Return
3.0%
Cap rate
0.5%
Rent to Value Ratio
Active
$414,900
3
bds
|
2
ba
|
1,944
sqft
|
built
1993
3652 Brian Ct, Laughlin, NV 89029
$-601
Cash flow
-7.6%
Cash-on-Cash Return
3.9%
Cap rate
0.6%
Rent to Value Ratio

Active
$359,990
2
bds
|
2
ba
|
1,541
sqft
|
built
2003
2847 Cattail Cove St, Laughlin, NV 89029
$-604
Cash flow
-8.8%
Cash-on-Cash Return
3.7%
Cap rate
0.5%
Rent to Value Ratio

Active
$399,000
3
bds
|
3
ba
|
1,755
sqft
|
built
2007
2077 Alki Beach Ave, Laughlin, NV 89029
$-773
Cash flow
-10.1%
Cash-on-Cash Return
3.4%
Cap rate
0.5%
Rent to Value Ratio
Active
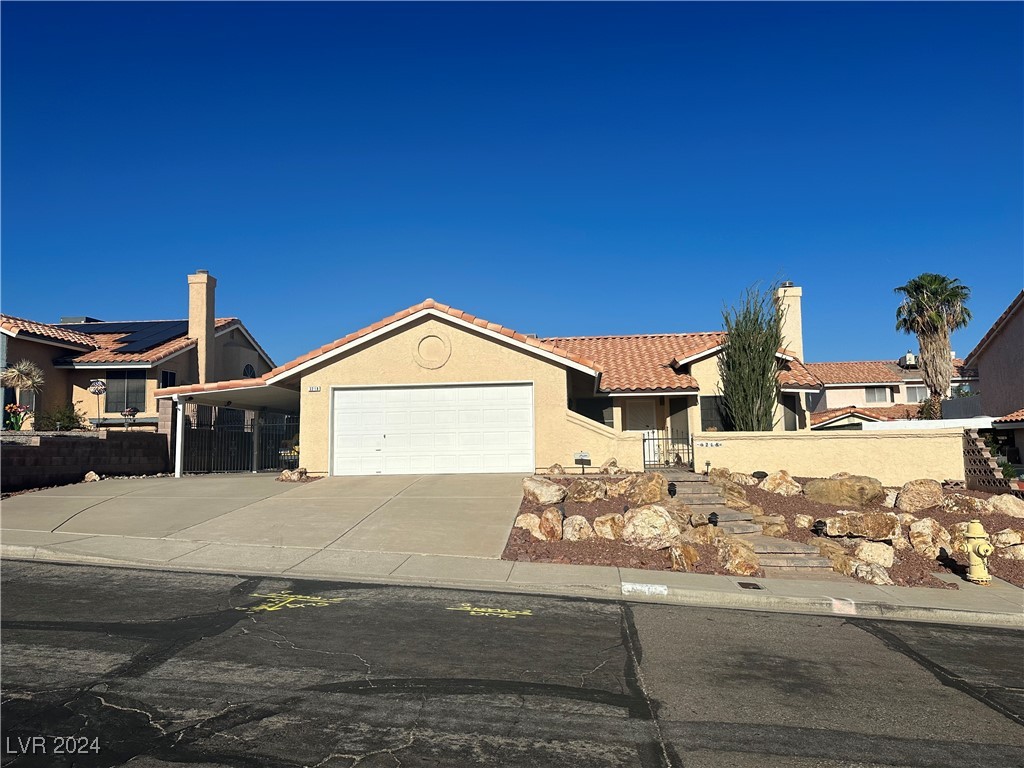
$379,990
3
bds
|
2
ba
|
1,931
sqft
|
built
1988
3218 Ocotillo Dr, Laughlin, NV 89029
$-592
Cash flow
-8.1%
Cash-on-Cash Return
3.8%
Cap rate
0.5%
Rent to Value Ratio
Active
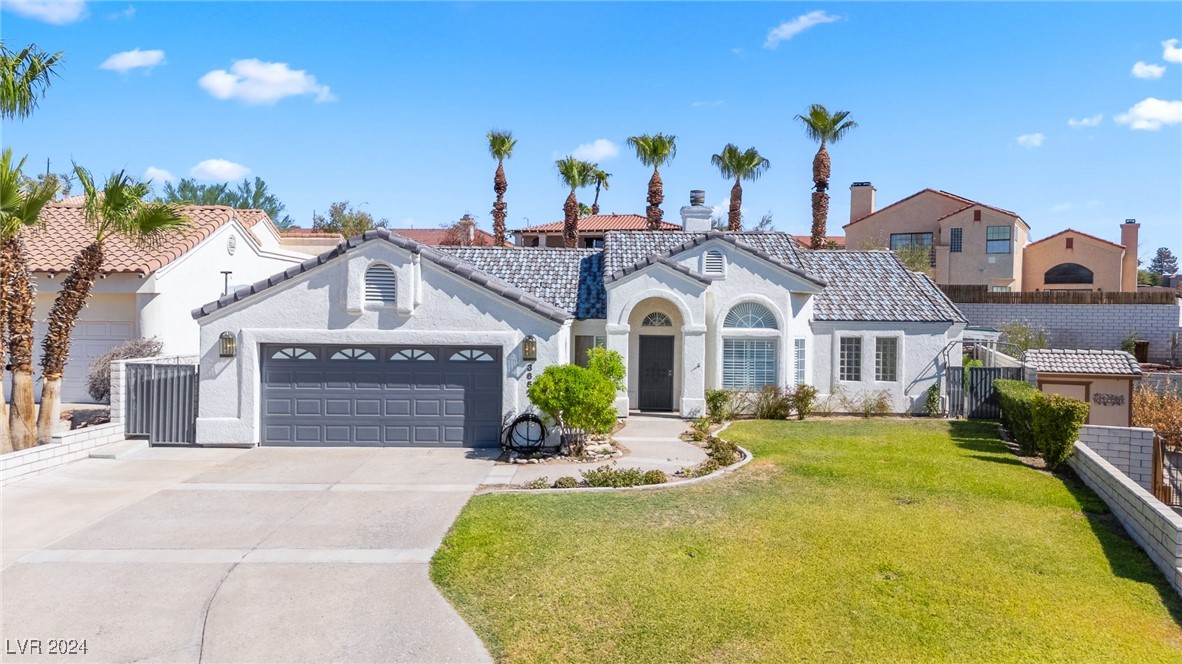
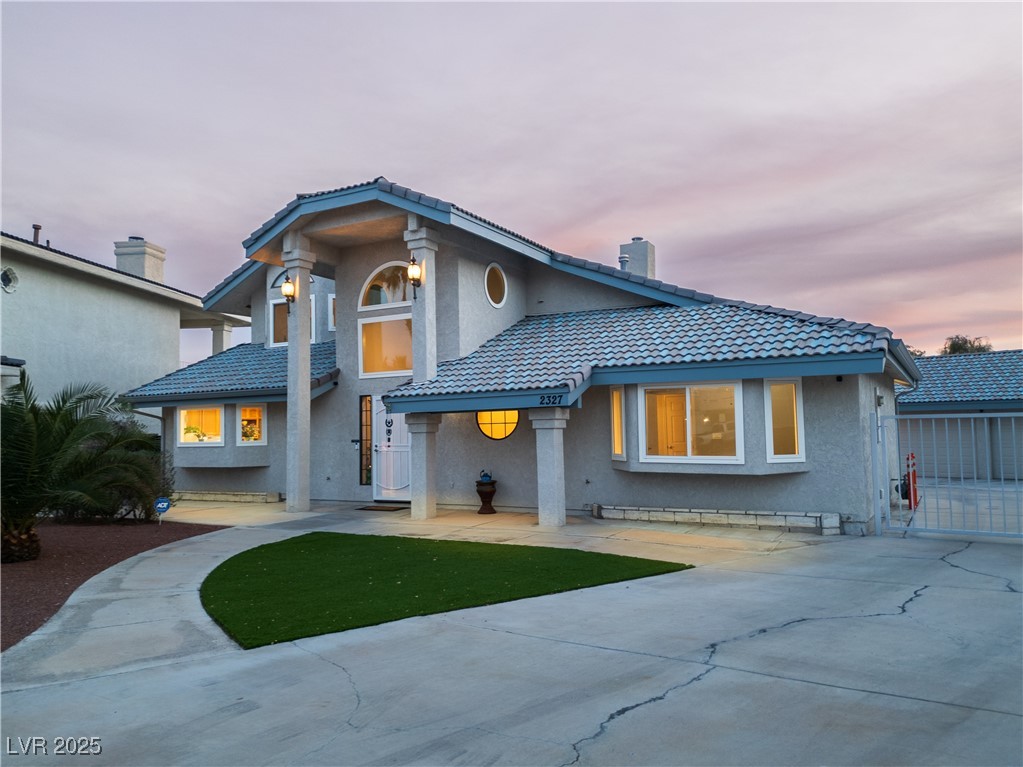
$540,000
3
bds
|
3
ba
|
2,350
sqft
|
built
1988
2327 River City Dr, Laughlin, NV 89029
$-625
Cash flow
-6.0%
Cash-on-Cash Return
4.3%
Cap rate
0.6%
Rent to Value Ratio
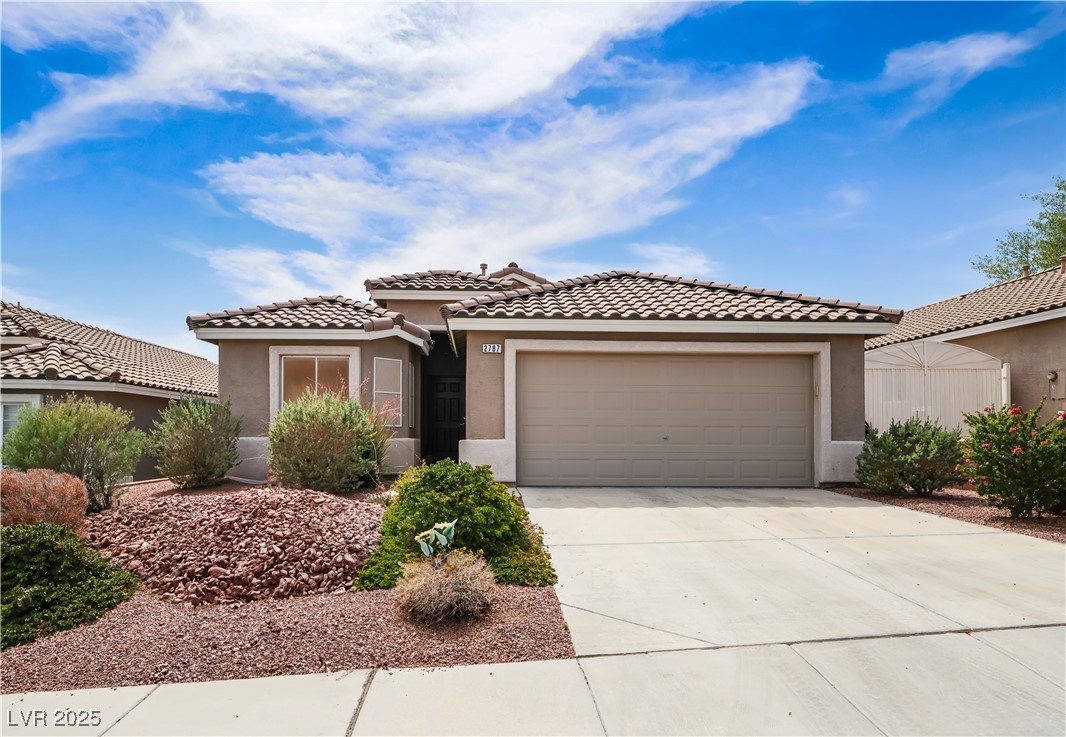
Active
$434,999
4
bds
|
2
ba
|
1,751
sqft
|
built
2007
2787 Sunken Ship St, Laughlin, NV 89029
$-628
Cash flow
-7.5%
Cash-on-Cash Return
3.9%
Cap rate
0.6%
Rent to Value Ratio
Active
$295,000
2
bds
|
2
ba
|
1,176
sqft
|
built
1988
3236 Manzanita Ln, Laughlin, NV 89029
$-425
Cash flow
-7.5%
Cash-on-Cash Return
3.9%
Cap rate
0.5%
Rent to Value Ratio
Active
$149,900
2
bds
|
1
ba
|
890
sqft
|
built
1990
3550 Bay Sands Dr, Laughlin, NV 89029
$-230
Cash flow
-8.0%
Cash-on-Cash Return
3.8%
Cap rate
0.8%
Rent to Value Ratio
Active
$169,999
3
bds
|
2
ba
|
1,194
sqft
|
built
1989
2072 Mesquite Ln, Laughlin, NV 89029
$-157
Cash flow
-4.8%
Cash-on-Cash Return
4.6%
Cap rate
0.8%
Rent to Value Ratio
Active
$140,000
2
bds
|
2
ba
|
986
sqft
|
built
1989
2064 Mesquite Ln, Laughlin, NV 89029
$-38
Cash flow
-1.4%
Cash-on-Cash Return
5.4%
Cap rate
1.0%
Rent to Value Ratio
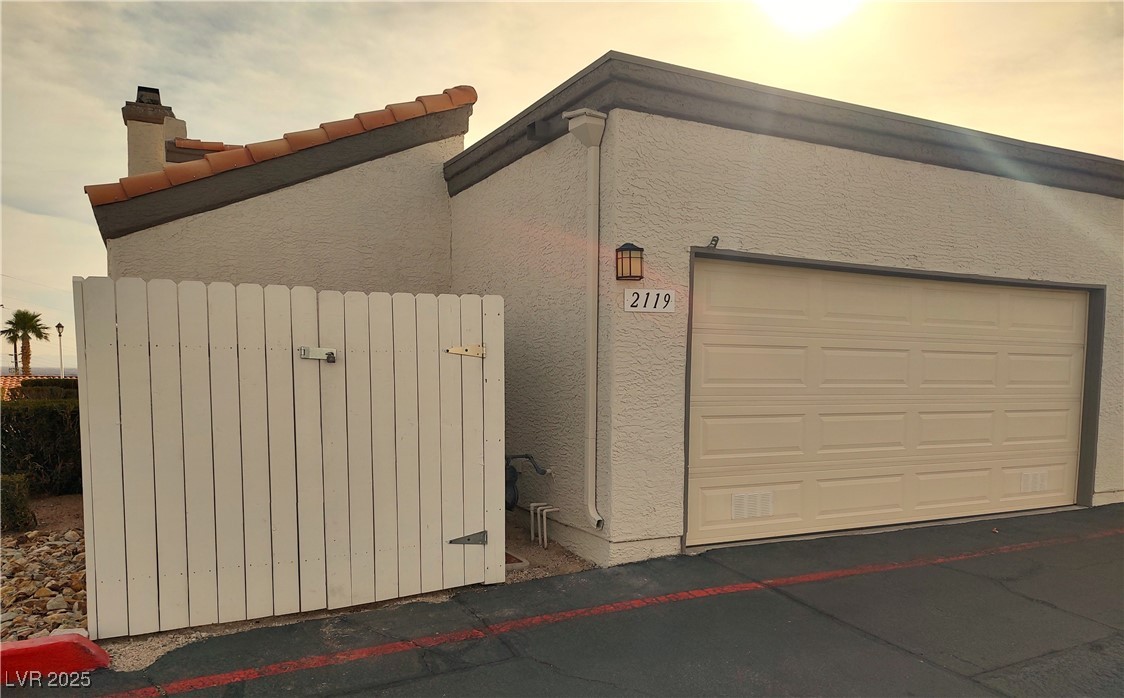
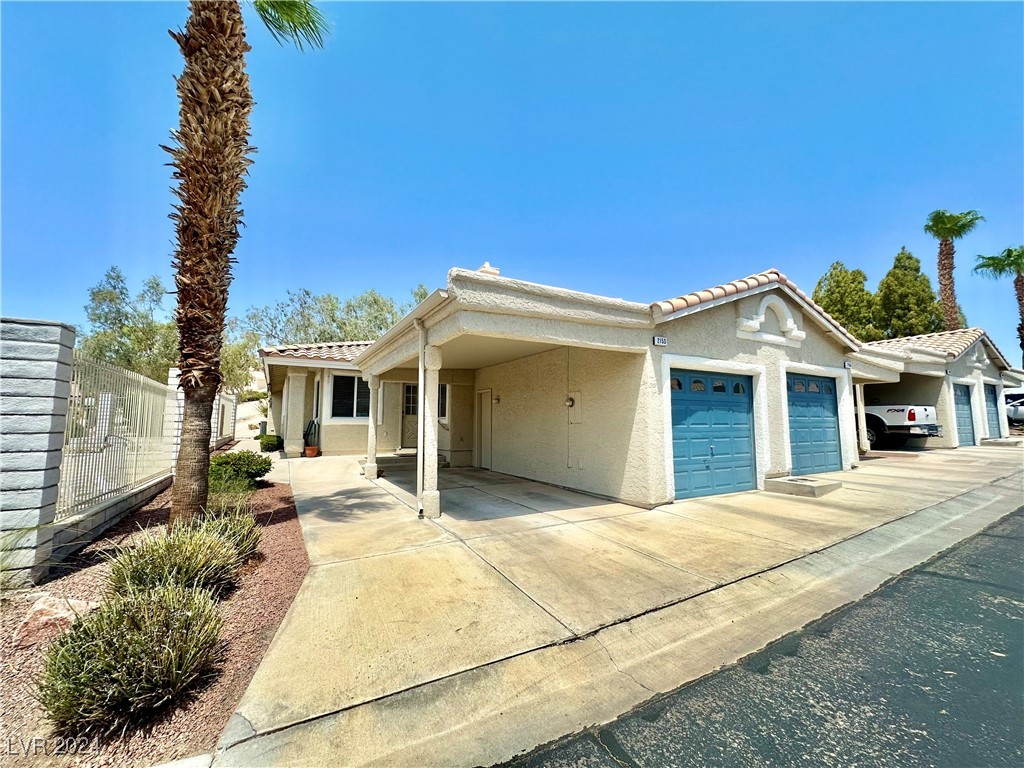
Active
$260,000
3
bds
|
2
ba
|
1,161
sqft
|
built
1987
2119 Pebble Creek Ln, Laughlin, NV 89029
$-489
Cash flow
-9.8%
Cash-on-Cash Return
3.4%
Cap rate
0.6%
Rent to Value Ratio
Active
$249,990
2
bds
|
2
ba
|
1,240
sqft
|
built
1994
2153 Camel Mesa Dr, Laughlin, NV 89029
$-580
Cash flow
-12.1%
Cash-on-Cash Return
2.9%
Cap rate
0.6%
Rent to Value Ratio

Active
$129,900
2
bds
|
2
ba
|
986
sqft
|
built
1989
2044 Mesquite Ln, Laughlin, NV 89029
$-200
Cash flow
-8.0%
Cash-on-Cash Return
3.8%
Cap rate
0.8%
Rent to Value Ratio
Active
$170,000
2
bds
|
2
ba
|
1,023
sqft
|
built
1988
1944 Las Palmas Ln, Laughlin, NV 89029
$-390
Cash flow
-12.0%
Cash-on-Cash Return
2.9%
Cap rate
0.7%
Rent to Value Ratio
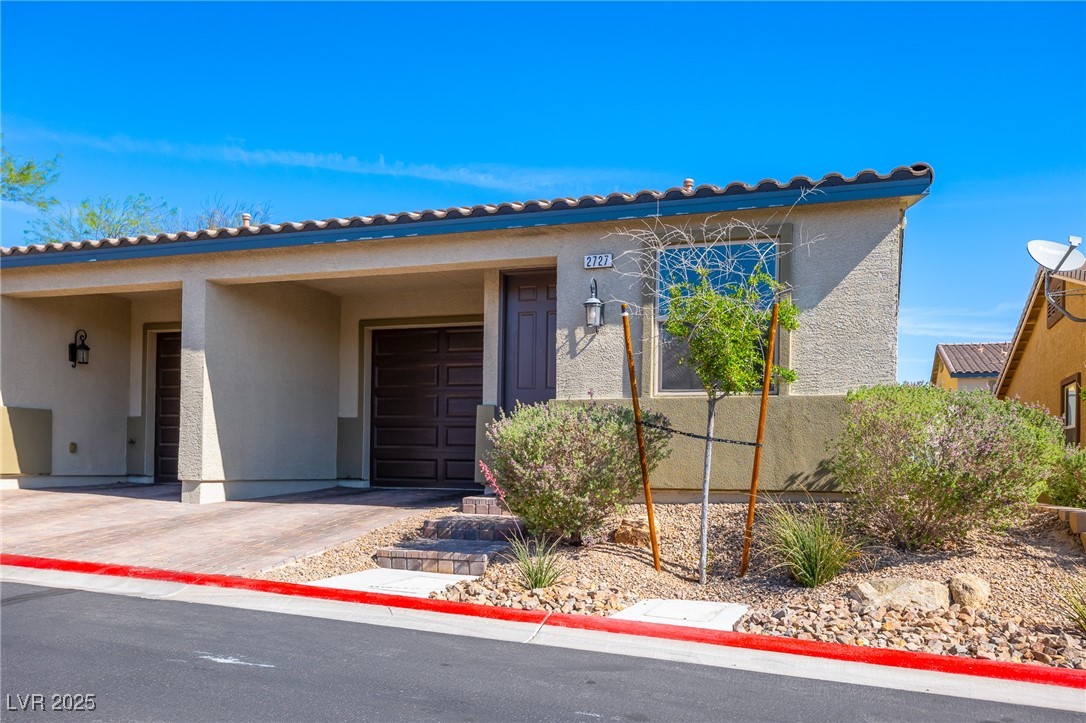
Active
$267,500
2
bds
|
2
ba
|
1,010
sqft
|
built
2019
2727 Chinaberry Hill St, Laughlin, NV 89029
$-496
Cash flow
-9.7%
Cash-on-Cash Return
3.5%
Cap rate
0.6%
Rent to Value Ratio

Active
$136,000
1
bds
|
1
ba
|
700
sqft
|
built
1989
1964 Las Palmas Ln, Laughlin, NV 89029
$-294
Cash flow
-11.3%
Cash-on-Cash Return
3.1%
Cap rate
0.8%
Rent to Value Ratio
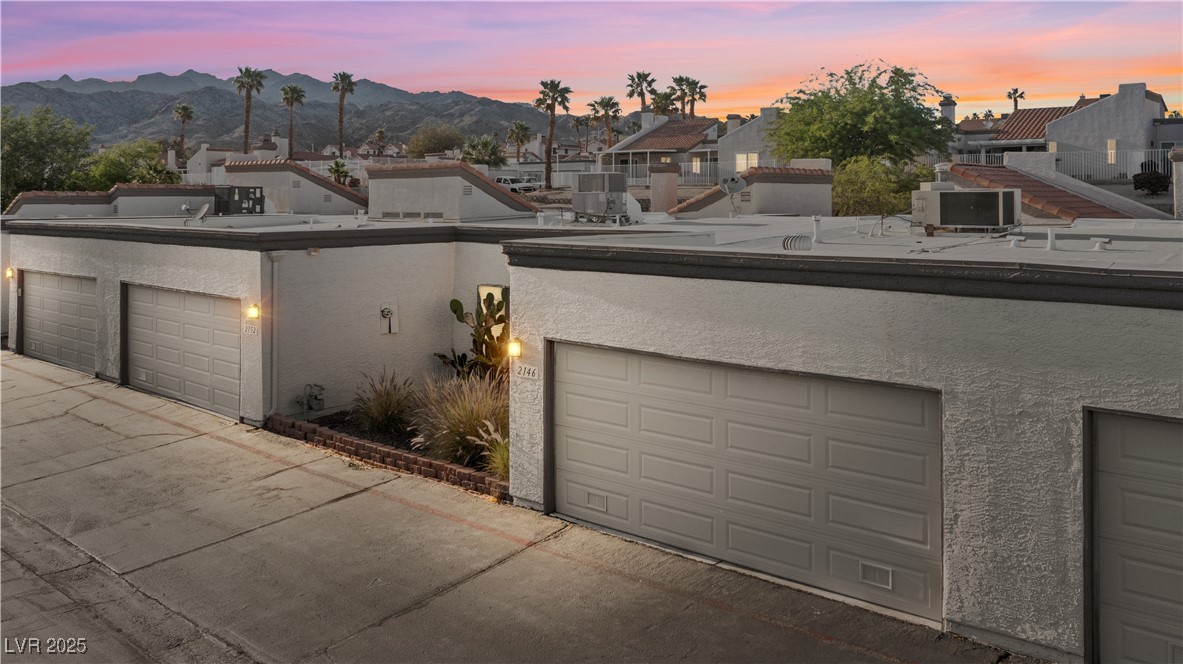
Active
$224,900
3
bds
|
2
ba
|
1,041
sqft
|
built
1988
2146 High Dunes Ln, Laughlin, NV 89029
$-294
Cash flow
-6.8%
Cash-on-Cash Return
4.1%
Cap rate
0.7%
Rent to Value Ratio
Active
$174,900
2
bds
|
2
ba
|
1,067
sqft
|
built
1990
3550 Bay Sands Dr, Laughlin, NV 89029
$-287
Cash flow
-8.6%
Cash-on-Cash Return
3.7%
Cap rate
0.8%
Rent to Value Ratio

Active
$169,500
2
bds
|
2
ba
|
1,023
sqft
|
built
1988
1952 Las Palmas Ln, Laughlin, NV 89029
$-194
Cash flow
-6.0%
Cash-on-Cash Return
4.3%
Cap rate
0.9%
Rent to Value Ratio

Active
$245,000
2
bds
|
2
ba
|
906
sqft
|
built
1987
2253 High Dunes Ln, Laughlin, NV 89029
$-381
Cash flow
-8.1%
Cash-on-Cash Return
3.8%
Cap rate
0.7%
Rent to Value Ratio
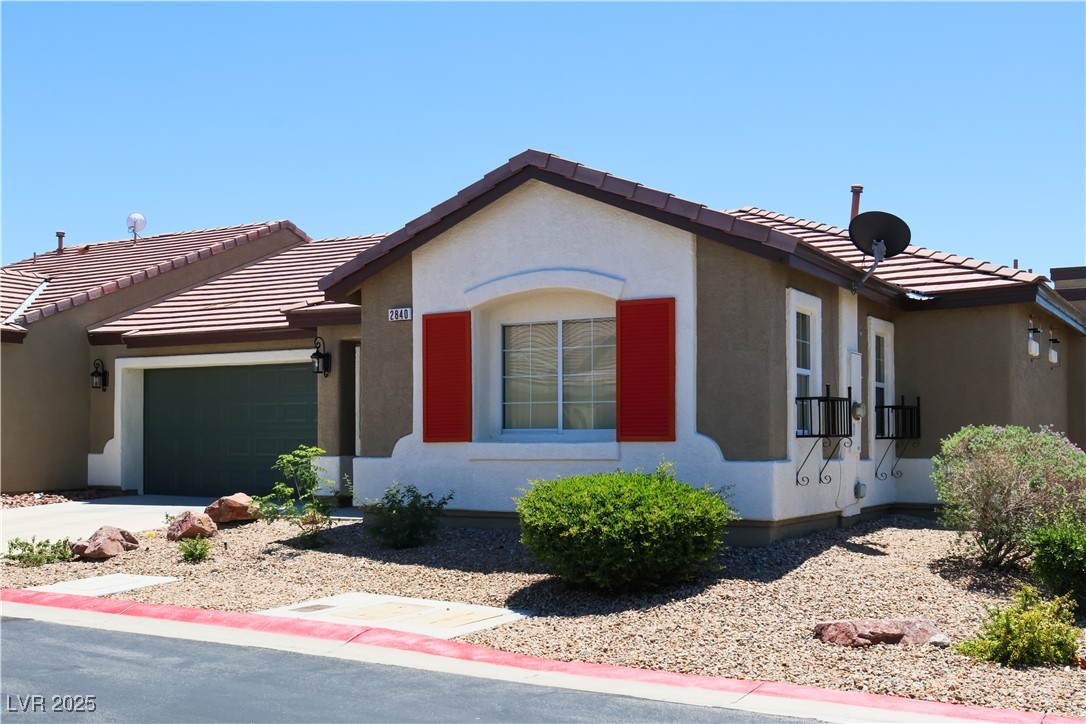
Active
$280,000
3
bds
|
2
ba
|
1,202
sqft
|
built
2008
2840 China Cove St, Laughlin, NV 89029
$-529
Cash flow
-9.9%
Cash-on-Cash Return
3.4%
Cap rate
0.6%
Rent to Value Ratio
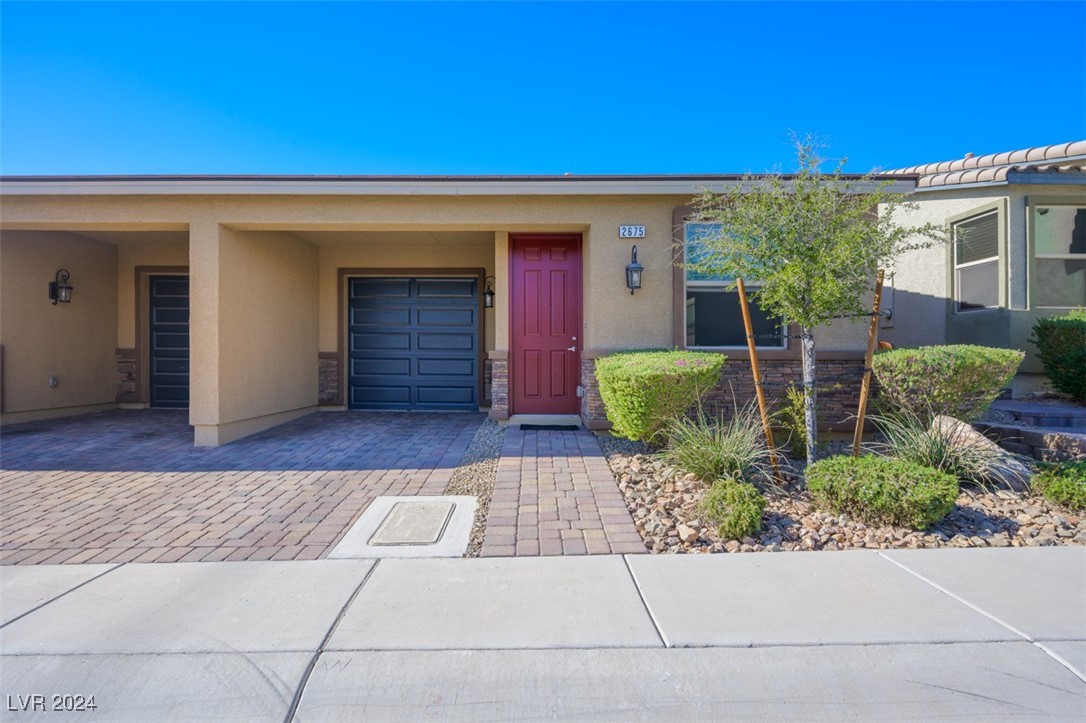
Active
$262,000
2
bds
|
2
ba
|
1,010
sqft
|
built
2019
2675 Chinaberry Hill St, Laughlin, NV 89029
$-526
Cash flow
-10.5%
Cash-on-Cash Return
3.3%
Cap rate
0.6%
Rent to Value Ratio
Active
$175,000
2
bds
|
2
ba
|
1,067
sqft
|
built
1990
3550 Bay Sands Dr, Laughlin, NV 89029
$-361
Cash flow
-10.8%
Cash-on-Cash Return
3.2%
Cap rate
0.7%
Rent to Value Ratio

Active
$280,000
2
bds
|
2
ba
|
954
sqft
|
built
2019
2707 Chinaberry Hill St, Laughlin, NV 89029
$-532
Cash flow
-9.9%
Cash-on-Cash Return
3.4%
Cap rate
0.6%
Rent to Value Ratio

Active
$167,500
2
bds
|
1
ba
|
810
sqft
|
built
1984
3790 Desert Marina Dr, Laughlin, NV 89029
$-269
Cash flow
-8.4%
Cash-on-Cash Return
3.8%
Cap rate
0.8%
Rent to Value Ratio
Active
$185,000
2
bds
|
2
ba
|
1,208
sqft
|
built
2011
3550 Bay Sands Dr, Laughlin, NV 89029
$-255
Cash flow
-7.2%
Cash-on-Cash Return
4.0%
Cap rate
0.8%
Rent to Value Ratio
Active
$118,500
1
bds
|
1
ba
|
572
sqft
|
built
1990
3550 Bay Sands Dr, Laughlin, NV 89029
$-75
Cash flow
-3.3%
Cash-on-Cash Return
4.9%
Cap rate
1.0%
Rent to Value Ratio

Active
$173,000
2
bds
|
1
ba
|
999
sqft
|
built
2011
3550 Bay Sands Dr, Laughlin, NV 89029
$-234
Cash flow
-7.1%
Cash-on-Cash Return
4.1%
Cap rate
0.8%
Rent to Value Ratio