Laughlin, NV Investment Properties for Sale
Browse homes for sale and investment properties in Laughlin, NV. Refine your search by price, property type, or more.
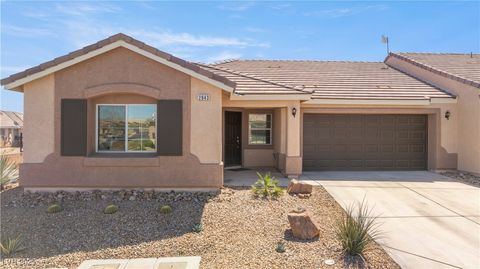
Best cash flowing properties in Laughlin, NV
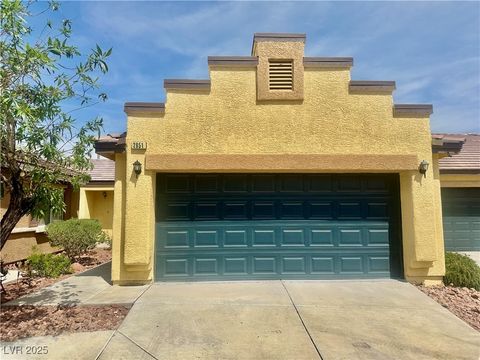
Active
$129,900
3
bds
|
2
ba
|
1,194
sqft
|
built
1989
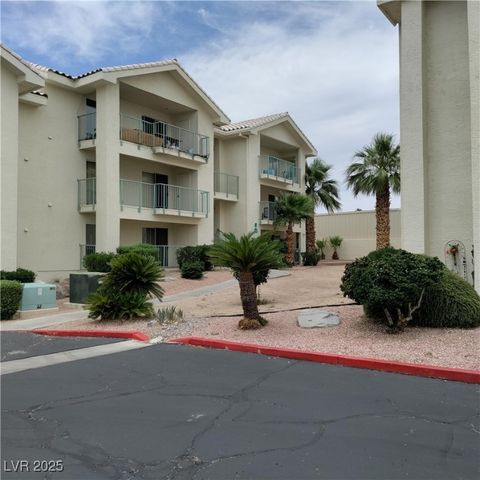
2012 Mesquite Ln, Laughlin, NV 89029
$-5
Cash flow
-0.2%
Cash-on-Cash Return
5.6%
Cap rate
1.1%
Rent to Value Ratio
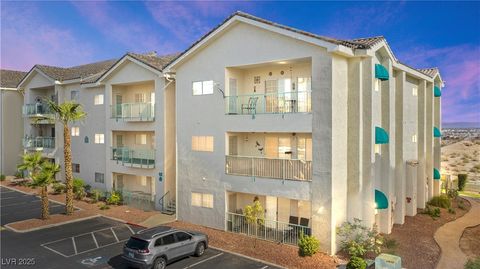
Active
$130,000
2
bds
|
2
ba
|
990
sqft
|
built
1989
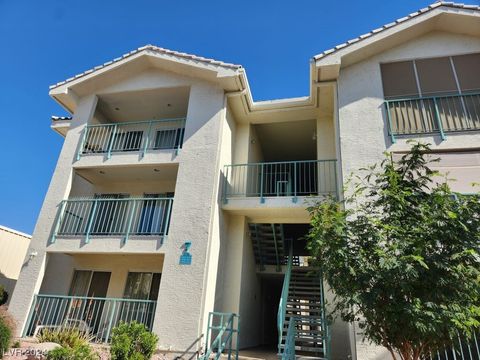
2004 Mesquite Ln, Laughlin, NV 89029
$-162
Cash flow
-6.5%
Cash-on-Cash Return
4.2%
Cap rate
0.8%
Rent to Value Ratio
118 out of 119 properties for sale in Laughlin, NV
Limited Results Shown
Create a free account, or log in to reveal all property listings and enjoy the complete experience.
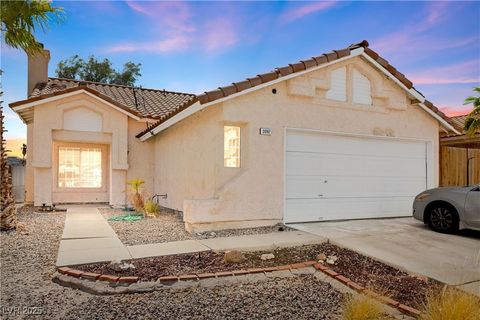
Active
$185,000
3
bds
|
2
ba
|
1,208
sqft
|
built
1987
1936 Las Palmas Ln, Laughlin, NV 89029
$-348
Cash flow
-9.8%
Cash-on-Cash Return
3.4%
Cap rate
0.8%
Rent to Value Ratio
Active
$178,990
2
bds
|
2
ba
|
900
sqft
|
built
1990
2160 Highpointe Dr, Laughlin, NV 89029
$-448
Cash flow
-13.1%
Cash-on-Cash Return
2.7%
Cap rate
0.6%
Rent to Value Ratio
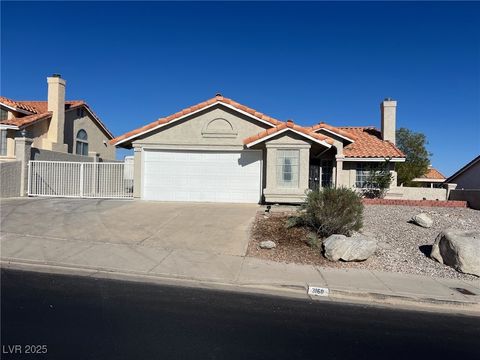
Active
$340,000
2
bds
|
2
ba
|
944
sqft
|
built
1984
1731 Paloma Ave, Laughlin, NV 89029
$-704
Cash flow
-10.8%
Cash-on-Cash Return
3.2%
Cap rate
0.4%
Rent to Value Ratio
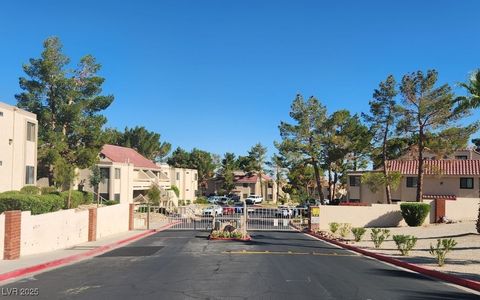
Active
$185,000
2
bds
|
2
ba
|
1,205
sqft
|
built
1984
3791 Desert Marina Dr, Laughlin, NV 89029
$-369
Cash flow
-10.4%
Cash-on-Cash Return
3.3%
Cap rate
0.8%
Rent to Value Ratio
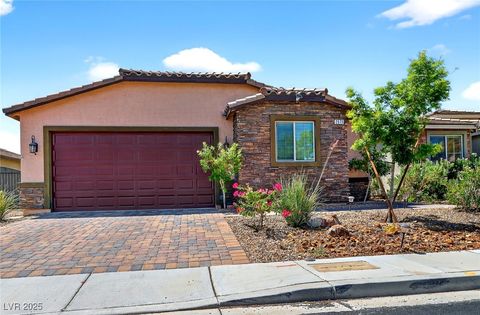
Active
$215,990
2
bds
|
2
ba
|
1,205
sqft
|
built
1984
3740 Desert Marina Dr, Laughlin, NV 89029
$-527
Cash flow
-12.7%
Cash-on-Cash Return
2.8%
Cap rate
0.6%
Rent to Value Ratio
Active
$230,000
3
bds
|
2
ba
|
1,161
sqft
|
built
1987
2148 Pebble Creek Ln, Laughlin, NV 89029
$-317
Cash flow
-7.2%
Cash-on-Cash Return
4.0%
Cap rate
0.7%
Rent to Value Ratio
Active
$300,000
3
bds
|
2
ba
|
1,404
sqft
|
built
2018
2175 Limestone Cove Ct, Laughlin, NV 89029
$-520
Cash flow
-9.0%
Cash-on-Cash Return
3.6%
Cap rate
0.6%
Rent to Value Ratio
Active
$189,900
2
bds
|
2
ba
|
1,067
sqft
|
built
1990
3550 Bay Sands Dr, Laughlin, NV 89029
$-272
Cash flow
-7.5%
Cash-on-Cash Return
4.0%
Cap rate
0.7%
Rent to Value Ratio
Active
$198,800
2
bds
|
2
ba
|
900
sqft
|
built
1990
2240 Highpointe Dr, Laughlin, NV 89029
$-403
Cash flow
-10.6%
Cash-on-Cash Return
3.2%
Cap rate
0.7%
Rent to Value Ratio
Active
$429,900
4
bds
|
3
ba
|
1,906
sqft
|
built
2017
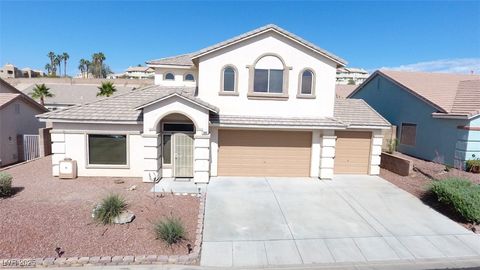
2748 Brinkley Manor St, Laughlin, NV 89029
$-1,288
Cash flow
-15.6%
Cash-on-Cash Return
2.1%
Cap rate
0.4%
Rent to Value Ratio
Active
$299,999
3
bds
|
2
ba
|
1,404
sqft
|
built
2007
2851 China Cove St, Laughlin, NV 89029
$-577
Cash flow
-10.0%
Cash-on-Cash Return
3.4%
Cap rate
0.6%
Rent to Value Ratio
Active
$159,900
2
bds
|
2
ba
|
1,208
sqft
|
built
1994
3550 Bay Sands Dr, Laughlin, NV 89029
$-184
Cash flow
-6.0%
Cash-on-Cash Return
4.3%
Cap rate
0.9%
Rent to Value Ratio
Active
$215,000
2
bds
|
2
ba
|
1,205
sqft
|
built
1984
3750 Desert Marina Dr, Laughlin, NV 89029
$-521
Cash flow
-12.6%
Cash-on-Cash Return
2.8%
Cap rate
0.7%
Rent to Value Ratio
Active
$239,000
2
bds
|
3
ba
|
1,634
sqft
|
built
1989
3859 Desert Marina Dr, Laughlin, NV 89029
$-368
Cash flow
-8.0%
Cash-on-Cash Return
3.8%
Cap rate
0.8%
Rent to Value Ratio
Active
$390,000
3
bds
|
3
ba
|
2,248
sqft
|
built
2003
2905 Shimmering Bay St, Laughlin, NV 89029
$-615
Cash flow
-8.2%
Cash-on-Cash Return
3.8%
Cap rate
0.5%
Rent to Value Ratio
Active
$159,990
2
bds
|
2
ba
|
986
sqft
|
built
1989
2064 Mesquite Ln, Laughlin, NV 89029
$-333
Cash flow
-10.9%
Cash-on-Cash Return
3.2%
Cap rate
0.7%
Rent to Value Ratio

Active
$459,990
4
bds
|
3
ba
|
2,728
sqft
|
built
1989
2089 Avalon Dr, Laughlin, NV 89029
$-858
Cash flow
-9.7%
Cash-on-Cash Return
3.4%
Cap rate
0.5%
Rent to Value Ratio
Active
$225,000
2
bds
|
2
ba
|
900
sqft
|
built
1989
2191 Bay Club Dr, Laughlin, NV 89029
$-413
Cash flow
-9.6%
Cash-on-Cash Return
3.5%
Cap rate
0.6%
Rent to Value Ratio
Active
$195,000
2
bds
|
2
ba
|
1,120
sqft
|
built
1989
2191 Bay Club Dr, Laughlin, NV 89029
$-432
Cash flow
-11.6%
Cash-on-Cash Return
3.0%
Cap rate
0.7%
Rent to Value Ratio
Active
$440,000
4
bds
|
3
ba
|
2,129
sqft
|
built
2016
2040 Port Royal Dr, Laughlin, NV 89029
$-932
Cash flow
-11.1%
Cash-on-Cash Return
3.1%
Cap rate
0.5%
Rent to Value Ratio
Active
$414,900
4
bds
|
3
ba
|
2,332
sqft
|
built
1988
2111 River City Dr, Laughlin, NV 89029
$-397
Cash flow
-5.0%
Cash-on-Cash Return
4.5%
Cap rate
0.6%
Rent to Value Ratio
Active
$282,500
3
bds
|
2
ba
|
1,244
sqft
|
built
1989
2266 Carved Canyon Ln, Laughlin, NV 89029
$-322
Cash flow
-5.9%
Cash-on-Cash Return
4.3%
Cap rate
0.6%
Rent to Value Ratio
Active
$239,500
3
bds
|
3
ba
|
1,617
sqft
|
built
1993
2208 Rugged Mesa Dr, Laughlin, NV 89029
$-530
Cash flow
-11.5%
Cash-on-Cash Return
3.0%
Cap rate
0.7%
Rent to Value Ratio
Active
$136,800
1
bds
|
1
ba
|
716
sqft
|
built
1990
3550 Bay Sands Dr, Laughlin, NV 89029
$-226
Cash flow
-8.6%
Cash-on-Cash Return
3.7%
Cap rate
0.8%
Rent to Value Ratio
Active
$110,000
1
bds
|
1
ba
|
572
sqft
|
built
1990
3550 Bay Sands Dr, Laughlin, NV 89029
$-231
Cash flow
-11.0%
Cash-on-Cash Return
3.2%
Cap rate
0.8%
Rent to Value Ratio
Active
$290,000
3
bds
|
2
ba
|
1,202
sqft
|
built
2017
2225 Chandler Ranch Pl, Laughlin, NV 89029
$-442
Cash flow
-8.0%
Cash-on-Cash Return
3.8%
Cap rate
0.6%
Rent to Value Ratio
Active
$141,400
2
bds
|
1
ba
|
810
sqft
|
built
1984
3791 Desert Marina Dr, Laughlin, NV 89029
$-353
Cash flow
-13.0%
Cash-on-Cash Return
2.7%
Cap rate
0.8%
Rent to Value Ratio
Active
$279,900
3
bds
|
2
ba
|
1,244
sqft
|
built
1989
3097 Canyon Terrace Dr, Laughlin, NV 89029
$-384
Cash flow
-7.2%
Cash-on-Cash Return
4.0%
Cap rate
0.6%
Rent to Value Ratio
Active
$349,900
3
bds
|
2
ba
|
1,358
sqft
|
built
1988
3160 James A Bilbray Pkwy, Laughlin, NV 89029
$-770
Cash flow
-11.5%
Cash-on-Cash Return
3.0%
Cap rate
0.4%
Rent to Value Ratio
Active
$135,000
2
bds
|
1
ba
|
810
sqft
|
built
1984
3771 Desert Marina Dr, Laughlin, NV 89029
$-315
Cash flow
-12.2%
Cash-on-Cash Return
2.9%
Cap rate
0.8%
Rent to Value Ratio
Active
$399,990
4
bds
|
3
ba
|
1,906
sqft
|
built
2017
2079 Port Royal Dr, Laughlin, NV 89029
$-794
Cash flow
-10.4%
Cash-on-Cash Return
3.3%
Cap rate
0.5%
Rent to Value Ratio
Active
$293,000
3
bds
|
2
ba
|
1,202
sqft
|
built
2008
2843 China Cove St, Laughlin, NV 89029
$-434
Cash flow
-7.7%
Cash-on-Cash Return
3.9%
Cap rate
0.6%
Rent to Value Ratio
Active
$147,000
1
bds
|
1
ba
|
716
sqft
|
built
1990
3550 Bay Sands Dr, Laughlin, NV 89029
$-182
Cash flow
-6.5%
Cash-on-Cash Return
4.2%
Cap rate
0.8%
Rent to Value Ratio
Active
$415,000
4
bds
|
3
ba
|
1,906
sqft
|
built
2017
2772 Brinkley Manor St, Laughlin, NV 89029
$-865
Cash flow
-10.9%
Cash-on-Cash Return
3.2%
Cap rate
0.5%
Rent to Value Ratio
Active
$174,950
2
bds
|
1
ba
|
810
sqft
|
built
1984
3791 Desert Marina Dr, Laughlin, NV 89029
$-307
Cash flow
-9.2%
Cash-on-Cash Return
3.6%
Cap rate
0.8%
Rent to Value Ratio

Active
$144,900
2
bds
|
1
ba
|
890
sqft
|
built
1990
3550 Bay Sands Dr, Laughlin, NV 89029
$-207
Cash flow
-7.5%
Cash-on-Cash Return
4.0%
Cap rate
0.8%
Rent to Value Ratio
Active
$379,990
3
bds
|
2
ba
|
1,931
sqft
|
built
1988
3218 Ocotillo Dr, Laughlin, NV 89029
$-592
Cash flow
-8.1%
Cash-on-Cash Return
3.8%
Cap rate
0.5%
Rent to Value Ratio

Active
$437,900
4
bds
|
2
ba
|
1,751
sqft
|
built
2007
2787 Sunken Ship St, Laughlin, NV 89029
$-641
Cash flow
-7.6%
Cash-on-Cash Return
3.9%
Cap rate
0.5%
Rent to Value Ratio