Leland, NC Investment Properties for Sale
Browse homes for sale and investment properties in Leland, NC. Refine your search by price, property type, or more.
Best cash flowing properties in Leland, NC
Active
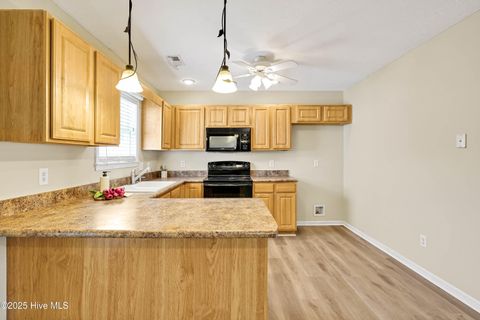
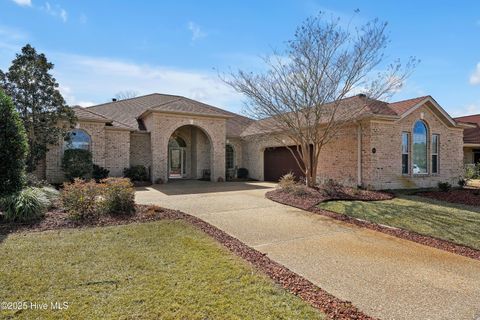
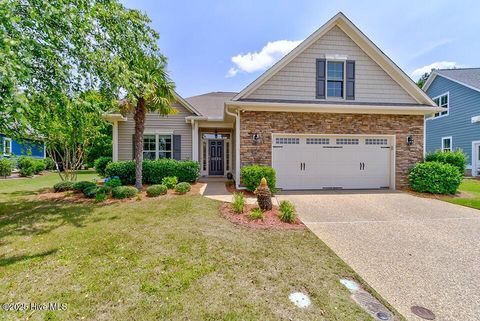
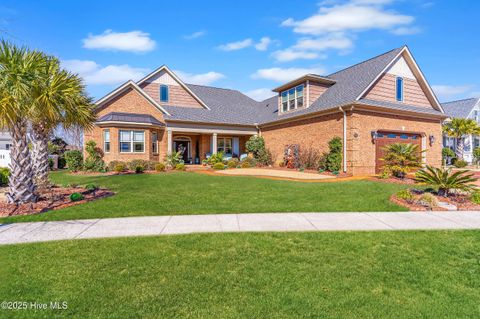
$299,000
3
bds
|
2
ba
|
1,630
sqft
|
built
2006
1965 Jeffrey Stokes Dr NE, Leland, NC 28451
$-66
Cash flow
-1.2%
Cash-on-Cash Return
5.4%
Cap rate
0.7%
Rent to Value Ratio
Active
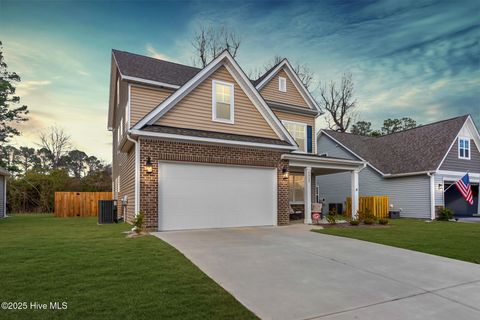
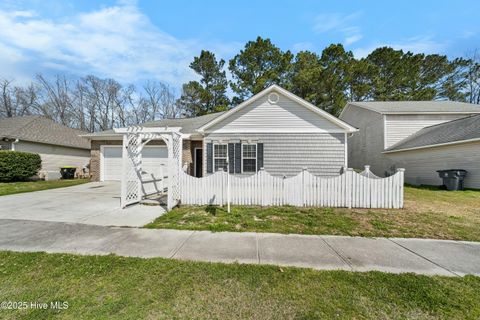
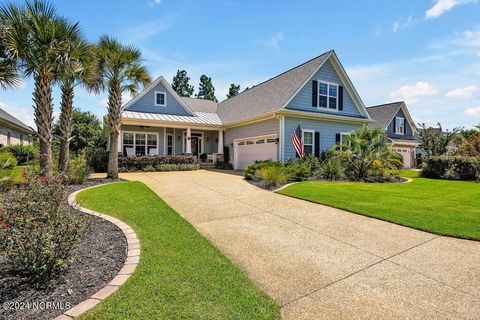
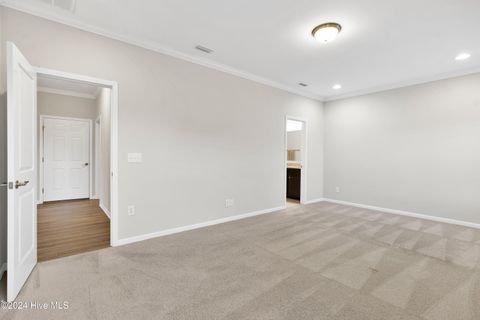
$435,000
4
bds
|
3
ba
|
2,339
sqft
|
built
2022
8838 Colbert Place Dr, Leland, NC 28451
$-127
Cash flow
-1.5%
Cash-on-Cash Return
5.3%
Cap rate
0.6%
Rent to Value Ratio
81 out of 181 properties for sale in Leland, NC
Limited Results Shown
Create a free account, or log in to reveal all property listings and enjoy the complete experience.
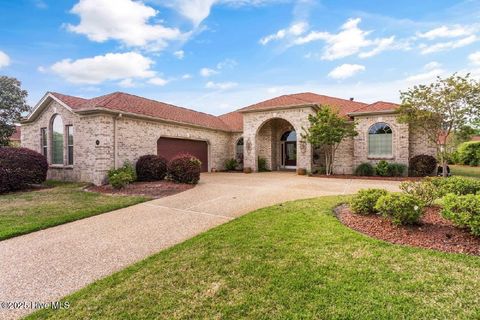
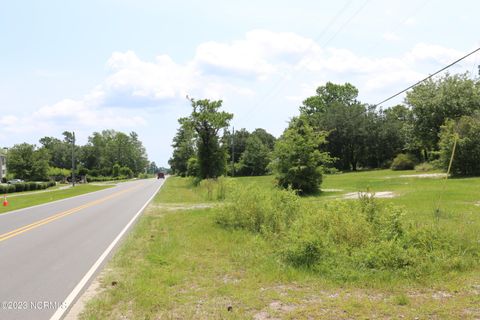
Active
$722,500
3
bds
|
4
ba
|
2,851
sqft
|
built
2008
2316 Villager Ct, Leland, NC 28451
$-1,527
Cash flow
-11.0%
Cash-on-Cash Return
3.1%
Cap rate
0.4%
Rent to Value Ratio
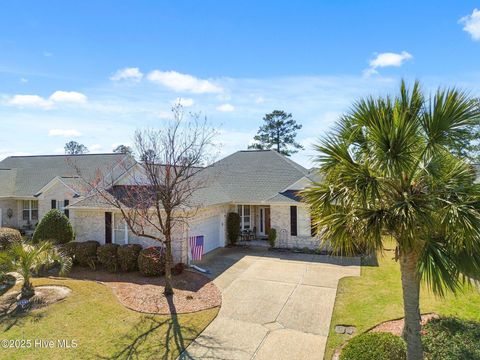
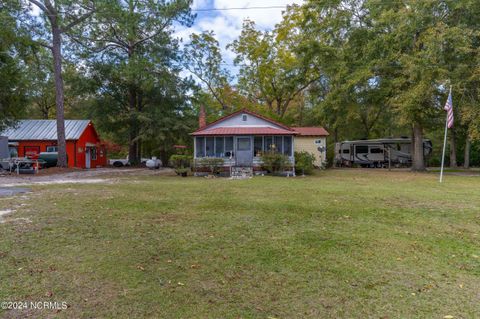
Active
$715,000
4
bds
|
3
ba
|
2,531
sqft
|
built
2015
2328 Sugargrove Trl NE, Leland, NC 28451
$-969
Cash flow
-7.1%
Cash-on-Cash Return
4.1%
Cap rate
0.5%
Rent to Value Ratio
Active
$372,000
3
bds
|
2
ba
|
1,415
sqft
|
built
2005
1025 Garden Club Way, Leland, NC 28451
$-587
Cash flow
-8.2%
Cash-on-Cash Return
3.8%
Cap rate
0.6%
Rent to Value Ratio
Active
$1,300,000
3
bds
|
3
ba
|
3,475
sqft
|
built
2018
8800 Maple Ash Trl NE, Leland, NC 28451
$-4,172
Cash flow
-16.7%
Cash-on-Cash Return
1.8%
Cap rate
0.2%
Rent to Value Ratio
Active
$590,000
4
bds
|
3
ba
|
2,266
sqft
|
built
2015
2111 Shelmore Way, Leland, NC 28451
$-1,277
Cash flow
-11.3%
Cash-on-Cash Return
3.1%
Cap rate
0.5%
Rent to Value Ratio
Active
$675,000
4
bds
|
3
ba
|
3,085
sqft
|
built
2005
1008 Natural Springs Way, Leland, NC 28451
$-1,449
Cash flow
-11.2%
Cash-on-Cash Return
3.1%
Cap rate
0.5%
Rent to Value Ratio
Active
$514,900
3
bds
|
2
ba
|
2,550
sqft
|
built
1991
85 Bridle Way SE, Leland, NC 28451
$-850
Cash flow
-8.6%
Cash-on-Cash Return
3.7%
Cap rate
0.4%
Rent to Value Ratio
Active
$545,000
3
bds
|
4
ba
|
2,586
sqft
|
built
2000
1545 Grandiflora Dr, Leland, NC 28451
$-909
Cash flow
-8.7%
Cash-on-Cash Return
3.7%
Cap rate
0.5%
Rent to Value Ratio
Active
$439,500
4
bds
|
4
ba
|
2,183
sqft
|
built
2017
2262 Low Country Blvd, Leland, NC 28451
$-968
Cash flow
-11.5%
Cash-on-Cash Return
3.0%
Cap rate
0.6%
Rent to Value Ratio
Active
$283,900
3
bds
|
2
ba
|
1,280
sqft
|
built
2021
4071 Ironstone Ct, Leland, NC 28451
$-169
Cash flow
-3.1%
Cash-on-Cash Return
5.0%
Cap rate
0.7%
Rent to Value Ratio
Active
$469,000
6
bds
|
4
ba
|
3,150
sqft
|
built
2015
2057 Lapham Dr, Leland, NC 28451
$-588
Cash flow
-6.5%
Cash-on-Cash Return
4.2%
Cap rate
0.6%
Rent to Value Ratio
Active
$379,000
4
bds
|
3
ba
|
1,956
sqft
|
built
2006
222 Planters Ct, Leland, NC 28451
$-266
Cash flow
-3.7%
Cash-on-Cash Return
4.8%
Cap rate
0.7%
Rent to Value Ratio
Active
$679,000
4
bds
|
2
ba
|
3,031
sqft
|
built
2000
1124 Willow Pond Ln, Leland, NC 28451
$-1,450
Cash flow
-11.1%
Cash-on-Cash Return
3.1%
Cap rate
0.5%
Rent to Value Ratio
Active
$650,000
3
bds
|
2
ba
|
2,808
sqft
|
built
2017
1115 Eldora Ct, Leland, NC 28451
$-1,821
Cash flow
-14.6%
Cash-on-Cash Return
2.3%
Cap rate
0.4%
Rent to Value Ratio
Active
$1,195,000
4
bds
|
3
ba
|
4,171
sqft
|
built
2021
2295 Pine Mill Trl NE, Leland, NC 28451
$-3,469
Cash flow
-15.1%
Cash-on-Cash Return
2.2%
Cap rate
0.3%
Rent to Value Ratio

Active
$385,000
3
bds
|
2
ba
|
1,638
sqft
|
built
2019
1269 Greensview Cir, Leland, NC 28451
$-906
Cash flow
-12.3%
Cash-on-Cash Return
2.9%
Cap rate
0.6%
Rent to Value Ratio
Active
$410,000
3
bds
|
3
ba
|
2,014
sqft
|
built
2008
1220 Springvale Terrace Ct, Leland, NC 28451
$-498
Cash flow
-6.3%
Cash-on-Cash Return
4.2%
Cap rate
0.6%
Rent to Value Ratio
Active
$275,000
3
bds
|
3
ba
|
1,502
sqft
|
built
2022
3659 Roseblossom Dr, Leland, NC 28451
$-462
Cash flow
-8.8%
Cash-on-Cash Return
3.7%
Cap rate
0.7%
Rent to Value Ratio
Active
$785,000
3
bds
|
4
ba
|
3,598
sqft
|
built
2009
2244 Villamar Dr, Leland, NC 28451
$-1,606
Cash flow
-10.7%
Cash-on-Cash Return
3.2%
Cap rate
0.5%
Rent to Value Ratio
Active
$324,900
3
bds
|
2
ba
|
2,052
sqft
|
built
2005
1012 Lake Norman Ln, Leland, NC 28451
$-242
Cash flow
-3.9%
Cash-on-Cash Return
4.8%
Cap rate
0.7%
Rent to Value Ratio
Active
$299,000
3
bds
|
2
ba
|
1,630
sqft
|
built
2006
1965 Jeffrey Stokes Dr NE, Leland, NC 28451
$-66
Cash flow
-1.2%
Cash-on-Cash Return
5.4%
Cap rate
0.7%
Rent to Value Ratio

Active
$378,300
4
bds
|
3
ba
|
1,969
sqft
|
built
2018
745 Avington Ln NE, Leland, NC 28451
$-361
Cash flow
-5.0%
Cash-on-Cash Return
4.5%
Cap rate
0.6%
Rent to Value Ratio
Active
$284,900
3
bds
|
2
ba
|
1,124
sqft
|
built
2005
1018 Ashland Way, Leland, NC 28451
$-146
Cash flow
-2.7%
Cash-on-Cash Return
5.1%
Cap rate
0.7%
Rent to Value Ratio

Active
$550,000
3
bds
|
3
ba
|
2,267
sqft
|
built
2021
2267 Reefside Loop NE, Leland, NC 28451
$-1,365
Cash flow
-12.9%
Cash-on-Cash Return
2.7%
Cap rate
0.4%
Rent to Value Ratio
Active
$284,900
3
bds
|
2
ba
|
1,177
sqft
|
built
2003
637 Lanvale Hills Cir, Leland, NC 28451
$-260
Cash flow
-4.8%
Cash-on-Cash Return
4.6%
Cap rate
0.6%
Rent to Value Ratio

Active
$699,999
5
bds
|
4
ba
|
2,526
sqft
|
built
1962
122 Old Fayetteville Rd, Leland, NC 28451
$-1,610
Cash flow
-12.0%
Cash-on-Cash Return
2.9%
Cap rate
0.4%
Rent to Value Ratio
Active
$639,900
4
bds
|
4
ba
|
2,885
sqft
|
built
2003
1031 W Cove Loop, Leland, NC 28451
$-1,198
Cash flow
-9.8%
Cash-on-Cash Return
3.4%
Cap rate
0.5%
Rent to Value Ratio
Active
$249,000
2
bds
|
2
ba
|
1,126
sqft
|
built
2017
1180 Red Bay Pl, Leland, NC 28451
$-350
Cash flow
-7.3%
Cash-on-Cash Return
4.0%
Cap rate
0.7%
Rent to Value Ratio
Active
$435,000
4
bds
|
3
ba
|
2,339
sqft
|
built
2022
8838 Colbert Place Dr, Leland, NC 28451
$-127
Cash flow
-1.5%
Cash-on-Cash Return
5.3%
Cap rate
0.6%
Rent to Value Ratio
Active
$445,000
3
bds
|
3
ba
|
1,702
sqft
|
built
2021
5812 Park West Cir, Leland, NC 28451
$-876
Cash flow
-10.3%
Cash-on-Cash Return
3.3%
Cap rate
0.6%
Rent to Value Ratio
Active
$369,000
3
bds
|
2
ba
|
1,725
sqft
|
built
2007
1133 Lillibridge Dr, Leland, NC 28451
$-678
Cash flow
-9.6%
Cash-on-Cash Return
3.5%
Cap rate
0.6%
Rent to Value Ratio
Active
$600,000
4
bds
|
2
ba
|
2,225
sqft
|
built
2012
2173 Palm Pointe, Leland, NC 28451
$-1,061
Cash flow
-9.2%
Cash-on-Cash Return
3.6%
Cap rate
0.5%
Rent to Value Ratio
Active
$749,000
3
bds
|
4
ba
|
2,838
sqft
|
built
2017
2369 Red Birch Trl NE, Leland, NC 28451
$-1,294
Cash flow
-9.0%
Cash-on-Cash Return
3.6%
Cap rate
0.5%
Rent to Value Ratio
Active
$773,000
4
bds
|
3
ba
|
2,908
sqft
|
built
2015
2514 Sugargrove Trl NE, Leland, NC 28451
$-1,614
Cash flow
-10.9%
Cash-on-Cash Return
3.2%
Cap rate
0.5%
Rent to Value Ratio
Active
$650,000
3
bds
|
3
ba
|
2,552
sqft
|
built
2016
2621 Empie Dr, Leland, NC 28451
$-1,469
Cash flow
-11.8%
Cash-on-Cash Return
3.0%
Cap rate
0.5%
Rent to Value Ratio
Active
$1,190,000
4
bds
|
4
ba
|
4,510
sqft
|
built
2019
8383 S Shoreside Way NE, Leland, NC 28451
$-2,669
Cash flow
-11.7%
Cash-on-Cash Return
3.0%
Cap rate
0.4%
Rent to Value Ratio
Active
$530,000
3
bds
|
4
ba
|
2,278
sqft
|
built
2017
4010 Druids Glen Dr, Leland, NC 28451
$-625
Cash flow
-6.2%
Cash-on-Cash Return
4.3%
Cap rate
0.6%
Rent to Value Ratio
Active
$1,250,000
3
bds
|
1
ba
|
2,800
sqft
|
built
1960
127 Old Fayetteville Rd, Leland, NC 28451
$-3,669
Cash flow
-15.3%
Cash-on-Cash Return
2.2%
Cap rate
0.3%
Rent to Value Ratio

Active
$525,000
4
bds
|
3
ba
|
3,165
sqft
|
built
2007
1109 Foxbow Cv, Leland, NC 28451
$-764
Cash flow
-7.6%
Cash-on-Cash Return
3.9%
Cap rate
0.6%
Rent to Value Ratio
Active
$420,000
2
bds
|
2
ba
|
968
sqft
|
built
1948
2794 Bee Tree Farm Trl NE, Leland, NC 28451
$-648
Cash flow
-8.0%
Cash-on-Cash Return
3.8%
Cap rate
0.5%
Rent to Value Ratio