Wilmington, NC Investment Properties for Sale
Browse homes for sale and investment properties in Wilmington, NC. Refine your search by price, property type, or more.
Best cash flowing properties in Wilmington, NC
Active
$325,000
3
bds
|
2
ba
|
1,152
sqft
|
built
1941
3262 Camden Cir, Wilmington, NC 28403
$-14
Cash flow
-0.2%
Cash-on-Cash Return
5.6%
Cap rate
0.7%
Rent to Value Ratio
Active
$369,900
4
bds
|
3
ba
|
1,729
sqft
|
built
2005
110 Clay St, Wilmington, NC 28405
$-25
Cash flow
-0.4%
Cash-on-Cash Return
5.6%
Cap rate
0.7%
Rent to Value Ratio
156 out of 627 properties for sale in Wilmington, NC
Limited Results Shown
Create a free account, or log in to reveal all property listings and enjoy the complete experience.
Active
$780,000
2
bds
|
3
ba
|
1,226
sqft
|
built
2020
240 N Water St, Wilmington, NC 28401
$-2,226
Cash flow
-14.9%
Cash-on-Cash Return
2.3%
Cap rate
0.5%
Rent to Value Ratio

Active
$575,000
4
bds
|
3
ba
|
2,241
sqft
|
built
1991
3501 Kyle Ct, Wilmington, NC 28409
$-817
Cash flow
-7.4%
Cash-on-Cash Return
4.0%
Cap rate
0.5%
Rent to Value Ratio

Active
$600,000
1
bds
|
2
ba
|
1,027
sqft
|
built
2019
240 N Water St, Wilmington, NC 28401
$-1,703
Cash flow
-14.8%
Cash-on-Cash Return
2.3%
Cap rate
0.5%
Rent to Value Ratio
Active
$249,000
3
bds
|
1
ba
|
1,016
sqft
|
built
1971
1602 Forbes Ct, Wilmington, NC 28405
$-212
Cash flow
-4.4%
Cash-on-Cash Return
4.7%
Cap rate
0.6%
Rent to Value Ratio
Active
$325,000
3
bds
|
2
ba
|
1,292
sqft
|
built
2005
330 Virginia Ave, Wilmington, NC 28401
$-327
Cash flow
-5.2%
Cash-on-Cash Return
4.5%
Cap rate
0.6%
Rent to Value Ratio

Active
$479,000
3
bds
|
2
ba
|
2,010
sqft
|
built
1992
508 Commons Way, Wilmington, NC 28409
$-686
Cash flow
-7.5%
Cash-on-Cash Return
4.0%
Cap rate
0.5%
Rent to Value Ratio
Active
$389,900
4
bds
|
3
ba
|
2,053
sqft
|
built
2016
6520 Rustling Leaves Way, Wilmington, NC 28409
$-164
Cash flow
-2.2%
Cash-on-Cash Return
5.2%
Cap rate
0.6%
Rent to Value Ratio
Active
$1,049,000
6
bds
|
4
ba
|
3,622
sqft
|
built
2017
837 Bedminister Ln, Wilmington, NC 28405
$-2,710
Cash flow
-13.5%
Cash-on-Cash Return
2.6%
Cap rate
0.4%
Rent to Value Ratio
Active
$489,000
4
bds
|
3
ba
|
2,427
sqft
|
built
2004
325 Windchime Dr, Wilmington, NC 28412
$-853
Cash flow
-9.1%
Cash-on-Cash Return
3.6%
Cap rate
0.5%
Rent to Value Ratio
Active
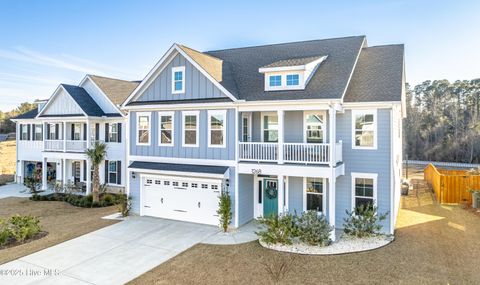
$795,000
5
bds
|
5
ba
|
3,718
sqft
|
built
2021
1268 Pandion Dr, Wilmington, NC 28411
$-1,092
Cash flow
-7.2%
Cash-on-Cash Return
4.0%
Cap rate
0.5%
Rent to Value Ratio

Active
$999,000
4
bds
|
4
ba
|
3,589
sqft
|
built
2003
1416 Marsh Cove Ln, Wilmington, NC 28409
$-519
Cash flow
-2.7%
Cash-on-Cash Return
5.1%
Cap rate
0.6%
Rent to Value Ratio
Active
$3,200,000
4
bds
|
5
ba
|
3,870
sqft
|
built
2002
5624 Captains Ln, Wilmington, NC 28409
$-12,546
Cash flow
-20.5%
Cash-on-Cash Return
1.0%
Cap rate
0.2%
Rent to Value Ratio

Active
$260,000
3
bds
|
1
ba
|
1,299
sqft
|
built
1907
111 Meares St, Wilmington, NC 28401
$-237
Cash flow
-4.8%
Cash-on-Cash Return
4.6%
Cap rate
0.6%
Rent to Value Ratio
Active
$384,900
2
bds
|
2
ba
|
1,341
sqft
|
built
2000
1035 Summerlin Falls Ct, Wilmington, NC 28412
$-848
Cash flow
-11.5%
Cash-on-Cash Return
3.0%
Cap rate
0.6%
Rent to Value Ratio
Active
$955,000
4
bds
|
5
ba
|
4,282
sqft
|
built
2010
1323 Summer Hideaway Rd, Wilmington, NC 28409
$-1,271
Cash flow
-6.9%
Cash-on-Cash Return
4.1%
Cap rate
0.5%
Rent to Value Ratio
Active
$375,000
3
bds
|
2
ba
|
1,162
sqft
|
built
1930
409 S 17th St, Wilmington, NC 28401
$-671
Cash flow
-9.3%
Cash-on-Cash Return
3.5%
Cap rate
0.4%
Rent to Value Ratio
Active
$575,000
4
bds
|
3
ba
|
2,134
sqft
|
built
1996
1016 Rivage Promenade, Wilmington, NC 28412
$-905
Cash flow
-8.2%
Cash-on-Cash Return
3.8%
Cap rate
0.5%
Rent to Value Ratio
Active
$1,695,000
4
bds
|
4
ba
|
3,799
sqft
|
built
2016
5013 Dockside Dr, Wilmington, NC 28409
$-6,180
Cash flow
-19.0%
Cash-on-Cash Return
1.3%
Cap rate
0.2%
Rent to Value Ratio

Active
$375,000
3
bds
|
1
ba
|
1,152
sqft
|
built
1942
2054 Burnett Blvd, Wilmington, NC 28401
$-502
Cash flow
-7.0%
Cash-on-Cash Return
4.1%
Cap rate
0.5%
Rent to Value Ratio
Active
$385,000
2
bds
|
2
ba
|
1,430
sqft
|
built
1989
6211 Wrightsville Ave, Wilmington, NC 28403
$-931
Cash flow
-12.6%
Cash-on-Cash Return
2.8%
Cap rate
0.5%
Rent to Value Ratio
Active
$750,000
3
bds
|
3
ba
|
2,500
sqft
|
built
2004
8304 Lakeview Dr, Wilmington, NC 28412
$-1,484
Cash flow
-10.3%
Cash-on-Cash Return
3.3%
Cap rate
0.4%
Rent to Value Ratio
Active
$505,000
2
bds
|
2
ba
|
1,596
sqft
|
built
2022
780 Craddock Dr, Wilmington, NC 28412
$-857
Cash flow
-8.9%
Cash-on-Cash Return
3.6%
Cap rate
0.6%
Rent to Value Ratio
Active
$1,800,000
4
bds
|
5
ba
|
5,050
sqft
|
built
2007
6424 River Vista Dr, Wilmington, NC 28412
$-4,561
Cash flow
-13.2%
Cash-on-Cash Return
2.6%
Cap rate
0.4%
Rent to Value Ratio
Active
$615,000
4
bds
|
4
ba
|
2,776
sqft
|
built
2018
105 Helmsman Dr, Wilmington, NC 28412
$-975
Cash flow
-8.3%
Cash-on-Cash Return
3.8%
Cap rate
0.5%
Rent to Value Ratio

Active
$354,900
3
bds
|
3
ba
|
1,968
sqft
|
built
1987
2801 Hobart Dr, Wilmington, NC 28405
$-178
Cash flow
-2.6%
Cash-on-Cash Return
5.1%
Cap rate
0.7%
Rent to Value Ratio

Active
$950,000
5
bds
|
5
ba
|
3,880
sqft
|
built
1984
2118 Gloucester Pl, Wilmington, NC 28403
$-2,681
Cash flow
-14.7%
Cash-on-Cash Return
2.3%
Cap rate
0.3%
Rent to Value Ratio
Active
$435,000
4
bds
|
3
ba
|
1,813
sqft
|
built
1986
710 Cheryl Ln, Wilmington, NC 28405
$-377
Cash flow
-4.5%
Cash-on-Cash Return
4.6%
Cap rate
0.6%
Rent to Value Ratio

Active
$3,467,500
5
bds
|
4
ba
|
5,750
sqft
|
built
1999
1047 Ocean Ridge Dr, Wilmington, NC 28405
$-15,006
Cash flow
-22.6%
Cash-on-Cash Return
0.5%
Cap rate
0.1%
Rent to Value Ratio

Active
$1,650,000
4
bds
|
5
ba
|
4,093
sqft
|
built
2005
1921 Sandwedge Pl, Wilmington, NC 28405
$-5,395
Cash flow
-17.1%
Cash-on-Cash Return
1.8%
Cap rate
0.2%
Rent to Value Ratio

Active
$425,000
3
bds
|
2
ba
|
1,934
sqft
|
built
1981
517 Kelly Rd, Wilmington, NC 28409
$-490
Cash flow
-6.0%
Cash-on-Cash Return
4.3%
Cap rate
0.6%
Rent to Value Ratio
Active
$324,900
3
bds
|
2
ba
|
1,048
sqft
|
built
2000
118 S 13th St, Wilmington, NC 28401
$-434
Cash flow
-7.0%
Cash-on-Cash Return
4.1%
Cap rate
0.5%
Rent to Value Ratio

Active
$650,000
4
bds
|
3
ba
|
2,471
sqft
|
built
2013
6618 Motts Village Rd, Wilmington, NC 28412
$-1,569
Cash flow
-12.6%
Cash-on-Cash Return
2.8%
Cap rate
0.4%
Rent to Value Ratio

Active
$959,500
4
bds
|
4
ba
|
2,629
sqft
|
built
2016
5418 Saltwater Run, Wilmington, NC 28409
$-3,020
Cash flow
-16.4%
Cash-on-Cash Return
1.9%
Cap rate
0.3%
Rent to Value Ratio

Active
$485,000
3
bds
|
4
ba
|
1,929
sqft
|
built
2018
4006 Tamarisk Ln, Wilmington, NC 28409
$-1,098
Cash flow
-11.8%
Cash-on-Cash Return
3.0%
Cap rate
0.5%
Rent to Value Ratio
Active
$469,000
3
bds
|
2
ba
|
1,619
sqft
|
built
2005
4113 Rounding Bend Ln, Wilmington, NC 28412
$-594
Cash flow
-6.6%
Cash-on-Cash Return
4.2%
Cap rate
0.5%
Rent to Value Ratio

Active
$849,000
4
bds
|
4
ba
|
3,857
sqft
|
built
2005
4204 Purviance Ct, Wilmington, NC 28409
$-1,634
Cash flow
-10.0%
Cash-on-Cash Return
3.4%
Cap rate
0.4%
Rent to Value Ratio
Active
$2,395,000
4
bds
|
5
ba
|
4,625
sqft
|
built
2004
2220 Bel Arbor Pl, Wilmington, NC 28403
$-9,453
Cash flow
-20.6%
Cash-on-Cash Return
0.9%
Cap rate
0.2%
Rent to Value Ratio

Active
$331,900
3
bds
|
2
ba
|
1,352
sqft
|
built
1995
606 Manassas Dr, Wilmington, NC 28409
$-278
Cash flow
-4.4%
Cash-on-Cash Return
4.7%
Cap rate
0.6%
Rent to Value Ratio