Lexington, MA Investment Properties for Sale
Browse homes for sale and investment properties in Lexington, MA. Refine your search by price, property type, or more.
Best cash flowing properties in Lexington, MA

Active
$995,000
3
bds
|
3
ba
|
1,600
sqft
|
built
1940
11 N Hancock St, Lexington, MA 02420
$-2,067
Cash flow
-10.8%
Cash-on-Cash Return
3.2%
Cap rate
0.5%
Rent to Value Ratio

Active
$949,000
4
bds
|
2
ba
|
1,896
sqft
|
built
1930
475 Waltham St, Lexington, MA 02421
$-2,404
Cash flow
-13.2%
Cash-on-Cash Return
2.6%
Cap rate
0.5%
Rent to Value Ratio
69 out of 79 properties for sale in Lexington, MA
Limited Results Shown
Create a free account, or log in to reveal all property listings and enjoy the complete experience.

Pending
$2,050,000
4
bds
|
4
ba
|
3,958
sqft
|
built
1960
103 Outlook Dr, Lexington, MA 02421
$-6,343
Cash flow
-16.1%
Cash-on-Cash Return
2.0%
Cap rate
0.4%
Rent to Value Ratio
Active
$980,000
3
bds
|
2
ba
|
1,428
sqft
|
built
1951
23 Ivan St, Lexington, MA 02420
$-2,453
Cash flow
-13.1%
Cash-on-Cash Return
2.7%
Cap rate
0.4%
Rent to Value Ratio

Active
$2,250,000
4
bds
|
2
ba
|
2,400
sqft
|
built
1953
5 Mason St, Lexington, MA 02421
$-8,004
Cash flow
-18.6%
Cash-on-Cash Return
1.4%
Cap rate
0.3%
Rent to Value Ratio

Active
$2,850,000
5
bds
|
5
ba
|
4,668
sqft
|
built
1928
8 Berwick Rd, Lexington, MA 02420
$-10,332
Cash flow
-18.9%
Cash-on-Cash Return
1.3%
Cap rate
0.3%
Rent to Value Ratio
Active
$2,660,000
7
bds
|
6
ba
|
4,839
sqft
|
built
1901
10 Eliot Rd, Lexington, MA 02421
$-9,120
Cash flow
-17.9%
Cash-on-Cash Return
1.6%
Cap rate
0.3%
Rent to Value Ratio

Active
$2,599,000
5
bds
|
4
ba
|
4,665
sqft
|
built
2005
22 Flintlock Rd, Lexington, MA 02420
$-8,662
Cash flow
-17.4%
Cash-on-Cash Return
1.7%
Cap rate
0.3%
Rent to Value Ratio

Active under contract
$1,235,000
3
bds
|
3
ba
|
2,212
sqft
|
built
1961
75 Allen St, Lexington, MA 02421
$-3,161
Cash flow
-13.4%
Cash-on-Cash Return
2.6%
Cap rate
0.5%
Rent to Value Ratio

Active under contract
$2,750,000
5
bds
|
7
ba
|
5,826
sqft
|
built
2003
3 Aaron Rd, Lexington, MA 02421
$-9,834
Cash flow
-18.7%
Cash-on-Cash Return
1.4%
Cap rate
0.3%
Rent to Value Ratio

Active
$3,650,000
7
bds
|
6
ba
|
8,577
sqft
|
built
1885
14 Percy Rd, Lexington, MA 02421
$-13,516
Cash flow
-19.3%
Cash-on-Cash Return
1.2%
Cap rate
0.3%
Rent to Value Ratio

Active under contract
$3,275,000
6
bds
|
6
ba
|
5,730
sqft
|
built
2018
1 Apollo Cir, Lexington, MA 02421
$-12,739
Cash flow
-20.3%
Cash-on-Cash Return
1.0%
Cap rate
0.2%
Rent to Value Ratio

Active
$3,150,000
3
bds
|
4
ba
|
3,443
sqft
|
built
1979
8 Brent Rd, Lexington, MA 02420
$-9,939
Cash flow
-16.5%
Cash-on-Cash Return
1.9%
Cap rate
0.2%
Rent to Value Ratio

Active under contract
$1,589,000
4
bds
|
3
ba
|
2,991
sqft
|
built
1941
2685 Massachusetts Ave, Lexington, MA 02421
$-4,906
Cash flow
-16.1%
Cash-on-Cash Return
2.0%
Cap rate
0.4%
Rent to Value Ratio
Active
$1,298,000
4
bds
|
3
ba
|
2,170
sqft
|
built
1928
7 Theresa Ave, Lexington, MA 02420
$-3,789
Cash flow
-15.2%
Cash-on-Cash Return
2.2%
Cap rate
0.4%
Rent to Value Ratio

Active
$1,650,000
4
bds
|
4
ba
|
2,665
sqft
|
built
1969
35 Circle Rd, Lexington, MA 02420
$-4,977
Cash flow
-15.7%
Cash-on-Cash Return
2.1%
Cap rate
0.4%
Rent to Value Ratio

Active under contract
$1,418,000
4
bds
|
3
ba
|
2,453
sqft
|
built
1935
22 Grant St, Lexington, MA 02420
$-3,809
Cash flow
-14.0%
Cash-on-Cash Return
2.5%
Cap rate
0.4%
Rent to Value Ratio
Active
$949,000
4
bds
|
2
ba
|
1,896
sqft
|
built
1930
475 Waltham St, Lexington, MA 02421
$-2,404
Cash flow
-13.2%
Cash-on-Cash Return
2.6%
Cap rate
0.5%
Rent to Value Ratio

Active
$2,779,000
5
bds
|
5
ba
|
4,970
sqft
|
built
2025
70 Valleyfield St, Lexington, MA 02421
$-18,724
Cash flow
-35.2%
Cash-on-Cash Return
-2.4%
Cap rate
0.1%
Rent to Value Ratio

Active under contract
$1,349,000
4
bds
|
2
ba
|
2,060
sqft
|
built
1940
20 Taft Ave, Lexington, MA 02421
$-4,067
Cash flow
-15.7%
Cash-on-Cash Return
2.1%
Cap rate
0.4%
Rent to Value Ratio

Active
$1,320,000
3
bds
|
2
ba
|
2,508
sqft
|
built
1955
38 Maple St, Lexington, MA 02420
$-3,827
Cash flow
-15.1%
Cash-on-Cash Return
2.2%
Cap rate
0.4%
Rent to Value Ratio

Active
$2,390,000
6
bds
|
4
ba
|
4,973
sqft
|
built
2004
134 Burlington St, Lexington, MA 02420
$-7,669
Cash flow
-16.7%
Cash-on-Cash Return
1.8%
Cap rate
0.3%
Rent to Value Ratio

Active
$1,249,000
3
bds
|
2
ba
|
2,211
sqft
|
built
1950
43 Fair Oaks Dr, Lexington, MA 02421
$-3,376
Cash flow
-14.1%
Cash-on-Cash Return
2.4%
Cap rate
0.4%
Rent to Value Ratio

Active under contract
$2,349,000
6
bds
|
6
ba
|
4,426
sqft
|
built
2021
429 Lowell St, Lexington, MA 02420
$-5,828
Cash flow
-12.9%
Cash-on-Cash Return
2.7%
Cap rate
0.5%
Rent to Value Ratio

Active
$3,595,000
6
bds
|
7
ba
|
6,086
sqft
|
built
2016
12 Cooke Rd, Lexington, MA 02420
$-13,715
Cash flow
-19.9%
Cash-on-Cash Return
1.1%
Cap rate
0.2%
Rent to Value Ratio

Pending
$1,999,000
4
bds
|
3
ba
|
3,333
sqft
|
built
1986
55 Solomon Pierce Rd, Lexington, MA 02420
$-6,562
Cash flow
-17.1%
Cash-on-Cash Return
1.7%
Cap rate
0.4%
Rent to Value Ratio

Active
$5,280,000
7
bds
|
10
ba
|
9,341
sqft
|
built
2025
10 Fairlawn Ln, Lexington, MA 02420
$-28,421
Cash flow
-28.1%
Cash-on-Cash Return
-0.8%
Cap rate
0.1%
Rent to Value Ratio

Active
$2,049,900
5
bds
|
5
ba
|
3,880
sqft
|
built
1969
128 Worthen Rd, Lexington, MA 02421
$-6,146
Cash flow
-15.6%
Cash-on-Cash Return
2.1%
Cap rate
0.4%
Rent to Value Ratio

Active under contract
$2,899,000
6
bds
|
5
ba
|
5,781
sqft
|
built
2006
127 Shade St, Lexington, MA 02421
$-10,664
Cash flow
-19.2%
Cash-on-Cash Return
1.3%
Cap rate
0.3%
Rent to Value Ratio

Active
$2,149,000
4
bds
|
3
ba
|
3,712
sqft
|
built
1953
10 Ballard Ter, Lexington, MA 02420
$-5,804
Cash flow
-14.1%
Cash-on-Cash Return
2.4%
Cap rate
0.4%
Rent to Value Ratio

Active
$3,338,000
6
bds
|
7
ba
|
5,074
sqft
|
built
2025
17 Prospect Hill Rd, Lexington, MA 02421
$-28,670
Cash flow
-44.8%
Cash-on-Cash Return
-4.6%
Cap rate
0.2%
Rent to Value Ratio

Active
$3,880,000
6
bds
|
7
ba
|
7,228
sqft
|
built
2025
18 Heritage Dr, Lexington, MA 02420
$-22,899
Cash flow
-30.8%
Cash-on-Cash Return
-1.4%
Cap rate
0.1%
Rent to Value Ratio
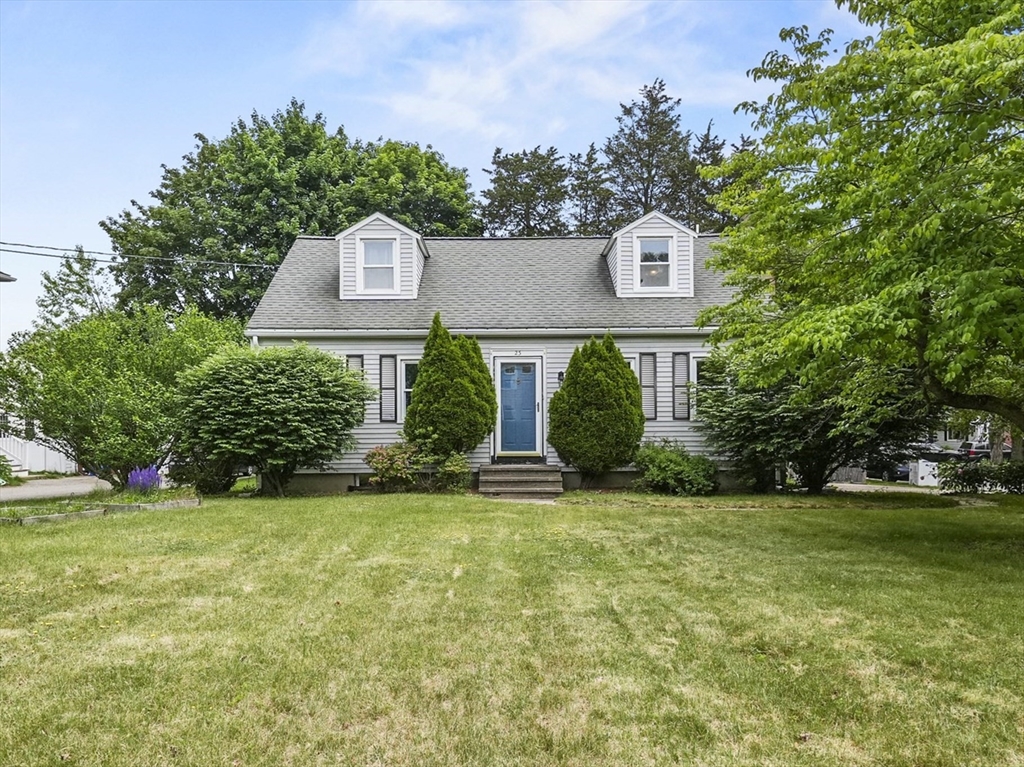
Active
$995,000
3
bds
|
3
ba
|
1,600
sqft
|
built
1940
11 N Hancock St, Lexington, MA 02420
$-2,067
Cash flow
-10.8%
Cash-on-Cash Return
3.2%
Cap rate
0.5%
Rent to Value Ratio

Active
$1,870,000
6
bds
|
4
ba
|
3,754
sqft
|
built
1974
6 Garfield St, Lexington, MA 02421
$-5,482
Cash flow
-15.3%
Cash-on-Cash Return
2.2%
Cap rate
0.4%
Rent to Value Ratio

Active under contract
$1,199,000
4
bds
|
2
ba
|
2,622
sqft
|
built
1952
61 Harding Rd, Lexington, MA 02420
$-3,297
Cash flow
-14.3%
Cash-on-Cash Return
2.4%
Cap rate
0.4%
Rent to Value Ratio

Pending
$3,395,000
6
bds
|
6
ba
|
6,237
sqft
|
built
2022
92 Cedar St, Lexington, MA 02421
$-11,573
Cash flow
-17.8%
Cash-on-Cash Return
1.6%
Cap rate
0.3%
Rent to Value Ratio

Active
$2,600,000
5
bds
|
4
ba
|
4,501
sqft
|
built
2004
93 Adams St, Lexington, MA 02420
$-8,436
Cash flow
-16.9%
Cash-on-Cash Return
1.8%
Cap rate
0.3%
Rent to Value Ratio

Active
$2,748,000
5
bds
|
4
ba
|
5,198
sqft
|
built
2006
5 Walnut St, Lexington, MA 02421
$-9,412
Cash flow
-17.9%
Cash-on-Cash Return
1.6%
Cap rate
0.3%
Rent to Value Ratio

Active
$3,495,000
5
bds
|
8
ba
|
5,762
sqft
|
built
2019
91 Shade St, Lexington, MA 02421
$-12,859
Cash flow
-19.2%
Cash-on-Cash Return
1.3%
Cap rate
0.3%
Rent to Value Ratio

Active
$3,798,000
6
bds
|
7
ba
|
6,626
sqft
|
built
2025
37 Philip Rd, Lexington, MA 02421
$-14,937
Cash flow
-20.5%
Cash-on-Cash Return
1.0%
Cap rate
0.1%
Rent to Value Ratio

Pending
$999,000
2
bds
|
2
ba
|
1,268
sqft
|
built
1953
4 Homestead St, Lexington, MA 02421
$-3,074
Cash flow
-16.1%
Cash-on-Cash Return
2.0%
Cap rate
0.4%
Rent to Value Ratio
Active
$4,500,000
5
bds
|
8
ba
|
8,868
sqft
|
built
2025
197 Woburn St, Lexington, MA 02420
$-18,879
Cash flow
-21.9%
Cash-on-Cash Return
0.6%
Cap rate
0.1%
Rent to Value Ratio