Lexington, MA Investment Properties for Sale
Browse homes for sale and investment properties in Lexington, MA. Refine your search by price, property type, or more.
Best cash flowing properties in Lexington, MA
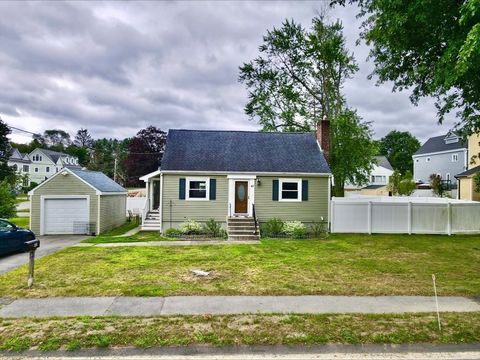
Active
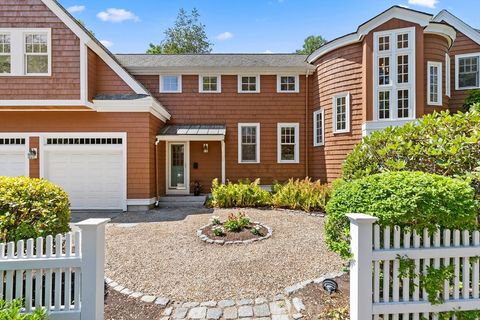
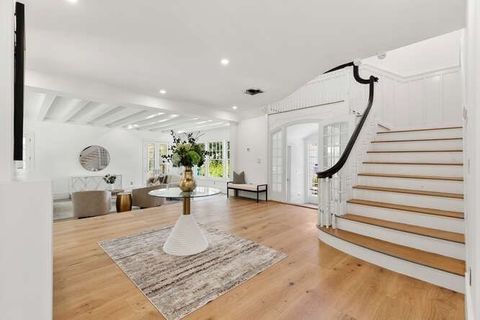
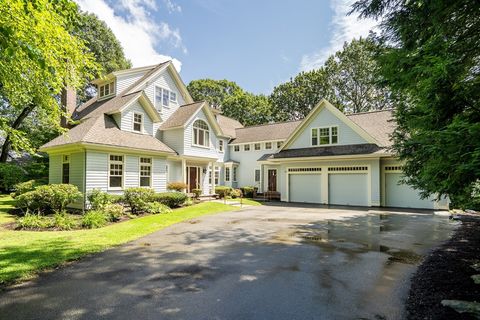
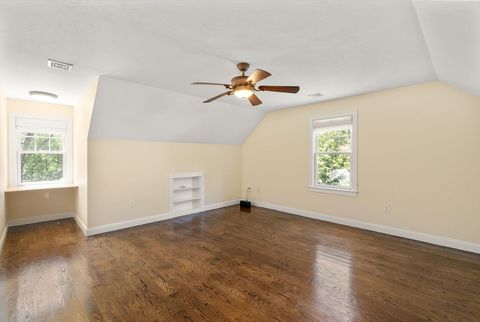
$1,100,000
3
bds
|
2
ba
|
1,844
sqft
|
built
1953
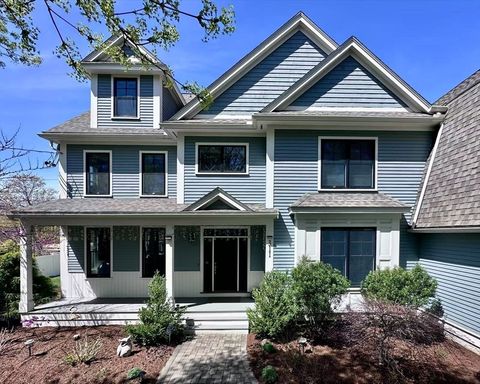
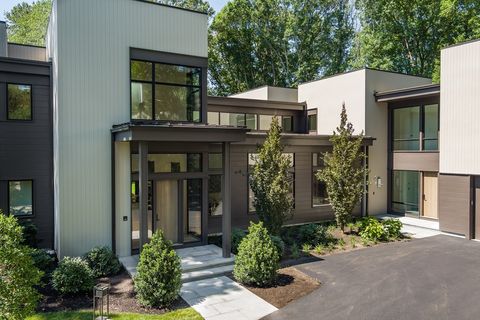
41 Eldred St, Lexington, MA 02420
$-2,932
Cash flow
-13.9%
Cash-on-Cash Return
2.5%
Cap rate
0.4%
Rent to Value Ratio
Active
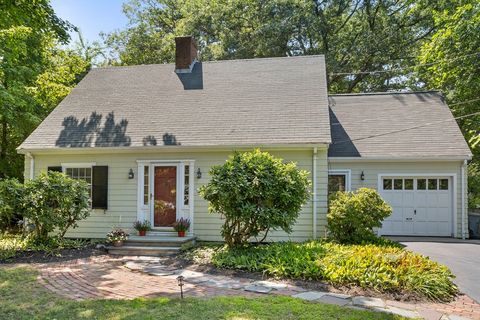
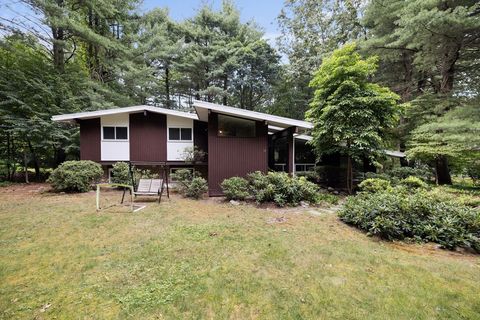
$1,299,000
6
bds
|
2
ba
|
2,168
sqft
|
built
1949
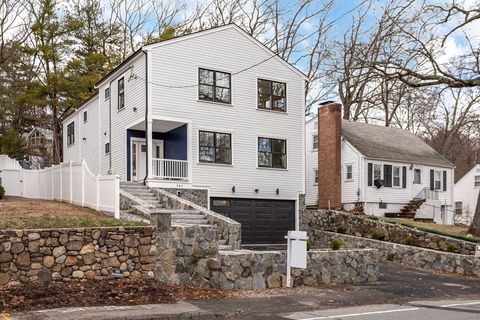
17 Boulder Rd, Lexington, MA 02420
$-3,379
Cash flow
-13.6%
Cash-on-Cash Return
2.6%
Cap rate
0.4%
Rent to Value Ratio
25 out of 33 properties for sale in Lexington, MA
Limited Results Shown
Create a free account, or log in to reveal all property listings and enjoy the complete experience.
Active
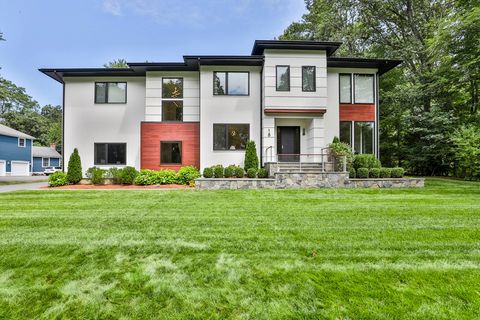
$3,000,000
4
bds
|
3
ba
|
2,148
sqft
|
built
1864
25 Maple St, Lexington, MA 02420
$-11,227
Cash flow
-19.5%
Cash-on-Cash Return
1.2%
Cap rate
0.2%
Rent to Value Ratio
Active
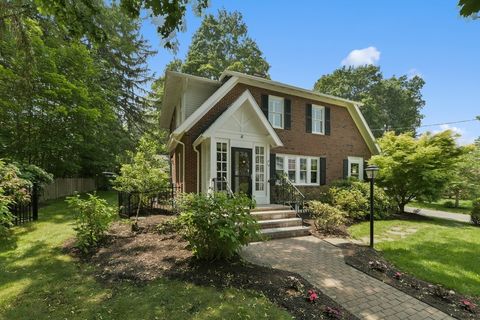
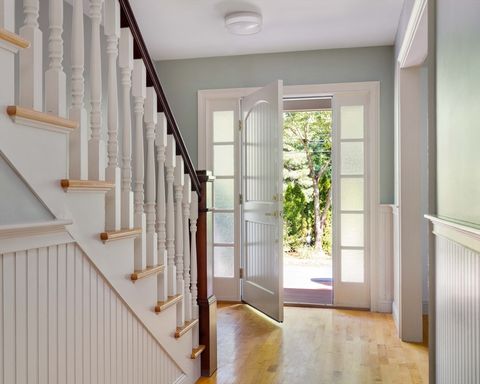
$1,695,000
4
bds
|
3
ba
|
3,033
sqft
|
built
1925
36 Independence Ave, Lexington, MA 02421
$-5,356
Cash flow
-16.5%
Cash-on-Cash Return
1.9%
Cap rate
0.4%
Rent to Value Ratio
Active
$2,385,000
6
bds
|
4
ba
|
4,500
sqft
|
built
1951
2380 Massachusetts Ave, Lexington, MA 02421
$-7,760
Cash flow
-17.0%
Cash-on-Cash Return
1.8%
Cap rate
0.3%
Rent to Value Ratio
Active
$3,600,000
6
bds
|
7
ba
|
7,049
sqft
|
built
1902
2 Effie Pl, Lexington, MA 02421
$-8,344,090
Cash flow
-12092.9%
Cash-on-Cash Return
-2775.7%
Cap rate
0.3%
Rent to Value Ratio
Active
$1,265,000
3
bds
|
2
ba
|
2,467
sqft
|
built
1941
38 Wachusett Dr, Lexington, MA 02421
$-3,804
Cash flow
-15.7%
Cash-on-Cash Return
2.1%
Cap rate
0.4%
Rent to Value Ratio
Active
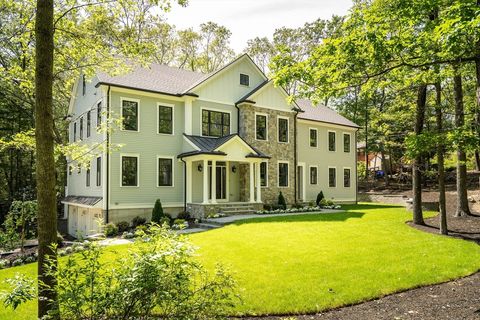
$4,200,000
6
bds
|
7
ba
|
7,705
sqft
|
built
2021
18 Blueberry Ln, Lexington, MA 02420
$-17,039
Cash flow
-21.2%
Cash-on-Cash Return
0.8%
Cap rate
0.2%
Rent to Value Ratio
Active
$2,749,900
5
bds
|
6
ba
|
6,270
sqft
|
built
2001
3A Nowers Rd, Lexington, MA 02420
$-7,805
Cash flow
-14.8%
Cash-on-Cash Return
2.3%
Cap rate
0.4%
Rent to Value Ratio
Active
$2,395,000
6
bds
|
6
ba
|
6,378
sqft
|
built
2009
245 East St, Lexington, MA 02420
$-7,675
Cash flow
-16.7%
Cash-on-Cash Return
1.8%
Cap rate
0.4%
Rent to Value Ratio
Active
$1,399,000
4
bds
|
3
ba
|
2,438
sqft
|
built
1962
10 Partridge Rd, Lexington, MA 02420
$-3,606
Cash flow
-13.4%
Cash-on-Cash Return
2.6%
Cap rate
0.5%
Rent to Value Ratio
Active
$1,885,000
4
bds
|
3
ba
|
2,792
sqft
|
built
1920
12 Coolidge Ave, Lexington, MA 02420
$-5,855
Cash flow
-16.2%
Cash-on-Cash Return
2.0%
Cap rate
0.4%
Rent to Value Ratio
Active
$2,779,000
5
bds
|
5
ba
|
4,970
sqft
|
built
2025
70 Valleyfield St, Lexington, MA 02421
$-18,724
Cash flow
-35.2%
Cash-on-Cash Return
-2.4%
Cap rate
0.1%
Rent to Value Ratio
Active
$2,775,000
6
bds
|
5
ba
|
5,781
sqft
|
built
2006
127 Shade St, Lexington, MA 02421
$-10,077
Cash flow
-18.9%
Cash-on-Cash Return
1.3%
Cap rate
0.3%
Rent to Value Ratio
Active
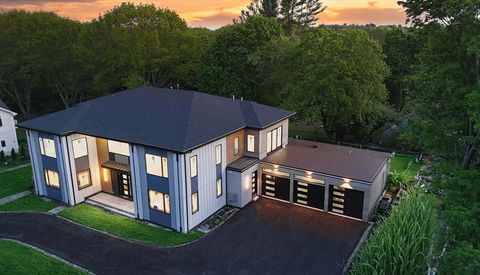
$3,880,000
6
bds
|
7
ba
|
7,228
sqft
|
built
2025
18 Heritage Dr, Lexington, MA 02420
$-22,899
Cash flow
-30.8%
Cash-on-Cash Return
-1.4%
Cap rate
0.1%
Rent to Value Ratio
Active
$2,398,000
5
bds
|
4
ba
|
4,501
sqft
|
built
2004
93 Adams St, Lexington, MA 02420
$-7,480
Cash flow
-16.3%
Cash-on-Cash Return
1.9%
Cap rate
0.4%
Rent to Value Ratio
Active
$4,500,000
5
bds
|
8
ba
|
8,868
sqft
|
built
2025
197 Woburn St, Lexington, MA 02420
$-18,879
Cash flow
-21.9%
Cash-on-Cash Return
0.6%
Cap rate
0.1%
Rent to Value Ratio
Active
$3,068,000
5
bds
|
6
ba
|
7,012
sqft
|
built
2018
311 Concord Ave, Lexington, MA 02421
$-11,949
Cash flow
-20.3%
Cash-on-Cash Return
1.0%
Cap rate
0.3%
Rent to Value Ratio
Active
$2,299,000
5
bds
|
5
ba
|
4,835
sqft
|
built
2025
111 Cedar St, Lexington, MA 02421
$-4,849
Cash flow
-11.0%
Cash-on-Cash Return
3.1%
Cap rate
0.5%
Rent to Value Ratio
Active
$2,250,000
4
bds
|
5
ba
|
4,300
sqft
|
built
2025
383 Marrett Rd, Lexington, MA 02421
$-16,221
Cash flow
-37.6%
Cash-on-Cash Return
-3.0%
Cap rate
0.2%
Rent to Value Ratio
Active
$2,695,000
5
bds
|
6
ba
|
4,250
sqft
|
built
2025
17 Hamilton Rd, Lexington, MA 02420
$-18,051
Cash flow
-34.9%
Cash-on-Cash Return
-2.4%
Cap rate
0.2%
Rent to Value Ratio
Active
$5,950,000
6
bds
|
10
ba
|
8,649
sqft
|
built
2024
23 Thoreau Rd, Lexington, MA 02420
$-25,047
Cash flow
-22.0%
Cash-on-Cash Return
0.6%
Cap rate
0.2%
Rent to Value Ratio
Active
$2,595,000
5
bds
|
6
ba
|
5,311
sqft
|
built
2025
12 Wilson Rd, Lexington, MA 02421
$-9,175
Cash flow
-18.4%
Cash-on-Cash Return
1.4%
Cap rate
0.2%
Rent to Value Ratio
Active
$4,295,000
6
bds
|
8
ba
|
6,196
sqft
|
built
2025
3 Brown Rd, Lexington, MA 02420
$-24,863
Cash flow
-30.2%
Cash-on-Cash Return
-1.3%
Cap rate
0.1%
Rent to Value Ratio
Active
$5,395,000
6
bds
|
10
ba
|
8,220
sqft
|
built
2009
23 Burroughs Rd, Lexington, MA 02420
$-22,382
Cash flow
-21.6%
Cash-on-Cash Return
0.7%
Cap rate
0.2%
Rent to Value Ratio