Lexington, MA Investment Properties for Sale
Browse homes for sale and investment properties in Lexington, MA. Refine your search by price, property type, or more.
Best cash flowing properties in Lexington, MA

Active
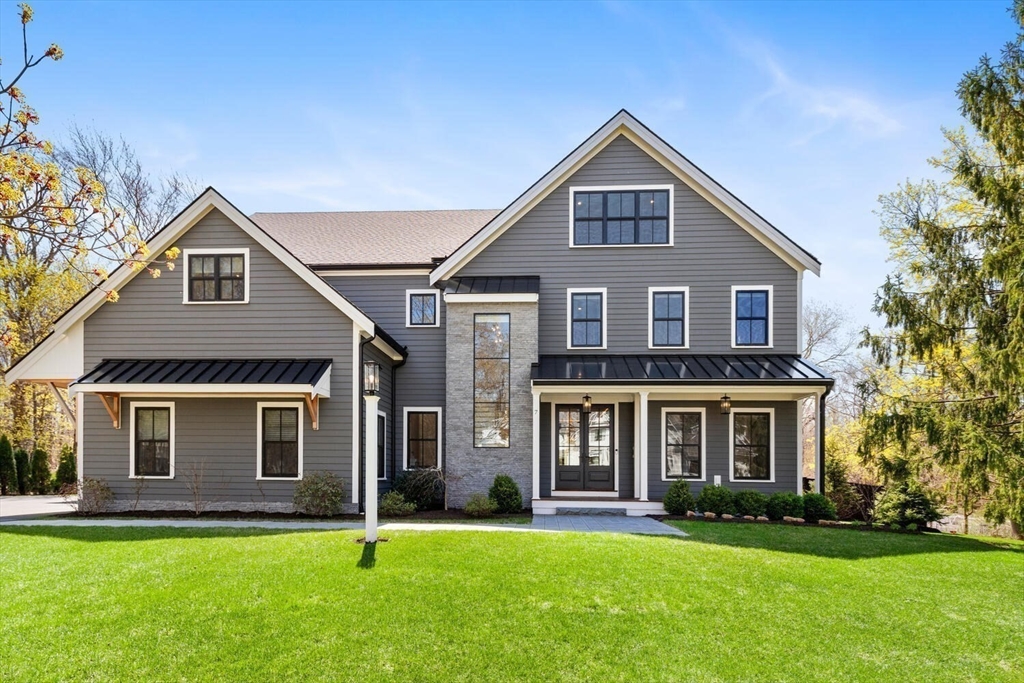
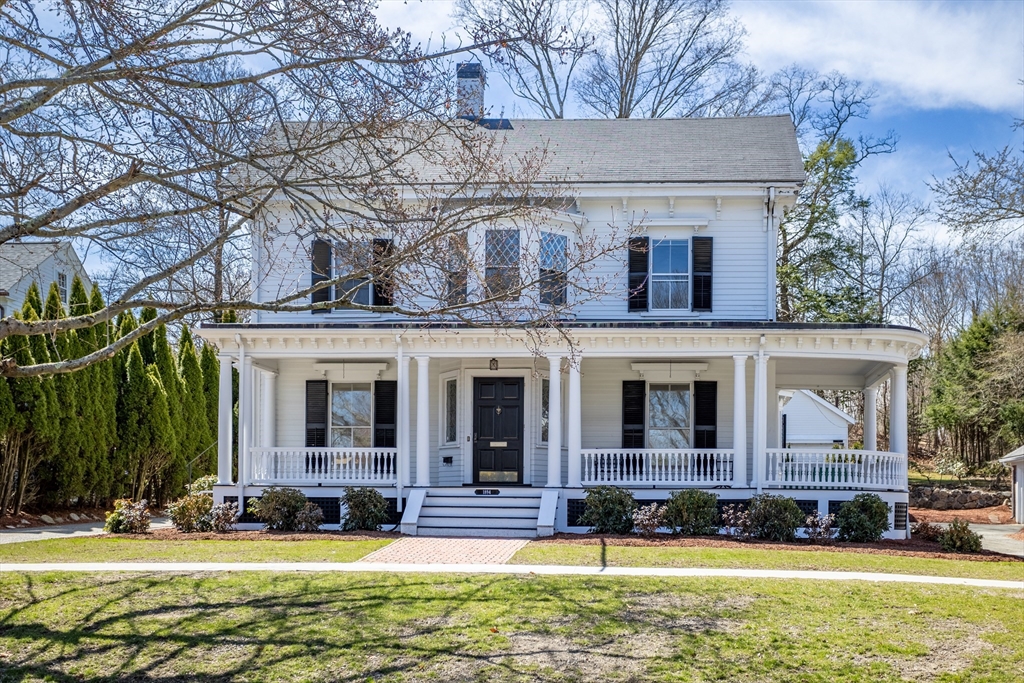
$815,000
3
bds
|
1
ba
|
1,333
sqft
|
built
1917
18 Spring St, Lexington, MA 02421
$-2,394
Cash flow
-15.3%
Cash-on-Cash Return
2.7%
Cap rate
0.5%
Rent to Value Ratio
Active
$1,574,000
3
bds
|
4
ba
|
2,348
sqft
|
built
1870
58 Hancock St, Lexington, MA 02420
$-4,345
Cash flow
-14.4%
Cash-on-Cash Return
3.0%
Cap rate
0.5%
Rent to Value Ratio
67 out of 75 properties for sale in Lexington, MA
Limited Results Shown
Create a free account, or log in to reveal all property listings and enjoy the complete experience.
Active
$3,600,000
5
bds
|
5
ba
|
5,482
sqft
|
built
2024
13 Woodland Rd, Lexington, MA 02420
$-17,445
Cash flow
-25.3%
Cash-on-Cash Return
0.4%
Cap rate
0.2%
Rent to Value Ratio
Active under contract
$1,450,000
4
bds
|
3
ba
|
2,180
sqft
|
built
1872
41 Clarke St, Lexington, MA 02421
$-4,708
Cash flow
-16.9%
Cash-on-Cash Return
2.4%
Cap rate
0.4%
Rent to Value Ratio
Active
$4,395,000
6
bds
|
7
ba
|
7,739
sqft
|
built
2024
15 Tyler Rd, Lexington, MA 02420
$-15,355
Cash flow
-18.2%
Cash-on-Cash Return
2.1%
Cap rate
0.3%
Rent to Value Ratio
Active
$4,199,999
7
bds
|
9
ba
|
6,662
sqft
|
built
2021
7 Fulton Rd, Lexington, MA 02420
$-19,906
Cash flow
-24.7%
Cash-on-Cash Return
0.6%
Cap rate
0.2%
Rent to Value Ratio
Active
$3,950,000
5
bds
|
7
ba
|
7,831
sqft
|
built
2019
1 Penny Ln, Lexington, MA 02421
$-18,329
Cash flow
-24.2%
Cash-on-Cash Return
0.7%
Cap rate
0.2%
Rent to Value Ratio
Active
$2,199,000
5
bds
|
4
ba
|
4,460
sqft
|
built
1986
5 Joseph Comee Rd, Lexington, MA 02420
$-8,223
Cash flow
-19.5%
Cash-on-Cash Return
1.8%
Cap rate
0.4%
Rent to Value Ratio
Active
$4,449,000
6
bds
|
8
ba
|
7,653
sqft
|
built
2025
8 Blueberry Ln, Lexington, MA 02420
$-20,191
Cash flow
-23.7%
Cash-on-Cash Return
0.8%
Cap rate
0.1%
Rent to Value Ratio

Active
$3,368,000
5
bds
|
6
ba
|
7,012
sqft
|
built
2018
311 Concord Ave, Lexington, MA 02421
$-15,013
Cash flow
-23.3%
Cash-on-Cash Return
0.9%
Cap rate
0.2%
Rent to Value Ratio
Active
$1,299,000
3
bds
|
2
ba
|
2,230
sqft
|
built
1952
101 Burlington St, Lexington, MA 02420
$-4,434
Cash flow
-17.8%
Cash-on-Cash Return
2.2%
Cap rate
0.4%
Rent to Value Ratio

Active
$2,299,000
5
bds
|
5
ba
|
4,835
sqft
|
built
2025
111 Cedar St, Lexington, MA 02421
$-5,971
Cash flow
-13.6%
Cash-on-Cash Return
3.1%
Cap rate
0.5%
Rent to Value Ratio
Active
$815,000
3
bds
|
1
ba
|
1,333
sqft
|
built
1917
18 Spring St, Lexington, MA 02421
$-2,394
Cash flow
-15.3%
Cash-on-Cash Return
2.7%
Cap rate
0.5%
Rent to Value Ratio
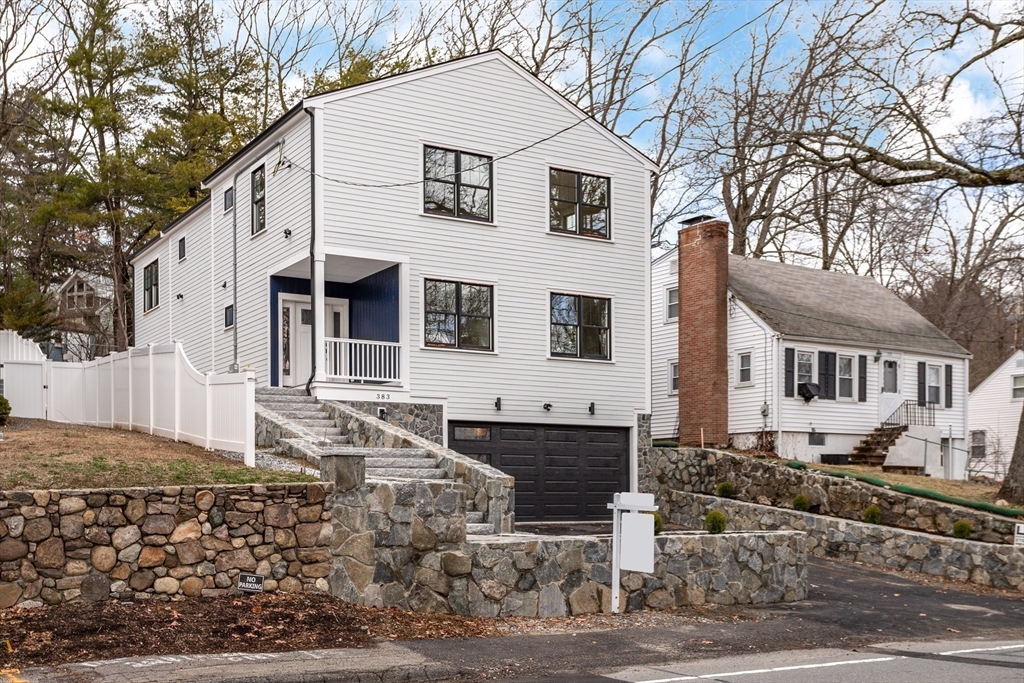
Active
$2,250,000
4
bds
|
5
ba
|
4,300
sqft
|
built
2025
383 Marrett Rd, Lexington, MA 02421
$-17,320
Cash flow
-40.2%
Cash-on-Cash Return
-3.0%
Cap rate
0.2%
Rent to Value Ratio
Active
$4,250,000
6
bds
|
6
ba
|
6,905
sqft
|
built
2025
7 Whipple Rd, Lexington, MA 02420
$-19,706
Cash flow
-24.2%
Cash-on-Cash Return
0.7%
Cap rate
0.1%
Rent to Value Ratio

Active
$2,795,000
5
bds
|
6
ba
|
4,250
sqft
|
built
2025
17 Hamilton Rd, Lexington, MA 02420
$-19,889
Cash flow
-37.1%
Cash-on-Cash Return
-2.3%
Cap rate
0.2%
Rent to Value Ratio
Active
$3,250,000
4
bds
|
4
ba
|
3,649
sqft
|
built
1950
6 Moon Hill Rd, Lexington, MA 02421
$-12,279
Cash flow
-19.7%
Cash-on-Cash Return
1.7%
Cap rate
0.3%
Rent to Value Ratio
Active
$1,574,000
3
bds
|
4
ba
|
2,348
sqft
|
built
1870
58 Hancock St, Lexington, MA 02420
$-4,345
Cash flow
-14.4%
Cash-on-Cash Return
3.0%
Cap rate
0.5%
Rent to Value Ratio

Active
$6,100,000
6
bds
|
10
ba
|
8,649
sqft
|
built
2024
23 Thoreau Rd, Lexington, MA 02420
$-28,736
Cash flow
-24.6%
Cash-on-Cash Return
0.6%
Cap rate
0.2%
Rent to Value Ratio
Active
$2,795,000
5
bds
|
6
ba
|
5,311
sqft
|
built
2025
12 Wilson Rd, Lexington, MA 02421
$-11,487
Cash flow
-21.4%
Cash-on-Cash Return
1.3%
Cap rate
0.2%
Rent to Value Ratio

Active
$1,999,900
5
bds
|
4
ba
|
3,012
sqft
|
built
2023
10 Bowker St, Lexington, MA 02421
$-5,288
Cash flow
-13.8%
Cash-on-Cash Return
3.1%
Cap rate
0.5%
Rent to Value Ratio
Active
$4,395,000
6
bds
|
8
ba
|
6,196
sqft
|
built
2025
3 Brown Rd, Lexington, MA 02420
$-27,483
Cash flow
-32.6%
Cash-on-Cash Return
-1.2%
Cap rate
0.1%
Rent to Value Ratio
Active
$5,395,000
6
bds
|
10
ba
|
8,220
sqft
|
built
2009
23 Burroughs Rd, Lexington, MA 02420
$-25,017
Cash flow
-24.2%
Cash-on-Cash Return
0.7%
Cap rate
0.2%
Rent to Value Ratio
Active
$5,250,000
5
bds
|
8
ba
|
9,825
sqft
|
built
2003
197 Grant St, Lexington, MA 02420
$-23,332
Cash flow
-23.2%
Cash-on-Cash Return
0.9%
Cap rate
0.2%
Rent to Value Ratio

Active
$1,585,000
3
bds
|
2
ba
|
2,927
sqft
|
built
1800
1900 Massachusetts Ave, Lexington, MA 02421
$-6,610
Cash flow
-21.8%
Cash-on-Cash Return
1.3%
Cap rate
0.3%
Rent to Value Ratio
Active
$2,350,000
4
bds
|
2
ba
|
3,492
sqft
|
built
1800
1894 Massachusetts Ave, Lexington, MA 02421
$-7,401
Cash flow
-16.4%
Cash-on-Cash Return
2.5%
Cap rate
0.4%
Rent to Value Ratio
Active
$3,485,000
6
bds
|
6
ba
|
6,707
sqft
|
built
1985
7 Lothrop Cir, Lexington, MA 02420
$-13,576
Cash flow
-20.3%
Cash-on-Cash Return
1.6%
Cap rate
0.3%
Rent to Value Ratio
Active
$2,950,000
5
bds
|
7
ba
|
7,230
sqft
|
built
2005
34 Allen St, Lexington, MA 02421
$-13,058
Cash flow
-23.1%
Cash-on-Cash Return
1.0%
Cap rate
0.2%
Rent to Value Ratio
Active
$3,550,000
6
bds
|
7
ba
|
6,197
sqft
|
built
2023
7 Stage Coach Rd, Lexington, MA 02421
$-13,117
Cash flow
-19.3%
Cash-on-Cash Return
1.8%
Cap rate
0.3%
Rent to Value Ratio