Litchfield Park, AZ Investment Properties for Sale
Browse homes for sale and investment properties in Litchfield Park, AZ. Refine your search by price, property type, or more.
Best cash flowing properties in Litchfield Park, AZ

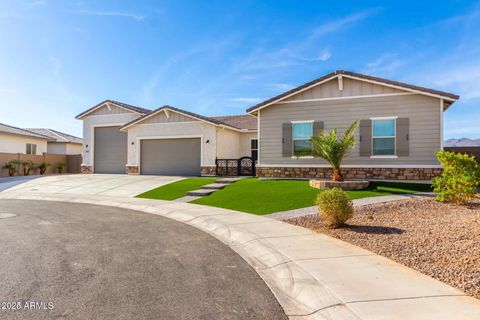
Active
$525,000
5
bds
|
5
ba
|
3,131
sqft
|
built
2022
19209 W Elm St, Litchfield Park, AZ 85340
$-368
Cash flow
-3.7%
Cash-on-Cash Return
4.8%
Cap rate
0.7%
Rent to Value Ratio

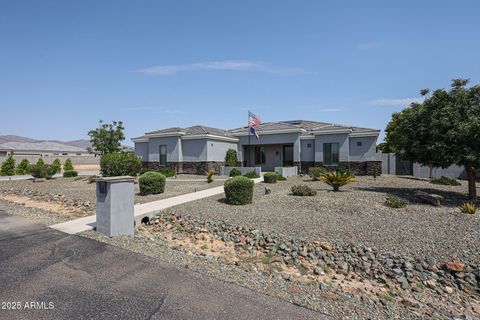
Active
$383,000
3
bds
|
2
ba
|
1,862
sqft
|
built
2002
5374 N Ormondo Way, Litchfield Park, AZ 85340
$-597
Cash flow
-8.1%
Cash-on-Cash Return
3.8%
Cap rate
0.5%
Rent to Value Ratio
175 out of 194 properties for sale in Litchfield Park, AZ
Limited Results Shown
Create a free account, or log in to reveal all property listings and enjoy the complete experience.
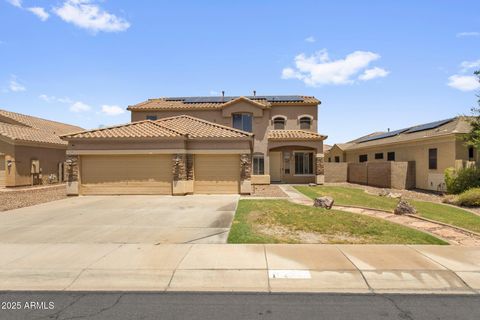
Active
$599,900
3
bds
|
2
ba
|
2,342
sqft
|
built
2012
18529 W Oregon Ave, Litchfield Park, AZ 85340
$-1,439
Cash flow
-12.5%
Cash-on-Cash Return
2.8%
Cap rate
0.4%
Rent to Value Ratio
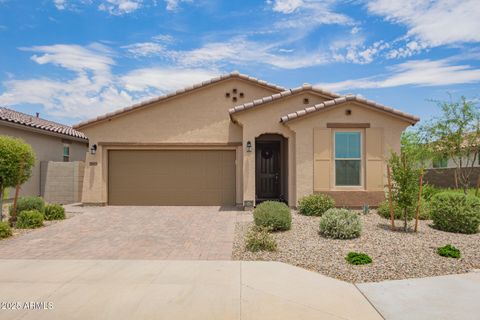
Active
$720,900
4
bds
|
3
ba
|
2,982
sqft
|
built
2021
19774 W Turney Ave, Litchfield Park, AZ 85340
$-1,414
Cash flow
-10.2%
Cash-on-Cash Return
3.3%
Cap rate
0.5%
Rent to Value Ratio

Active
$625,000
4
bds
|
3
ba
|
2,502
sqft
|
built
2017
18731 W Oregon Ave, Litchfield Park, AZ 85340
$-1,596
Cash flow
-13.3%
Cash-on-Cash Return
2.6%
Cap rate
0.4%
Rent to Value Ratio

Active
$550,000
4
bds
|
2
ba
|
2,488
sqft
|
built
2005
13259 W Mulberry Dr, Litchfield Park, AZ 85340
$-976
Cash flow
-9.3%
Cash-on-Cash Return
3.5%
Cap rate
0.5%
Rent to Value Ratio
Active
$479,900
4
bds
|
2
ba
|
1,965
sqft
|
built
2021
19642 W Roma Ave, Litchfield Park, AZ 85340
$-839
Cash flow
-9.1%
Cash-on-Cash Return
3.6%
Cap rate
0.5%
Rent to Value Ratio
Active
$595,000
3
bds
|
3
ba
|
2,227
sqft
|
built
2021
19024 W Solano Dr, Litchfield Park, AZ 85340
$-1,107
Cash flow
-9.7%
Cash-on-Cash Return
3.4%
Cap rate
0.5%
Rent to Value Ratio

Active
$1,175,000
6
bds
|
4
ba
|
4,553
sqft
|
built
2003
5312 N Sierra Hermosa Ct, Litchfield Park, AZ 85340
$-3,001
Cash flow
-13.3%
Cash-on-Cash Return
2.6%
Cap rate
0.4%
Rent to Value Ratio
Active
$1,750,000
3
bds
|
4
ba
|
3,346
sqft
|
built
1978
1141 N Oro Vis, Litchfield Park, AZ 85340
$-3,266
Cash flow
-9.7%
Cash-on-Cash Return
3.4%
Cap rate
0.4%
Rent to Value Ratio
Active
$599,500
4
bds
|
3
ba
|
2,982
sqft
|
built
2021
19736 W Turney Ave, Litchfield Park, AZ 85340
$-903
Cash flow
-7.9%
Cash-on-Cash Return
3.9%
Cap rate
0.6%
Rent to Value Ratio
Active
$555,000
3
bds
|
3
ba
|
2,140
sqft
|
built
2022
5652 N 188th Ln, Litchfield Park, AZ 85340
$-958
Cash flow
-9.0%
Cash-on-Cash Return
3.6%
Cap rate
0.5%
Rent to Value Ratio
Active
$499,500
3
bds
|
3
ba
|
2,231
sqft
|
built
2019
18936 W Oregon Ave, Litchfield Park, AZ 85340
$-878
Cash flow
-9.2%
Cash-on-Cash Return
3.6%
Cap rate
0.5%
Rent to Value Ratio
Active
$940,000
5
bds
|
5
ba
|
3,607
sqft
|
built
2022
5170 N 186th Dr, Litchfield Park, AZ 85340
$-1,873
Cash flow
-10.4%
Cash-on-Cash Return
3.3%
Cap rate
0.5%
Rent to Value Ratio
Active
$989,500
4
bds
|
3
ba
|
2,878
sqft
|
built
2018
18208 W Rancho Ct, Litchfield Park, AZ 85340
$-2,393
Cash flow
-12.6%
Cash-on-Cash Return
2.8%
Cap rate
0.4%
Rent to Value Ratio

Active
$599,900
3
bds
|
2
ba
|
2,372
sqft
|
built
1976
971 E Acacia Cir, Litchfield Park, AZ 85340
$-1,060
Cash flow
-9.2%
Cash-on-Cash Return
3.6%
Cap rate
0.5%
Rent to Value Ratio

Active
$821,000
3
bds
|
3
ba
|
2,531
sqft
|
built
2006
14659 W Hidden Terrace Loop, Litchfield Park, AZ 85340
$-2,378
Cash flow
-15.1%
Cash-on-Cash Return
2.2%
Cap rate
0.3%
Rent to Value Ratio

Active
$455,000
4
bds
|
3
ba
|
2,274
sqft
|
built
2020
5238 N 188th Ln, Litchfield Park, AZ 85340
$-836
Cash flow
-9.6%
Cash-on-Cash Return
3.5%
Cap rate
0.5%
Rent to Value Ratio
Active
$575,000
4
bds
|
3
ba
|
2,779
sqft
|
built
2003
12952 W Vista Paseo Dr, Litchfield Park, AZ 85340
$-1,256
Cash flow
-11.4%
Cash-on-Cash Return
3.1%
Cap rate
0.4%
Rent to Value Ratio
Active
$419,799
3
bds
|
2
ba
|
1,680
sqft
|
built
2023
19420 W Solano Dr, Litchfield Park, AZ 85340
$-736
Cash flow
-9.1%
Cash-on-Cash Return
3.6%
Cap rate
0.5%
Rent to Value Ratio

Active
$875,000
4
bds
|
2
ba
|
2,312
sqft
|
built
2016
19711 W Colter St, Litchfield Park, AZ 85340
$-2,319
Cash flow
-13.8%
Cash-on-Cash Return
2.5%
Cap rate
0.4%
Rent to Value Ratio

Active
$544,900
4
bds
|
3
ba
|
2,522
sqft
|
built
2018
18837 W San Juan Ave, Litchfield Park, AZ 85340
$-1,165
Cash flow
-11.2%
Cash-on-Cash Return
3.1%
Cap rate
0.5%
Rent to Value Ratio
Active
$699,900
5
bds
|
4
ba
|
3,474
sqft
|
built
2023
5516 N 193rd Ave, Litchfield Park, AZ 85340
$-1,446
Cash flow
-10.8%
Cash-on-Cash Return
3.2%
Cap rate
0.5%
Rent to Value Ratio

Active
$979,000
4
bds
|
4
ba
|
3,607
sqft
|
built
2023
5314 N 182nd Ln, Litchfield Park, AZ 85340
$-2,666
Cash flow
-14.2%
Cash-on-Cash Return
2.4%
Cap rate
0.3%
Rent to Value Ratio
Active
$474,000
4
bds
|
3
ba
|
2,522
sqft
|
built
2019
5519 N 187th Ln, Litchfield Park, AZ 85340
$-834
Cash flow
-9.2%
Cash-on-Cash Return
3.6%
Cap rate
0.5%
Rent to Value Ratio

Active
$1,600,000
4
bds
|
3
ba
|
2,211
sqft
|
built
1989
7425 N Alsup Rd, Litchfield Park, AZ 85340
$-5,028
Cash flow
-16.4%
Cash-on-Cash Return
1.9%
Cap rate
0.3%
Rent to Value Ratio

Active
$750,000
3
bds
|
4
ba
|
2,570
sqft
|
built
1981
1035 N Vista Verde, Litchfield Park, AZ 85340
$-1,690
Cash flow
-11.8%
Cash-on-Cash Return
3.0%
Cap rate
0.5%
Rent to Value Ratio

Active
$494,999
3
bds
|
2
ba
|
1,702
sqft
|
built
2004
13170 W Clarendon Ave, Litchfield Park, AZ 85340
$-1,218
Cash flow
-12.8%
Cash-on-Cash Return
2.7%
Cap rate
0.4%
Rent to Value Ratio

Active
$720,000
3
bds
|
2
ba
|
2,112
sqft
|
built
1961
19401 W Flower St, Litchfield Park, AZ 85340
$-1,410
Cash flow
-10.2%
Cash-on-Cash Return
3.3%
Cap rate
0.4%
Rent to Value Ratio

Active
$610,000
4
bds
|
3
ba
|
2,649
sqft
|
built
2023
19151 W Coolidge St, Litchfield Park, AZ 85340
$-1,100
Cash flow
-9.4%
Cash-on-Cash Return
3.5%
Cap rate
0.5%
Rent to Value Ratio
Active
$1,750,000
4
bds
|
4
ba
|
4,094
sqft
|
built
2008
18036 W San Miguel Ave, Litchfield Park, AZ 85340
$-5,742
Cash flow
-17.1%
Cash-on-Cash Return
1.7%
Cap rate
0.3%
Rent to Value Ratio
Active
$649,900
5
bds
|
4
ba
|
3,300
sqft
|
built
2018
18740 W San Juan Ave, Litchfield Park, AZ 85340
$-1,485
Cash flow
-11.9%
Cash-on-Cash Return
2.9%
Cap rate
0.4%
Rent to Value Ratio

Active
$735,000
4
bds
|
2
ba
|
2,264
sqft
|
built
1974
12866 W Orange Dr, Litchfield Park, AZ 85340
$-1,504
Cash flow
-10.7%
Cash-on-Cash Return
3.2%
Cap rate
0.4%
Rent to Value Ratio

Active
$1,299,950
5
bds
|
5
ba
|
3,607
sqft
|
built
2023
18139 W Oregon Ct, Litchfield Park, AZ 85340
$-4,008
Cash flow
-16.1%
Cash-on-Cash Return
2.0%
Cap rate
0.3%
Rent to Value Ratio

Active
$849,000
5
bds
|
4
ba
|
3,040
sqft
|
built
2001
19834 W Minnezona Ave, Litchfield Park, AZ 85340
$-1,710
Cash flow
-10.5%
Cash-on-Cash Return
3.3%
Cap rate
0.5%
Rent to Value Ratio

Active
$949,900
4
bds
|
4
ba
|
3,373
sqft
|
built
2020
5218 N Tiller Dr, Litchfield Park, AZ 85340
$-2,741
Cash flow
-15.1%
Cash-on-Cash Return
2.2%
Cap rate
0.3%
Rent to Value Ratio

Active
$797,000
3
bds
|
2
ba
|
2,242
sqft
|
built
1965
202 N Florence Ave, Litchfield Park, AZ 85340
$-1,721
Cash flow
-11.3%
Cash-on-Cash Return
3.1%
Cap rate
0.4%
Rent to Value Ratio
Active
$499,900
3
bds
|
3
ba
|
2,594
sqft
|
built
2009
19245 W Pasadena Ave, Litchfield Park, AZ 85340
$-823
Cash flow
-8.6%
Cash-on-Cash Return
3.7%
Cap rate
0.6%
Rent to Value Ratio

Active
$745,000
4
bds
|
3
ba
|
3,286
sqft
|
built
2010
19414 W Pasadena Ave, Litchfield Park, AZ 85340
$-1,527
Cash flow
-10.7%
Cash-on-Cash Return
3.2%
Cap rate
0.5%
Rent to Value Ratio
Active
$499,900
4
bds
|
3
ba
|
1,813
sqft
|
built
2021
19873 W San Juan Ave, Litchfield Park, AZ 85340
$-898
Cash flow
-9.4%
Cash-on-Cash Return
3.5%
Cap rate
0.5%
Rent to Value Ratio