Long Beach, MS Investment Properties for Sale
Browse homes for sale and investment properties in Long Beach, MS. Refine your search by price, property type, or more.
Best cash flowing properties in Long Beach, MS

Active
$120,000
1
bds
|
1
ba
|
0
sqft
|
built
1999
20294 Daugherty Rd, Long Beach, MS 39560
$611
Cash flow
26.6%
Cash-on-Cash Return
11.8%
Cap rate
1.5%
Rent to Value Ratio
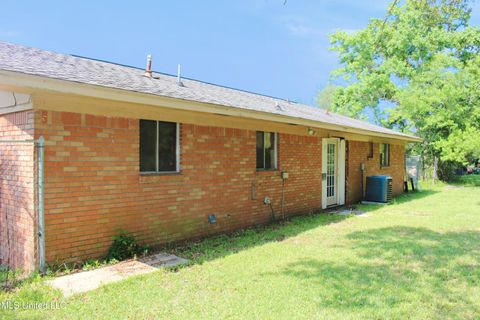
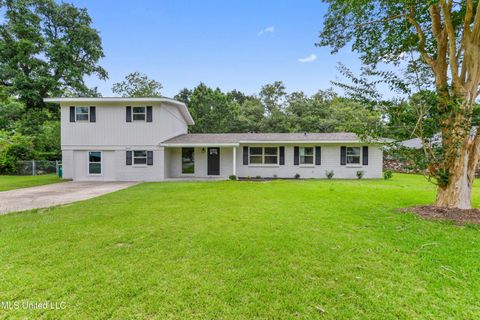
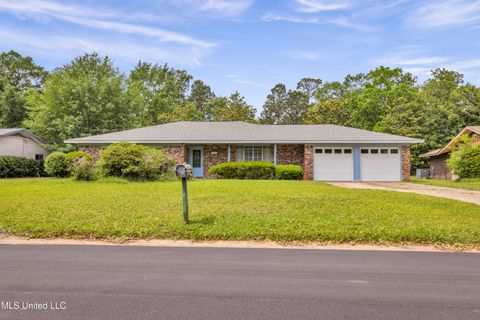
Active
$99,900
3
bds
|
2
ba
|
0
sqft
|
built
1967
205 Shalimar Dr, Long Beach, MS 39560
$495
Cash flow
25.9%
Cash-on-Cash Return
11.6%
Cap rate
1.6%
Rent to Value Ratio
65 out of 74 properties for sale in Long Beach, MS
Limited Results Shown
Create a free account, or log in to reveal all property listings and enjoy the complete experience.
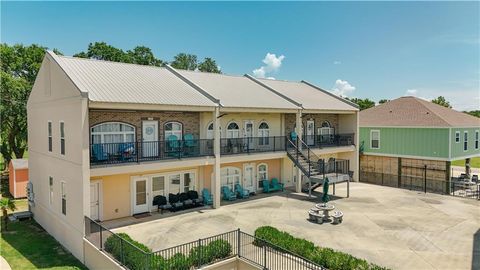
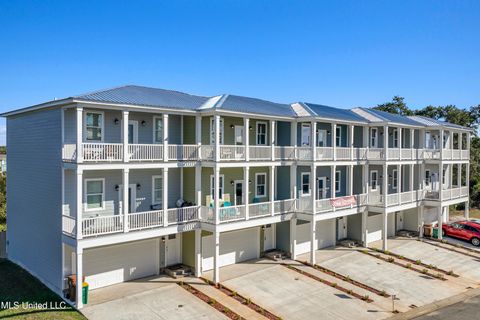
Active
$669,000
3
bds
|
3
ba
|
0
sqft
|
built
2017
205 S Lang Ave, Long Beach, MS 39560
$-1,275
Cash flow
-9.9%
Cash-on-Cash Return
3.4%
Cap rate
0.5%
Rent to Value Ratio
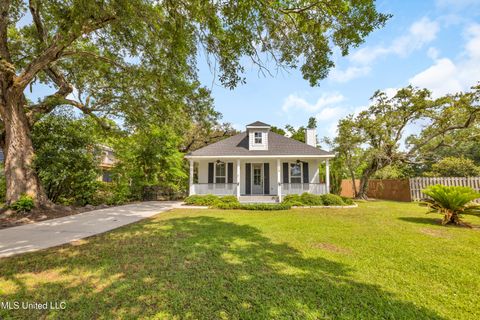
Active
$179,900
3
bds
|
2
ba
|
0
sqft
|
built
1995
20 Oakmont Pl, Long Beach, MS 39560
$-18
Cash flow
-0.5%
Cash-on-Cash Return
6.1%
Cap rate
0.9%
Rent to Value Ratio

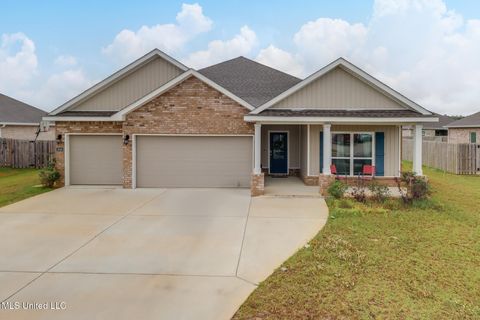
Active
$404,700
4
bds
|
4
ba
|
0
sqft
|
built
2023
5006 Sand Dollar Dr, Long Beach, MS 39560
$-471
Cash flow
-6.1%
Cash-on-Cash Return
4.9%
Cap rate
0.7%
Rent to Value Ratio
Active
$229,900
3
bds
|
2
ba
|
0
sqft
|
built
1966
113 Warwick Dr, Long Beach, MS 39560
$-6
Cash flow
-0.1%
Cash-on-Cash Return
5.6%
Cap rate
0.7%
Rent to Value Ratio
Active
$315,000
5
bds
|
3
ba
|
0
sqft
|
built
1960
120 Clower Ave, Long Beach, MS 39560
$-381
Cash flow
-6.3%
Cash-on-Cash Return
4.2%
Cap rate
0.6%
Rent to Value Ratio
Active
$229,000
2
bds
|
2
ba
|
800
sqft
|
built
2008
548 W Beach Blvd, Long Beach, MS 39560
$158
Cash flow
3.6%
Cash-on-Cash Return
6.5%
Cap rate
0.8%
Rent to Value Ratio

Active
$190,000
1
bds
|
1
ba
|
0
sqft
|
built
2008
305 S Cleveland Ave, Long Beach, MS 39560
$-368
Cash flow
-10.1%
Cash-on-Cash Return
3.4%
Cap rate
0.5%
Rent to Value Ratio

Active
$265,000
3
bds
|
2
ba
|
0
sqft
|
built
1950
110 Oak Gardens Ave, Long Beach, MS 39560
$-88
Cash flow
-1.7%
Cash-on-Cash Return
5.3%
Cap rate
0.7%
Rent to Value Ratio

Active
$384,000
3
bds
|
2
ba
|
0
sqft
|
built
2006
122 Carroll Ave, Long Beach, MS 39560
$-755
Cash flow
-10.3%
Cash-on-Cash Return
3.3%
Cap rate
0.5%
Rent to Value Ratio
Active
$279,900
4
bds
|
3
ba
|
0
sqft
|
built
1960
204 Trautman Ave, Long Beach, MS 39560
$-6
Cash flow
-0.1%
Cash-on-Cash Return
5.7%
Cap rate
0.8%
Rent to Value Ratio
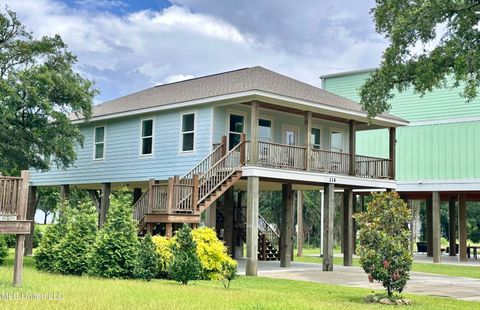
Active
$460,000
3
bds
|
2
ba
|
0
sqft
|
built
2021
216 West Ave, Long Beach, MS 39560
$-691
Cash flow
-7.8%
Cash-on-Cash Return
3.9%
Cap rate
0.6%
Rent to Value Ratio
Active
$499,000
4
bds
|
3
ba
|
0
sqft
|
built
2009
103 Buena Vista Dr, Long Beach, MS 39560
$-649
Cash flow
-6.8%
Cash-on-Cash Return
4.1%
Cap rate
0.6%
Rent to Value Ratio

Active
$309,000
3
bds
|
2
ba
|
0
sqft
|
built
1966
5539 Gates Ave, Long Beach, MS 39560
$-6
Cash flow
-0.1%
Cash-on-Cash Return
5.7%
Cap rate
0.7%
Rent to Value Ratio
Active
$542,000
3
bds
|
3
ba
|
0
sqft
|
built
2021
605 Magnolia St, Long Beach, MS 39560
$-799
Cash flow
-7.7%
Cash-on-Cash Return
3.9%
Cap rate
0.6%
Rent to Value Ratio
Active
$345,000
4
bds
|
3
ba
|
0
sqft
|
built
1966
109 Boggs Cir, Long Beach, MS 39560
$-94
Cash flow
-1.4%
Cash-on-Cash Return
5.4%
Cap rate
0.7%
Rent to Value Ratio
Active
$294,900
3
bds
|
2
ba
|
0
sqft
|
built
2017
2018 Pelican Cir, Long Beach, MS 39560
$-186
Cash flow
-3.3%
Cash-on-Cash Return
5.5%
Cap rate
0.7%
Rent to Value Ratio

Active
$649,000
4
bds
|
3
ba
|
0
sqft
|
built
2007
129 Marcie Dr, Long Beach, MS 39560
$-1,389
Cash flow
-11.2%
Cash-on-Cash Return
3.1%
Cap rate
0.4%
Rent to Value Ratio

Active
$265,000
3
bds
|
2
ba
|
0
sqft
|
built
1995
1154 E Old Pass Rd, Long Beach, MS 39560
$-62
Cash flow
-1.2%
Cash-on-Cash Return
5.4%
Cap rate
0.7%
Rent to Value Ratio

Active
$269,900
5
bds
|
4
ba
|
0
sqft
|
built
1965
119 N Seashore Ave, Long Beach, MS 39560
$226
Cash flow
4.4%
Cash-on-Cash Return
6.7%
Cap rate
0.8%
Rent to Value Ratio

Active
$324,000
2
bds
|
3
ba
|
0
sqft
|
built
2007
21 Oak Alley Ln, Long Beach, MS 39560
$-866
Cash flow
-13.9%
Cash-on-Cash Return
2.5%
Cap rate
0.6%
Rent to Value Ratio

Active
$285,000
4
bds
|
3
ba
|
0
sqft
|
built
1952
114 Olson Ave, Long Beach, MS 39560
$-30
Cash flow
-0.5%
Cash-on-Cash Return
5.6%
Cap rate
0.8%
Rent to Value Ratio

Active
$310,000
3
bds
|
2
ba
|
0
sqft
|
built
1955
318 E Fourth St, Long Beach, MS 39560
$-214
Cash flow
-3.6%
Cash-on-Cash Return
4.9%
Cap rate
0.7%
Rent to Value Ratio

Active
$329,900
4
bds
|
2
ba
|
0
sqft
|
built
2019
2006 Pelican Cir, Long Beach, MS 39560
$-275
Cash flow
-4.3%
Cash-on-Cash Return
4.7%
Cap rate
0.8%
Rent to Value Ratio
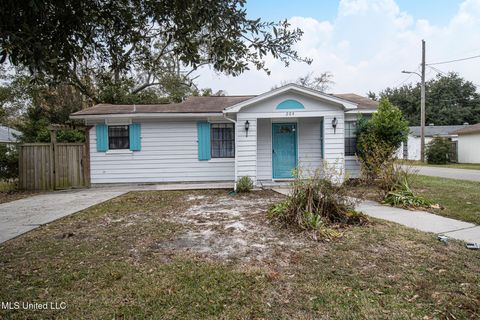
Active
$145,000
3
bds
|
1
ba
|
0
sqft
|
built
1966
117 Gandy Cir, Long Beach, MS 39560
$292
Cash flow
10.5%
Cash-on-Cash Return
8.1%
Cap rate
1.1%
Rent to Value Ratio

Active
$249,000
4
bds
|
3
ba
|
0
sqft
|
built
1963
449 Klondyke Rd, Long Beach, MS 39560
$85
Cash flow
1.8%
Cash-on-Cash Return
6.1%
Cap rate
0.9%
Rent to Value Ratio
Active
$315,000
3
bds
|
4
ba
|
0
sqft
|
built
2023
82 Oak Alley Ln, Long Beach, MS 39560
$-785
Cash flow
-13.0%
Cash-on-Cash Return
2.7%
Cap rate
0.8%
Rent to Value Ratio
Active
$240,000
3
bds
|
2
ba
|
0
sqft
|
built
1969
121 Edmund Dr, Long Beach, MS 39560
$156
Cash flow
3.4%
Cash-on-Cash Return
6.5%
Cap rate
0.8%
Rent to Value Ratio

Active
$232,500
4
bds
|
2
ba
|
0
sqft
|
built
1959
328 Seal Ave, Long Beach, MS 39560
$-85
Cash flow
-1.9%
Cash-on-Cash Return
5.2%
Cap rate
0.7%
Rent to Value Ratio
Active
$465,000
3
bds
|
2
ba
|
0
sqft
|
built
2015
118 W Third St, Long Beach, MS 39560
$-396
Cash flow
-4.4%
Cash-on-Cash Return
4.7%
Cap rate
0.6%
Rent to Value Ratio

Active
$139,900
3
bds
|
2
ba
|
0
sqft
|
built
1955
207 Mc Caughan Ave, Long Beach, MS 39560
$389
Cash flow
14.5%
Cash-on-Cash Return
9.0%
Cap rate
1.2%
Rent to Value Ratio

Active
$259,900
5
bds
|
2
ba
|
0
sqft
|
built
1960
503 W Old Pass Rd, Long Beach, MS 39560
$400
Cash flow
8.0%
Cash-on-Cash Return
7.5%
Cap rate
1.0%
Rent to Value Ratio
Active
$359,900
4
bds
|
3
ba
|
0
sqft
|
built
2022
3046 Sea Oats Dr, Long Beach, MS 39560
$-196
Cash flow
-2.8%
Cash-on-Cash Return
5.0%
Cap rate
0.7%
Rent to Value Ratio

Active
$319,900
2
bds
|
3
ba
|
0
sqft
|
built
2008
548 W Beach Blvd, Long Beach, MS 39560
$-414
Cash flow
-6.8%
Cash-on-Cash Return
4.1%
Cap rate
0.6%
Rent to Value Ratio

Active
$247,000
4
bds
|
2
ba
|
0
sqft
|
built
1986
213 Oak St, Long Beach, MS 39560
$21
Cash flow
0.4%
Cash-on-Cash Return
5.8%
Cap rate
0.8%
Rent to Value Ratio

Active
$495,000
4
bds
|
3
ba
|
0
sqft
|
built
1995
217 Boggs Cir, Long Beach, MS 39560
$-958
Cash flow
-10.1%
Cash-on-Cash Return
3.4%
Cap rate
0.5%
Rent to Value Ratio

Active
$349,900
3
bds
|
2
ba
|
0
sqft
|
built
1960
204 E Third St, Long Beach, MS 39560
$-507
Cash flow
-7.6%
Cash-on-Cash Return
3.9%
Cap rate
0.5%
Rent to Value Ratio

Active
$249,000
2
bds
|
2
ba
|
0
sqft
|
built
1940
124 E Second St, Long Beach, MS 39560
$58
Cash flow
1.2%
Cash-on-Cash Return
6.0%
Cap rate
0.8%
Rent to Value Ratio

Active
$357,500
2
bds
|
3
ba
|
0
sqft
|
built
2007
705 W Beach Blvd, Long Beach, MS 39560
$-818
Cash flow
-11.9%
Cash-on-Cash Return
2.9%
Cap rate
0.7%
Rent to Value Ratio