Long Beach, MS Investment Properties for Sale
Browse homes for sale and investment properties in Long Beach, MS. Refine your search by price, property type, or more.
Best cash flowing properties in Long Beach, MS

Active
$114,500
1
bds
|
1
ba
|
0
sqft
|
built
1999
20294 Daugherty Rd, Long Beach, MS 39560
$637
Cash flow
29.0%
Cash-on-Cash Return
12.4%
Cap rate
1.6%
Rent to Value Ratio
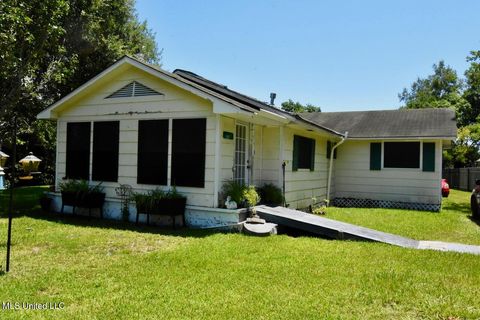
Active
$119,900
3
bds
|
1
ba
|
0
sqft
|
built
1951
432 Klondyke Rd, Long Beach, MS 39560
$391
Cash flow
17.0%
Cash-on-Cash Return
9.6%
Cap rate
1.2%
Rent to Value Ratio
58 out of 70 properties for sale in Long Beach, MS
Limited Results Shown
Create a free account, or log in to reveal all property listings and enjoy the complete experience.

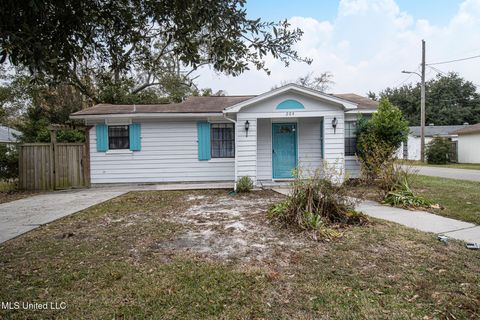
Active
$295,000
3
bds
|
2
ba
|
0
sqft
|
built
1950
121 E Second St, Long Beach, MS 39560
$-53
Cash flow
-0.9%
Cash-on-Cash Return
5.5%
Cap rate
0.7%
Rent to Value Ratio
Active
$175,000
3
bds
|
2
ba
|
0
sqft
|
built
1995
20 Oakmont Pl, Long Beach, MS 39560
$89
Cash flow
2.7%
Cash-on-Cash Return
6.3%
Cap rate
0.9%
Rent to Value Ratio
Active
$198,500
3
bds
|
2
ba
|
0
sqft
|
built
1971
908 Latil St, Long Beach, MS 39560
$206
Cash flow
5.4%
Cash-on-Cash Return
6.9%
Cap rate
0.9%
Rent to Value Ratio
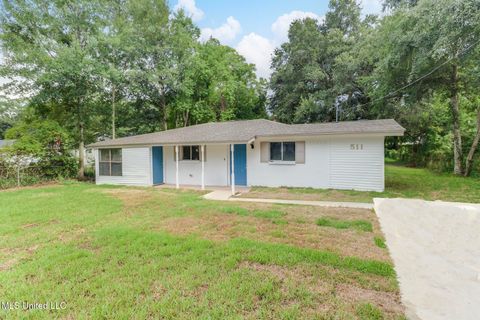
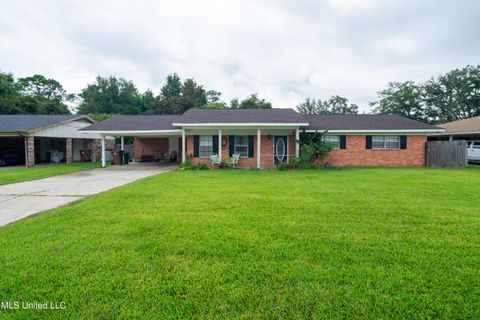
Active
$189,900
4
bds
|
3
ba
|
0
sqft
|
built
1960
511 E Old Pass Rd, Long Beach, MS 39560
$5
Cash flow
0.1%
Cash-on-Cash Return
5.7%
Cap rate
0.8%
Rent to Value Ratio

Active
$199,000
3
bds
|
2
ba
|
0
sqft
|
built
1948
410 N Seal Ave, Long Beach, MS 39560
$13
Cash flow
0.3%
Cash-on-Cash Return
5.8%
Cap rate
0.8%
Rent to Value Ratio
Active
$280,000
2
bds
|
2
ba
|
0
sqft
|
built
2016
74 Oak Alley Ln, Long Beach, MS 39560
$-338
Cash flow
-6.3%
Cash-on-Cash Return
4.2%
Cap rate
0.7%
Rent to Value Ratio

Active
$314,900
3
bds
|
2
ba
|
0
sqft
|
built
1985
18059 Commission Rd, Long Beach, MS 39560
$-592
Cash flow
-9.8%
Cash-on-Cash Return
3.4%
Cap rate
0.5%
Rent to Value Ratio
Active
$175,000
1
bds
|
1
ba
|
0
sqft
|
built
1950
215 E First St, Long Beach, MS 39560
$-205
Cash flow
-6.1%
Cash-on-Cash Return
4.3%
Cap rate
0.6%
Rent to Value Ratio
Active
$449,000
4
bds
|
3
ba
|
0
sqft
|
built
1992
19085 Commission Rd, Long Beach, MS 39560
$-696
Cash flow
-8.1%
Cash-on-Cash Return
3.8%
Cap rate
0.5%
Rent to Value Ratio
Active
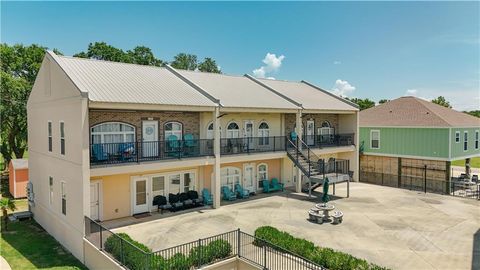
$691,500
3
bds
|
4
ba
|
0
sqft
|
built
2010
253 S Lang Ave, Long Beach, MS 39560
$-1,008
Cash flow
-7.6%
Cash-on-Cash Return
3.9%
Cap rate
0.6%
Rent to Value Ratio

Active
$345,000
3
bds
|
3
ba
|
0
sqft
|
built
1994
5010 Live Oak Dr, Long Beach, MS 39560
$-281
Cash flow
-4.2%
Cash-on-Cash Return
4.7%
Cap rate
0.7%
Rent to Value Ratio

Active
$224,900
3
bds
|
2
ba
|
0
sqft
|
built
1975
205 Alyce Pl, Long Beach, MS 39560
$-68
Cash flow
-1.6%
Cash-on-Cash Return
5.3%
Cap rate
0.8%
Rent to Value Ratio
Active
$626,000
3
bds
|
2
ba
|
0
sqft
|
built
2008
447 Russell Ave, Long Beach, MS 39560
$-1,638
Cash flow
-13.7%
Cash-on-Cash Return
2.5%
Cap rate
0.4%
Rent to Value Ratio
Active
$249,900
3
bds
|
2
ba
|
0
sqft
|
built
1965
112 Olson Ave, Long Beach, MS 39560
$100
Cash flow
2.1%
Cash-on-Cash Return
6.2%
Cap rate
0.8%
Rent to Value Ratio

Active
$459,000
3
bds
|
2
ba
|
0
sqft
|
built
2021
146 Sea Oaks Blvd, Long Beach, MS 39560
$-271
Cash flow
-3.1%
Cash-on-Cash Return
5.0%
Cap rate
0.7%
Rent to Value Ratio
Active
$669,000
3
bds
|
3
ba
|
0
sqft
|
built
2017
205 S Lang Ave, Long Beach, MS 39560
$-1,275
Cash flow
-9.9%
Cash-on-Cash Return
3.4%
Cap rate
0.5%
Rent to Value Ratio

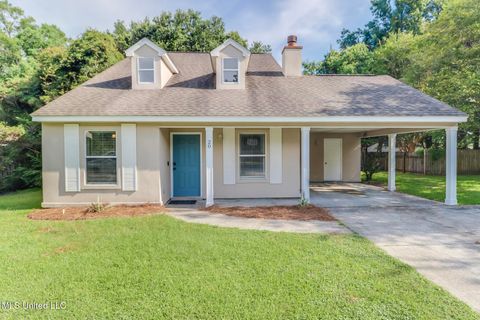
Active
$415,000
3
bds
|
2
ba
|
0
sqft
|
built
2023
134 Markham Dr, Long Beach, MS 39560
$-65
Cash flow
-0.8%
Cash-on-Cash Return
5.5%
Cap rate
0.7%
Rent to Value Ratio
Active
$400,000
4
bds
|
4
ba
|
0
sqft
|
built
2022
6026 Seagull Dr, Long Beach, MS 39560
$-521
Cash flow
-6.8%
Cash-on-Cash Return
4.1%
Cap rate
0.7%
Rent to Value Ratio

Active
$299,999
4
bds
|
2
ba
|
0
sqft
|
built
2021
211 Hawthorne Dr, Long Beach, MS 39560
$-63
Cash flow
-1.1%
Cash-on-Cash Return
5.4%
Cap rate
0.8%
Rent to Value Ratio
Active
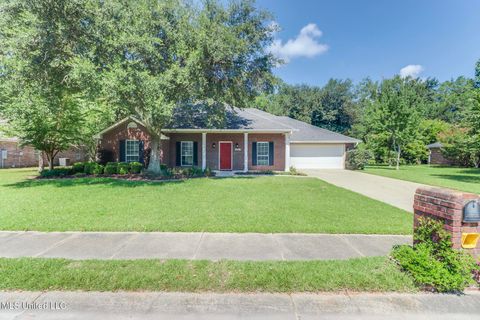
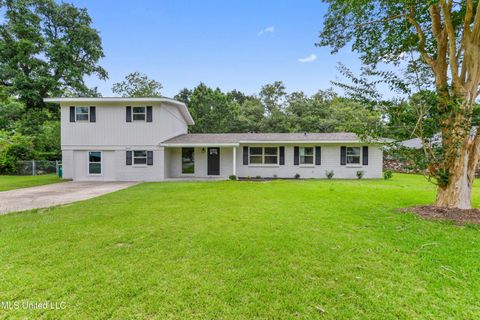
$338,000
4
bds
|
3
ba
|
0
sqft
|
built
2000
26 Scott Station Cv, Long Beach, MS 39560
$-381
Cash flow
-5.9%
Cash-on-Cash Return
4.3%
Cap rate
0.7%
Rent to Value Ratio

Active
$679,000
3
bds
|
3
ba
|
0
sqft
|
built
2021
405 S Cleveland Ave, Long Beach, MS 39560
$-1,412
Cash flow
-10.8%
Cash-on-Cash Return
3.2%
Cap rate
0.5%
Rent to Value Ratio
Active
$294,900
4
bds
|
3
ba
|
0
sqft
|
built
1970
112 Driftwood Dr, Long Beach, MS 39560
$173
Cash flow
3.1%
Cash-on-Cash Return
6.4%
Cap rate
0.8%
Rent to Value Ratio
Active
$199,000
3
bds
|
2
ba
|
0
sqft
|
built
1969
100 Pampas Dr, Long Beach, MS 39560
$284
Cash flow
7.4%
Cash-on-Cash Return
7.4%
Cap rate
0.9%
Rent to Value Ratio
Active
$725,000
4
bds
|
2
ba
|
0
sqft
|
built
2023
119 Sea Oaks Blvd, Long Beach, MS 39560
$-2,016
Cash flow
-14.5%
Cash-on-Cash Return
2.3%
Cap rate
0.5%
Rent to Value Ratio
Active
$319,000
4
bds
|
3
ba
|
0
sqft
|
built
1979
3 Briarwood Cir, Long Beach, MS 39560
$-139
Cash flow
-2.3%
Cash-on-Cash Return
5.2%
Cap rate
0.7%
Rent to Value Ratio
Active
$260,000
3
bds
|
2
ba
|
0
sqft
|
built
1971
121 Vance Pl, Long Beach, MS 39560
$106
Cash flow
2.1%
Cash-on-Cash Return
6.2%
Cap rate
0.8%
Rent to Value Ratio
Active
$399,000
3
bds
|
2
ba
|
1,726
sqft
|
built
2008
119 Winters Ln, Long Beach, MS 39560
$-163
Cash flow
-2.1%
Cash-on-Cash Return
5.2%
Cap rate
0.6%
Rent to Value Ratio
Active
$224,000
4
bds
|
2
ba
|
0
sqft
|
built
1967
914 Beatrice Dr, Long Beach, MS 39560
$141
Cash flow
3.3%
Cash-on-Cash Return
6.4%
Cap rate
0.9%
Rent to Value Ratio

Active
$404,700
4
bds
|
4
ba
|
0
sqft
|
built
2023
5006 Sand Dollar Dr, Long Beach, MS 39560
$-273
Cash flow
-3.5%
Cash-on-Cash Return
4.9%
Cap rate
0.7%
Rent to Value Ratio
Active
$273,900
5
bds
|
3
ba
|
0
sqft
|
built
1960
120 Clower Ave, Long Beach, MS 39560
$-186
Cash flow
-3.5%
Cash-on-Cash Return
4.9%
Cap rate
0.7%
Rent to Value Ratio
Active
$219,999
2
bds
|
2
ba
|
800
sqft
|
built
2008
548 W Beach Blvd, Long Beach, MS 39560
$201
Cash flow
4.8%
Cash-on-Cash Return
6.8%
Cap rate
0.8%
Rent to Value Ratio

Active
$185,000
1
bds
|
1
ba
|
0
sqft
|
built
2008
305 S Cleveland Ave, Long Beach, MS 39560
$-344
Cash flow
-9.7%
Cash-on-Cash Return
3.4%
Cap rate
0.5%
Rent to Value Ratio

Active
$384,000
3
bds
|
2
ba
|
0
sqft
|
built
2006
122 Carroll Ave, Long Beach, MS 39560
$-755
Cash flow
-10.3%
Cash-on-Cash Return
3.3%
Cap rate
0.5%
Rent to Value Ratio
Active
$265,000
4
bds
|
3
ba
|
0
sqft
|
built
1960
204 Trautman Ave, Long Beach, MS 39560
$65
Cash flow
1.3%
Cash-on-Cash Return
6.0%
Cap rate
0.9%
Rent to Value Ratio
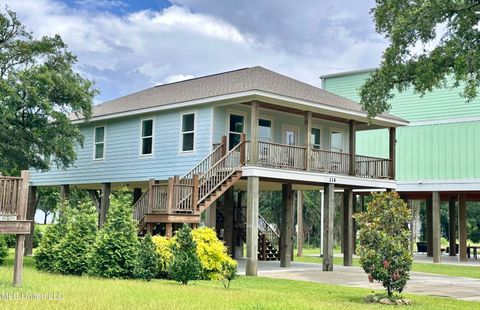
Active
$448,500
3
bds
|
2
ba
|
0
sqft
|
built
2021
216 West Ave, Long Beach, MS 39560
$-636
Cash flow
-7.4%
Cash-on-Cash Return
4.0%
Cap rate
0.6%
Rent to Value Ratio
Active
$499,000
4
bds
|
3
ba
|
0
sqft
|
built
2009
103 Buena Vista Dr, Long Beach, MS 39560
$-649
Cash flow
-6.8%
Cash-on-Cash Return
4.1%
Cap rate
0.6%
Rent to Value Ratio
Active
$542,000
3
bds
|
3
ba
|
0
sqft
|
built
2021
605 Magnolia St, Long Beach, MS 39560
$-799
Cash flow
-7.7%
Cash-on-Cash Return
3.9%
Cap rate
0.6%
Rent to Value Ratio

Active
$329,000
4
bds
|
3
ba
|
0
sqft
|
built
1966
109 Boggs Cir, Long Beach, MS 39560
$-18
Cash flow
-0.3%
Cash-on-Cash Return
5.6%
Cap rate
0.8%
Rent to Value Ratio