Long Beach, NY Investment Properties for Sale
Browse homes for sale and investment properties in Long Beach, NY. Refine your search by price, property type, or more.
Best cash flowing properties in Long Beach, NY
Active
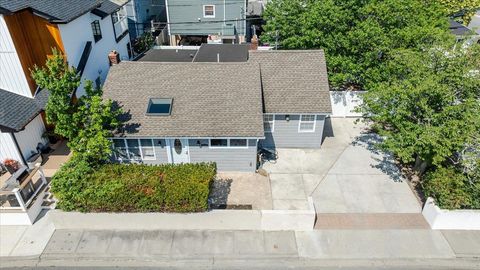
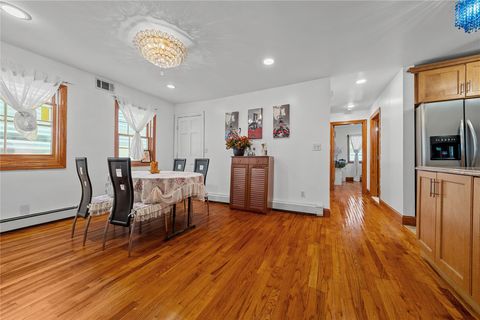
$450,000
1
bds
|
1
ba
|
700
sqft
|
built
1973
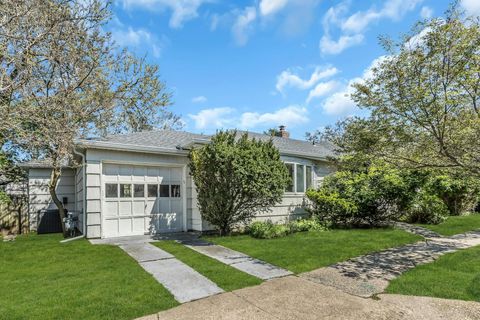
650 Shore Rd, Long Beach, NY 11561
$-1,312
Cash flow
-15.2%
Cash-on-Cash Return
2.6%
Cap rate
0.5%
Rent to Value Ratio
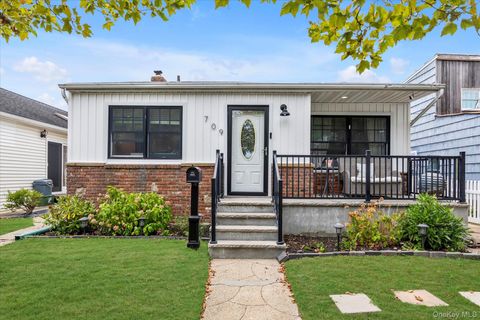
Active
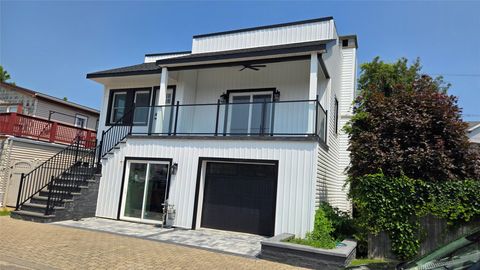
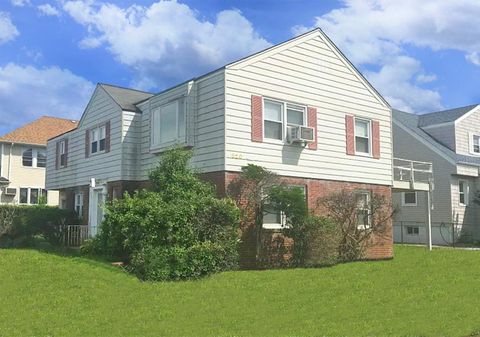
$789,000
3
bds
|
2
ba
|
1,734
sqft
|
built
1955
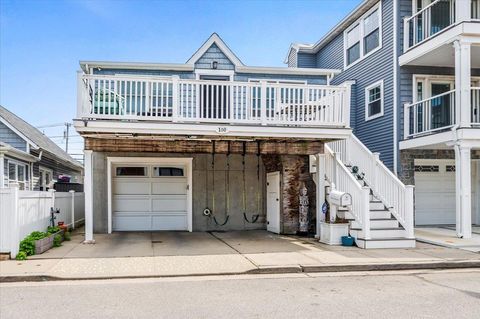
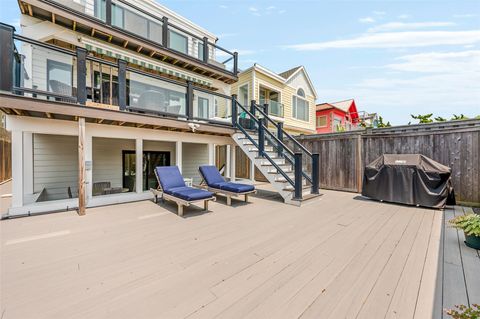
709 Monroe Blvd, Long Beach, NY 11561
$-1,943
Cash flow
-12.8%
Cash-on-Cash Return
3.1%
Cap rate
0.6%
Rent to Value Ratio
52 out of 70 properties for sale in Long Beach, NY
Limited Results Shown
Create a free account, or log in to reveal all property listings and enjoy the complete experience.
Active
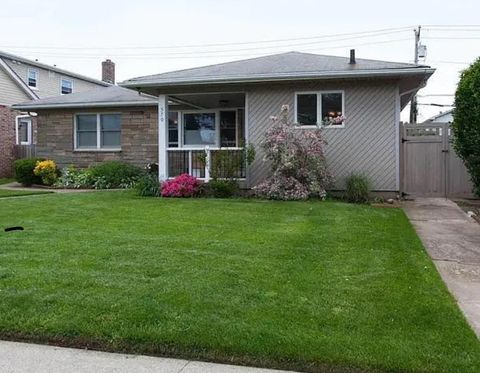
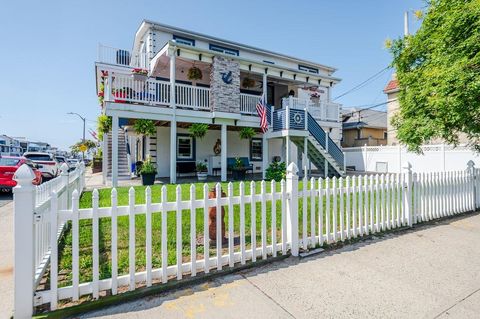
$1,598,000
4
bds
|
3
ba
|
0
sqft
|
built
2016
59 Delaware Ave, Long Beach, NY 11561
$-4,807
Cash flow
-15.7%
Cash-on-Cash Return
2.5%
Cap rate
0.4%
Rent to Value Ratio
Active
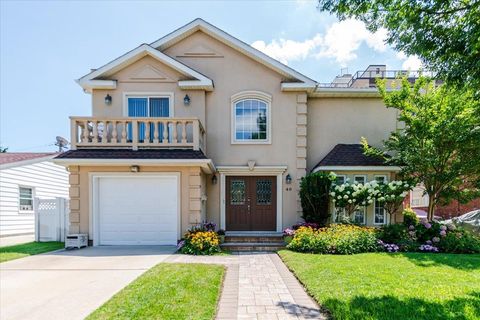
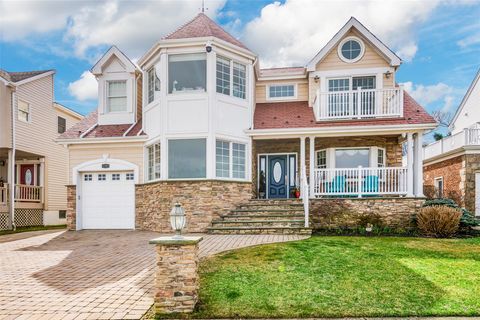
$1,450,000
4
bds
|
2
ba
|
1,900
sqft
|
built
1974
221 Washington Blvd, Long Beach, NY 11561
$-4,783
Cash flow
-17.2%
Cash-on-Cash Return
2.1%
Cap rate
0.4%
Rent to Value Ratio
Active
$599,000
2
bds
|
2
ba
|
1,900
sqft
|
built
1965
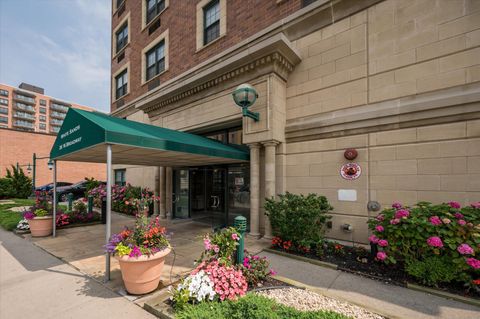
25 W Broadway, Long Beach, NY 11561
$-2,761
Cash flow
-24.0%
Cash-on-Cash Return
0.5%
Cap rate
0.5%
Rent to Value Ratio
Active
$1,298,000
6
bds
|
4
ba
|
0
sqft
|
built
1996
318 E Olive St, Long Beach, NY 11561
$-5,386
Cash flow
-21.6%
Cash-on-Cash Return
1.1%
Cap rate
0.3%
Rent to Value Ratio
Active
$1,449,000
4
bds
|
3
ba
|
2,000
sqft
|
built
1977
500 W Penn St, Long Beach, NY 11561
$-5,270
Cash flow
-19.0%
Cash-on-Cash Return
1.7%
Cap rate
0.3%
Rent to Value Ratio
Active
$795,000
3
bds
|
2
ba
|
1,215
sqft
|
built
1940
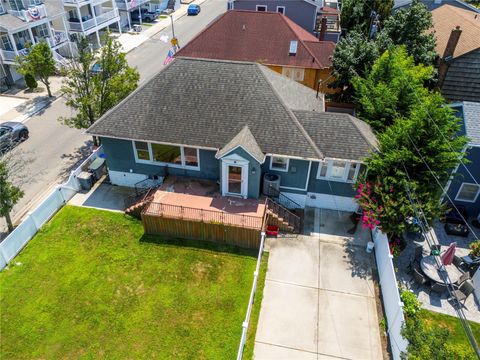
340 E Pine St, Long Beach, NY 11561
$-2,853
Cash flow
-18.7%
Cash-on-Cash Return
1.8%
Cap rate
0.4%
Rent to Value Ratio
Active
$1,550,000
2
bds
|
2
ba
|
1,700
sqft
|
built
2005
26 W Broadway, Long Beach, NY 11561
$-7,176
Cash flow
-24.2%
Cash-on-Cash Return
0.5%
Cap rate
0.3%
Rent to Value Ratio
Active
$849,000
4
bds
|
2
ba
|
1,670
sqft
|
built
1925
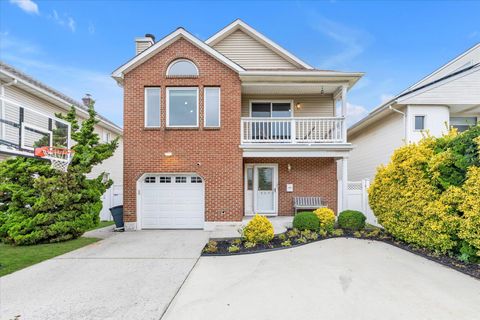
49 Barnes St, Long Beach, NY 11561
$-3,117
Cash flow
-19.2%
Cash-on-Cash Return
1.7%
Cap rate
0.4%
Rent to Value Ratio
Active
$1,200,000
4
bds
|
3
ba
|
3,000
sqft
|
built
2002
227 W Pine St, Long Beach, NY 11561
$-4,049
Cash flow
-17.6%
Cash-on-Cash Return
2.0%
Cap rate
0.4%
Rent to Value Ratio
Active
$875,000
4
bds
|
2
ba
|
1,480
sqft
|
built
1930
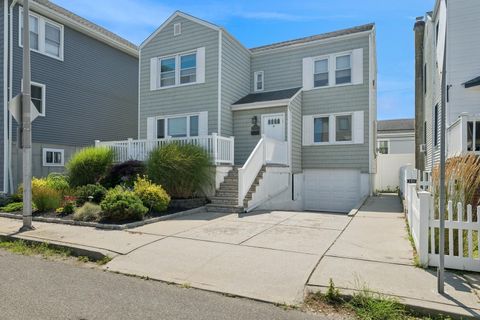
7 Vinton St, Long Beach, NY 11561
$-3,051
Cash flow
-18.2%
Cash-on-Cash Return
1.9%
Cap rate
0.4%
Rent to Value Ratio
Active
$949,000
3
bds
|
1
ba
|
1,174
sqft
|
built
1918
101 California St, Long Beach, NY 11561
$-3,637
Cash flow
-20.0%
Cash-on-Cash Return
1.5%
Cap rate
0.3%
Rent to Value Ratio
Active
$1,299,000
4
bds
|
3
ba
|
2,500
sqft
|
built
1934
62 Clark St, Long Beach, NY 11561
$-4,054
Cash flow
-16.3%
Cash-on-Cash Return
2.3%
Cap rate
0.4%
Rent to Value Ratio
Active
$875,000
3
bds
|
2
ba
|
0
sqft
|
built
1954
570 E Chester St, Long Beach, NY 11561
$-3,295
Cash flow
-19.6%
Cash-on-Cash Return
1.5%
Cap rate
0.4%
Rent to Value Ratio
Active
$1,449,000
5
bds
|
3
ba
|
3,590
sqft
|
built
1999
40 E Penn St, Long Beach, NY 11561
$-6,890
Cash flow
-24.8%
Cash-on-Cash Return
0.4%
Cap rate
0.2%
Rent to Value Ratio
Active
$1,060,000
6
bds
|
4
ba
|
0
sqft
|
built
2006
84 Nebraska St, Long Beach, NY 11561
$-4,439
Cash flow
-21.8%
Cash-on-Cash Return
1.0%
Cap rate
0.3%
Rent to Value Ratio
Active
$789,000
bds
|
0
ba
|
0
sqft
|
built
1975
520 Lafayette Blvd, Long Beach, NY 11561
$-3,642
Cash flow
-24.1%
Cash-on-Cash Return
0.5%
Cap rate
0.3%
Rent to Value Ratio
Active
$1,972,000
4
bds
|
3
ba
|
1,942
sqft
|
built
1930
103 Connecticut Ave, Long Beach, NY 11561
$-9,213
Cash flow
-24.4%
Cash-on-Cash Return
0.5%
Cap rate
0.2%
Rent to Value Ratio
Active
$2,599,999
5
bds
|
5
ba
|
4,449
sqft
|
built
1938
450 W Bay Dr, Long Beach, NY 11561
$-8,219
Cash flow
-16.5%
Cash-on-Cash Return
2.3%
Cap rate
0.4%
Rent to Value Ratio
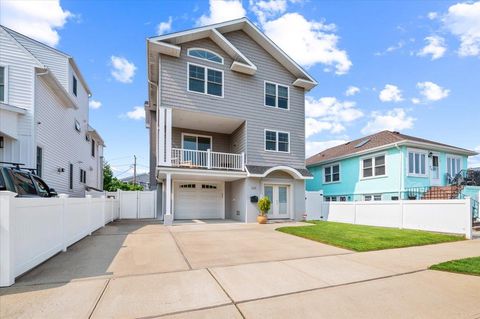
Active
$1,699,000
6
bds
|
3
ba
|
3,544
sqft
|
built
1997
230 W Beech St, Long Beach, NY 11561
$-4,747
Cash flow
-14.6%
Cash-on-Cash Return
2.7%
Cap rate
0.5%
Rent to Value Ratio
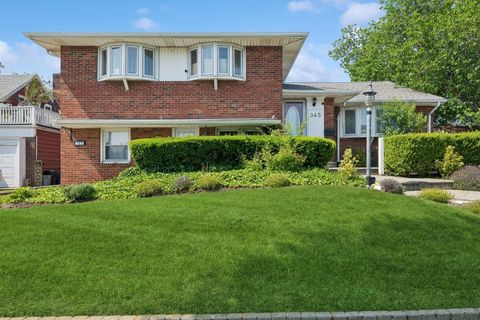
Active
$999,000
5
bds
|
3
ba
|
0
sqft
|
built
1955
345 E Park Ave, Long Beach, NY 11561
$-4,996
Cash flow
-26.1%
Cash-on-Cash Return
0.1%
Cap rate
0.2%
Rent to Value Ratio
Active
$1,150,000
5
bds
|
4
ba
|
2,445
sqft
|
built
1928
151 E Olive St, Long Beach, NY 11561
$-4,644
Cash flow
-21.1%
Cash-on-Cash Return
1.2%
Cap rate
0.3%
Rent to Value Ratio
Active
$1,565,000
4
bds
|
3
ba
|
2,640
sqft
|
built
2017
545 E Fulton St, Long Beach, NY 11561
$-4,653
Cash flow
-15.5%
Cash-on-Cash Return
2.5%
Cap rate
0.4%
Rent to Value Ratio
Active
$3,200,000
3
bds
|
4
ba
|
2,500
sqft
|
built
2010
403 E Boardwalk, Long Beach, NY 11561
$-19,221
Cash flow
-31.3%
Cash-on-Cash Return
-1.1%
Cap rate
0.1%
Rent to Value Ratio
Active
$1,600,000
3
bds
|
2
ba
|
1,800
sqft
|
built
2005
26 W Broadway, Long Beach, NY 11561
$-5,061
Cash flow
-16.5%
Cash-on-Cash Return
2.3%
Cap rate
0.5%
Rent to Value Ratio
Active
$1,175,000
4
bds
|
3
ba
|
0
sqft
|
built
1956
106 Maple Blvd, Long Beach, NY 11561
$-5,093
Cash flow
-22.6%
Cash-on-Cash Return
0.9%
Cap rate
0.3%
Rent to Value Ratio
Active
$899,000
2
bds
|
2
ba
|
1,200
sqft
|
built
2007
260 W Broadway, Long Beach, NY 11561
$-3,463
Cash flow
-20.1%
Cash-on-Cash Return
1.4%
Cap rate
0.4%
Rent to Value Ratio
Active
$999,000
5
bds
|
3
ba
|
2,800
sqft
|
built
1971
23 Vinton St, Long Beach, NY 11561
$-3,489
Cash flow
-18.2%
Cash-on-Cash Return
1.9%
Cap rate
0.4%
Rent to Value Ratio
Active
$1,150,000
3
bds
|
3
ba
|
2,448
sqft
|
built
2015
360 E Hudson St, Long Beach, NY 11561
$-3,893
Cash flow
-17.7%
Cash-on-Cash Return
2.0%
Cap rate
0.4%
Rent to Value Ratio
Active
$1,399,000
3
bds
|
2
ba
|
1,691
sqft
|
built
1920
991 W Park Ave, Long Beach, NY 11561
$-6,413
Cash flow
-23.9%
Cash-on-Cash Return
0.6%
Cap rate
0.2%
Rent to Value Ratio
Active
$1,925,000
5
bds
|
5
ba
|
4,800
sqft
|
built
2025
29 Curley St, Long Beach, NY 11561
$-8,737
Cash flow
-23.7%
Cash-on-Cash Return
0.6%
Cap rate
0.1%
Rent to Value Ratio
Active
$895,000
3
bds
|
2
ba
|
1,450
sqft
|
built
1951
140 Mitchell Ave, Long Beach, NY 11561
$-2,828
Cash flow
-16.5%
Cash-on-Cash Return
2.3%
Cap rate
0.4%
Rent to Value Ratio
Active
$799,000
2
bds
|
1
ba
|
950
sqft
|
built
1921
100 California St, Long Beach, NY 11561
$-2,880
Cash flow
-18.8%
Cash-on-Cash Return
1.7%
Cap rate
0.4%
Rent to Value Ratio
Active
$3,499,000
6
bds
|
4
ba
|
3,410
sqft
|
built
1986
923 Oceanfront, Long Beach, NY 11561
$-12,660
Cash flow
-18.9%
Cash-on-Cash Return
1.7%
Cap rate
0.3%
Rent to Value Ratio

Active
$874,999
2
bds
|
1
ba
|
800
sqft
|
built
1926
74 Wisconsin St, Long Beach, NY 11561
$-2,627
Cash flow
-15.7%
Cash-on-Cash Return
2.5%
Cap rate
0.4%
Rent to Value Ratio

Active
$839,999
4
bds
|
2
ba
|
0
sqft
|
built
1925
236 W Pine St, Long Beach, NY 11561
$-2,939
Cash flow
-18.3%
Cash-on-Cash Return
1.9%
Cap rate
0.4%
Rent to Value Ratio

Active
$699,000
3
bds
|
1
ba
|
1,000
sqft
|
built
1920
92 Nebraska St, Long Beach, NY 11561
$-2,239
Cash flow
-16.7%
Cash-on-Cash Return
2.2%
Cap rate
0.4%
Rent to Value Ratio

Active
$929,000
3
bds
|
2
ba
|
1,856
sqft
|
built
1995
720 W Park Ave, Long Beach, NY 11561
$-2,787
Cash flow
-15.7%
Cash-on-Cash Return
2.5%
Cap rate
0.5%
Rent to Value Ratio

Active
$1,150,000
4
bds
|
3
ba
|
0
sqft
|
built
1936
311 Washington Blvd, Long Beach, NY 11561
$-4,969
Cash flow
-22.5%
Cash-on-Cash Return
0.9%
Cap rate
0.2%
Rent to Value Ratio