Longmont, CO Investment Properties for Sale
Browse homes for sale and investment properties in Longmont, CO. Refine your search by price, property type, or more.
Best cash flowing properties in Longmont, CO
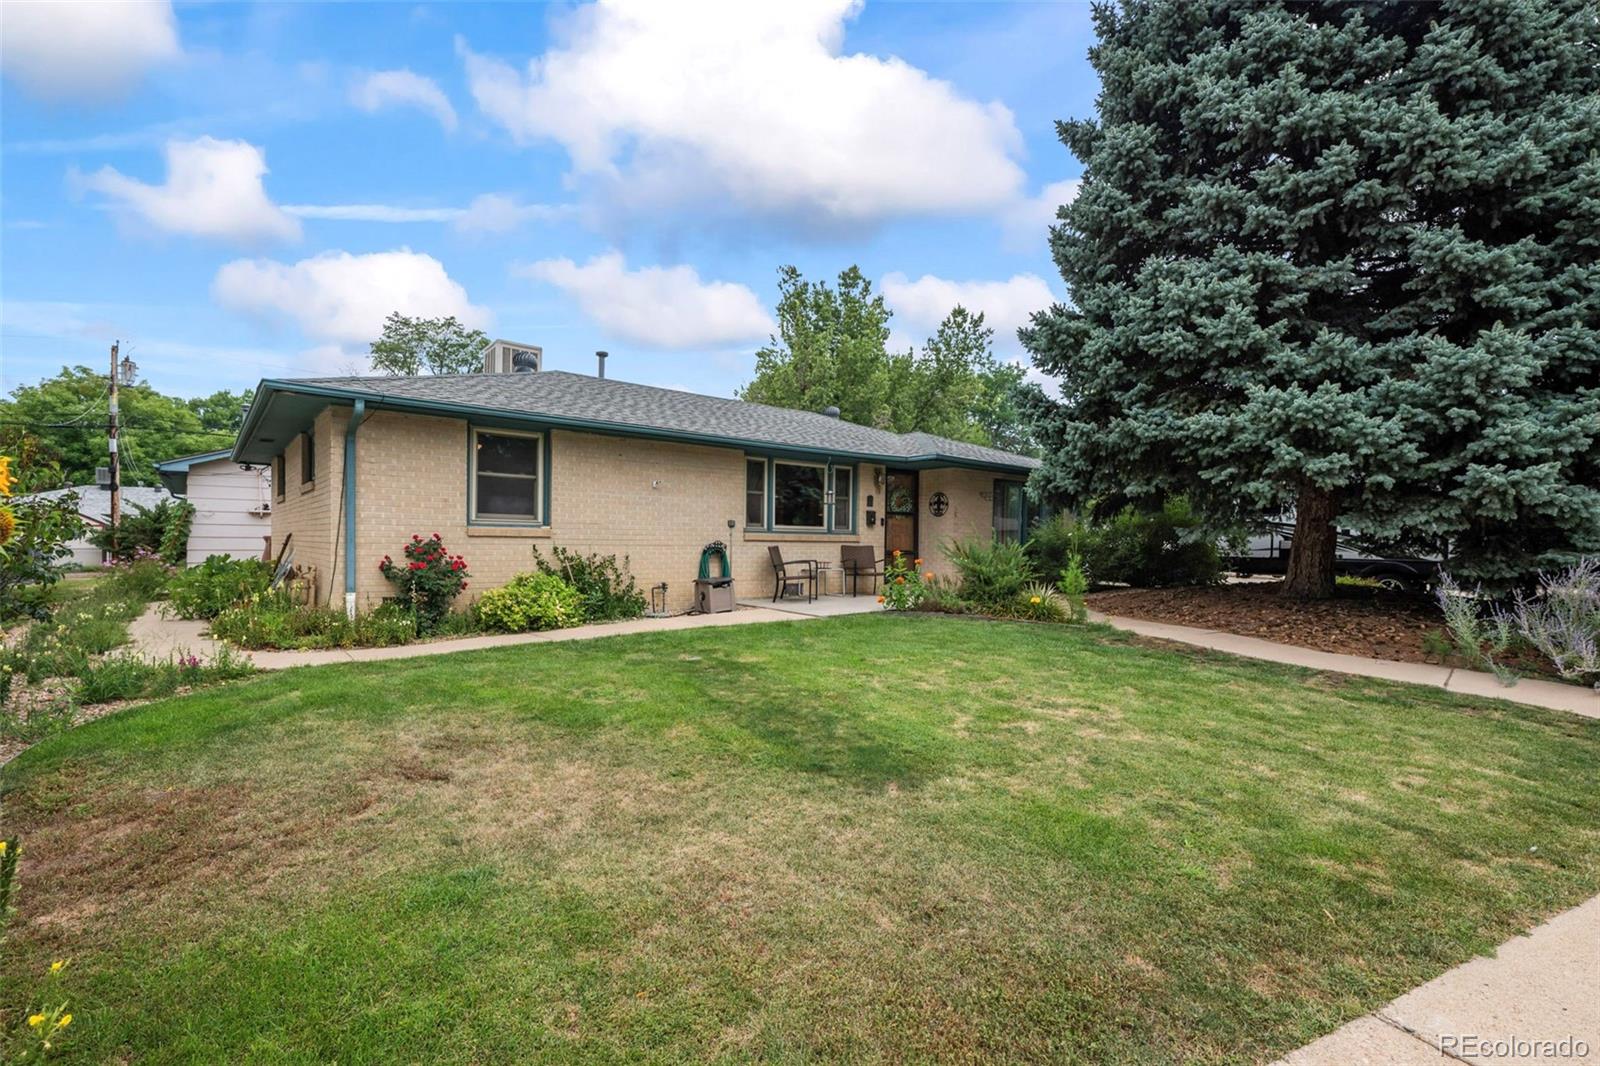
Active
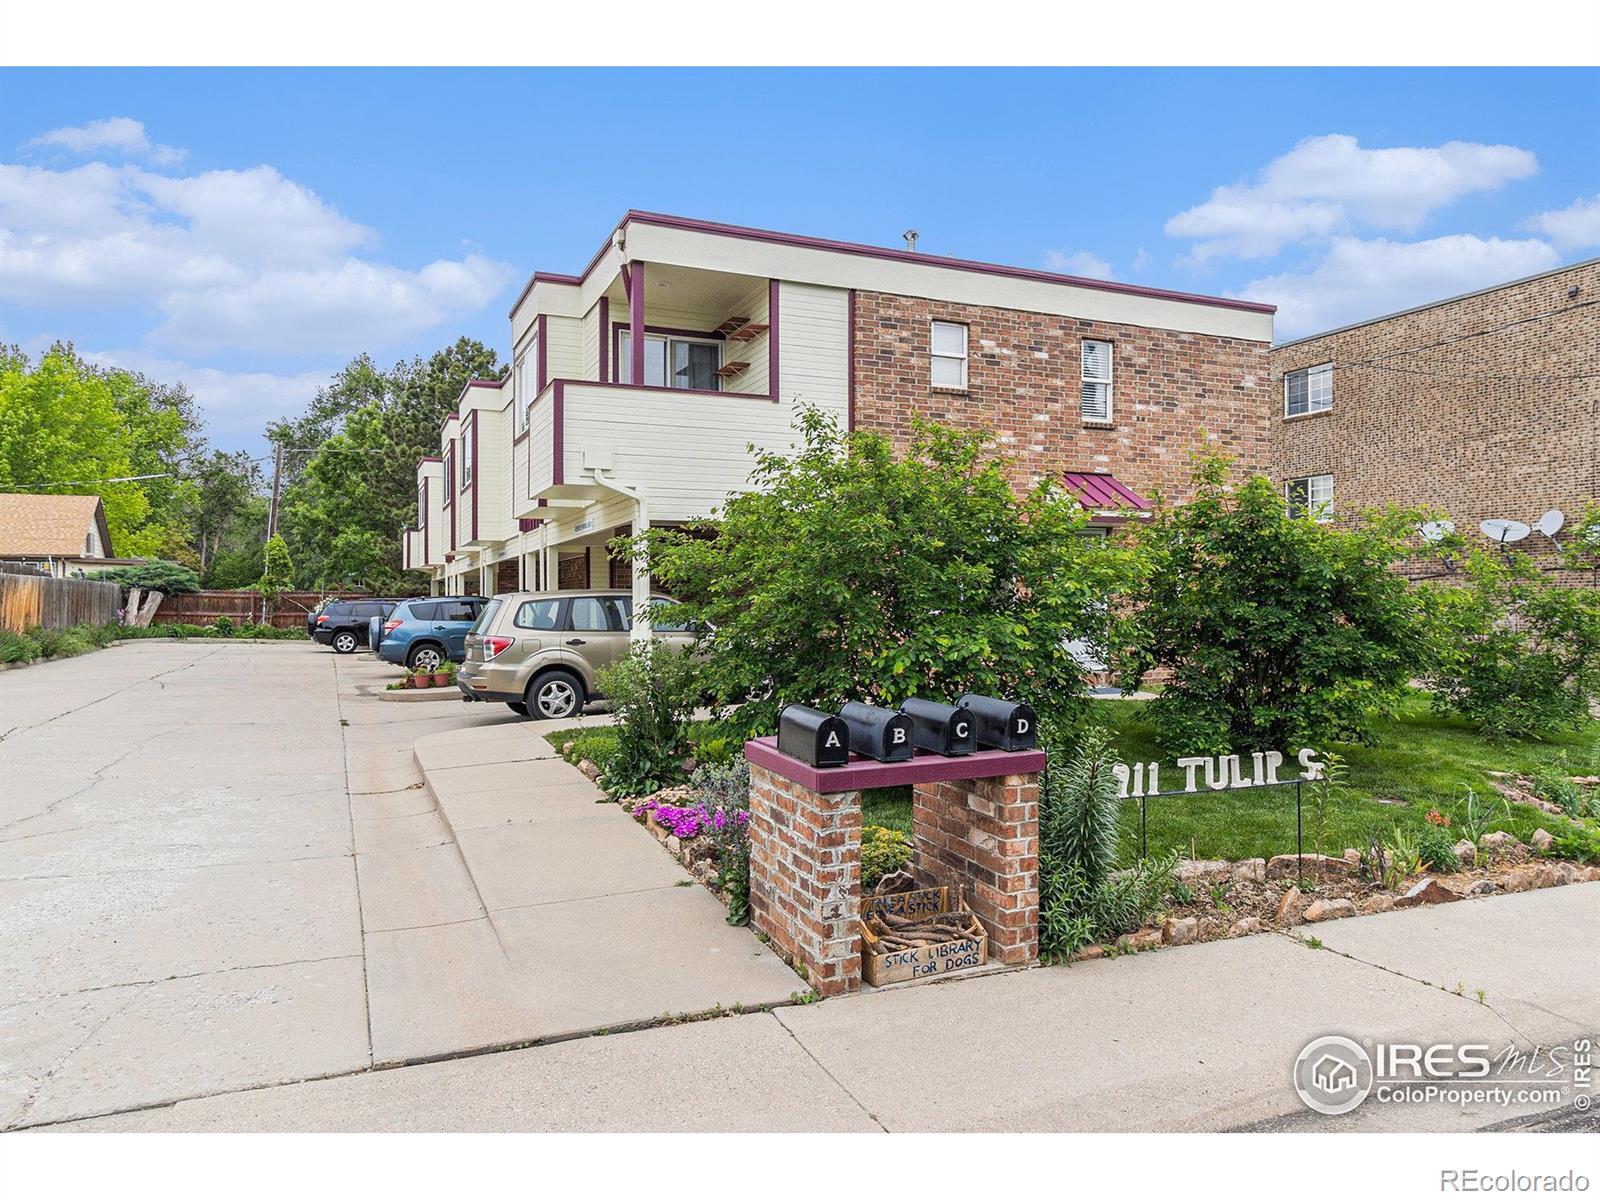
$345,000
2
bds
|
2
ba
|
1,196
sqft
|
built
1998
911 Tulip St, Longmont, CO 80501
$-646
Cash flow
-9.8%
Cash-on-Cash Return
4.0%
Cap rate
0.6%
Rent to Value Ratio
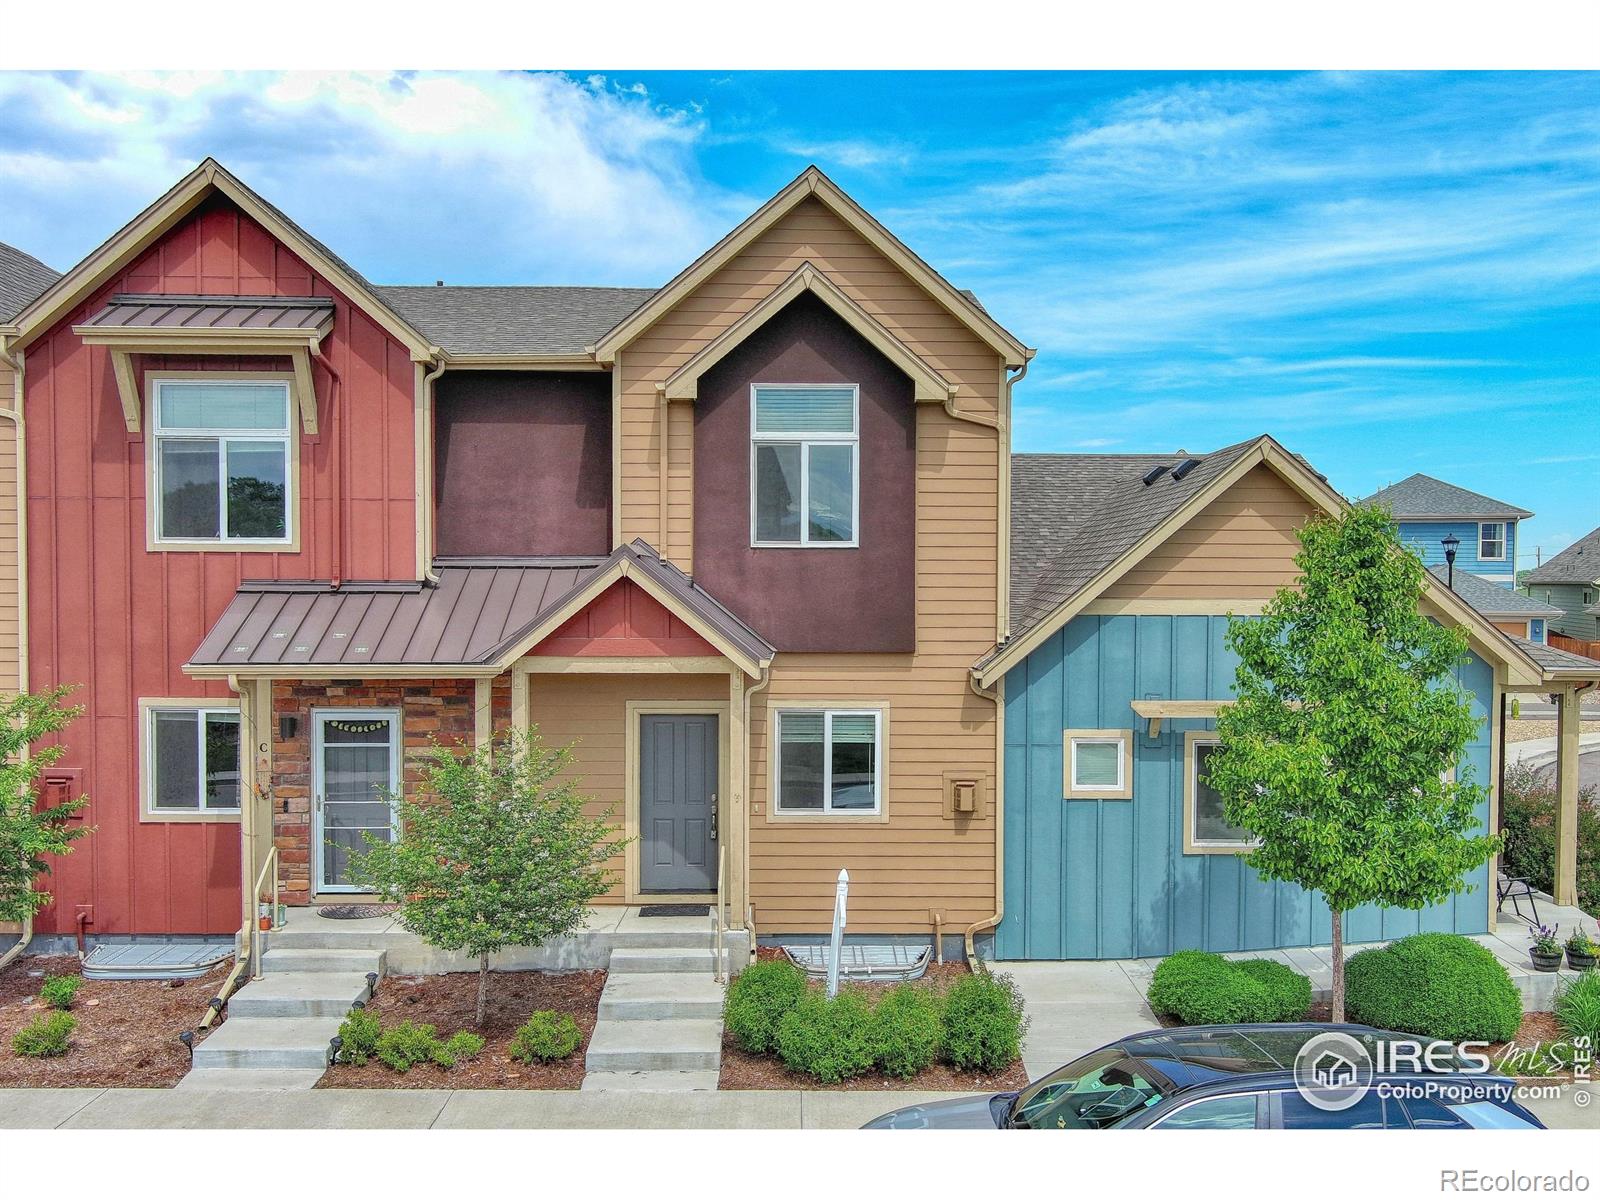
Active
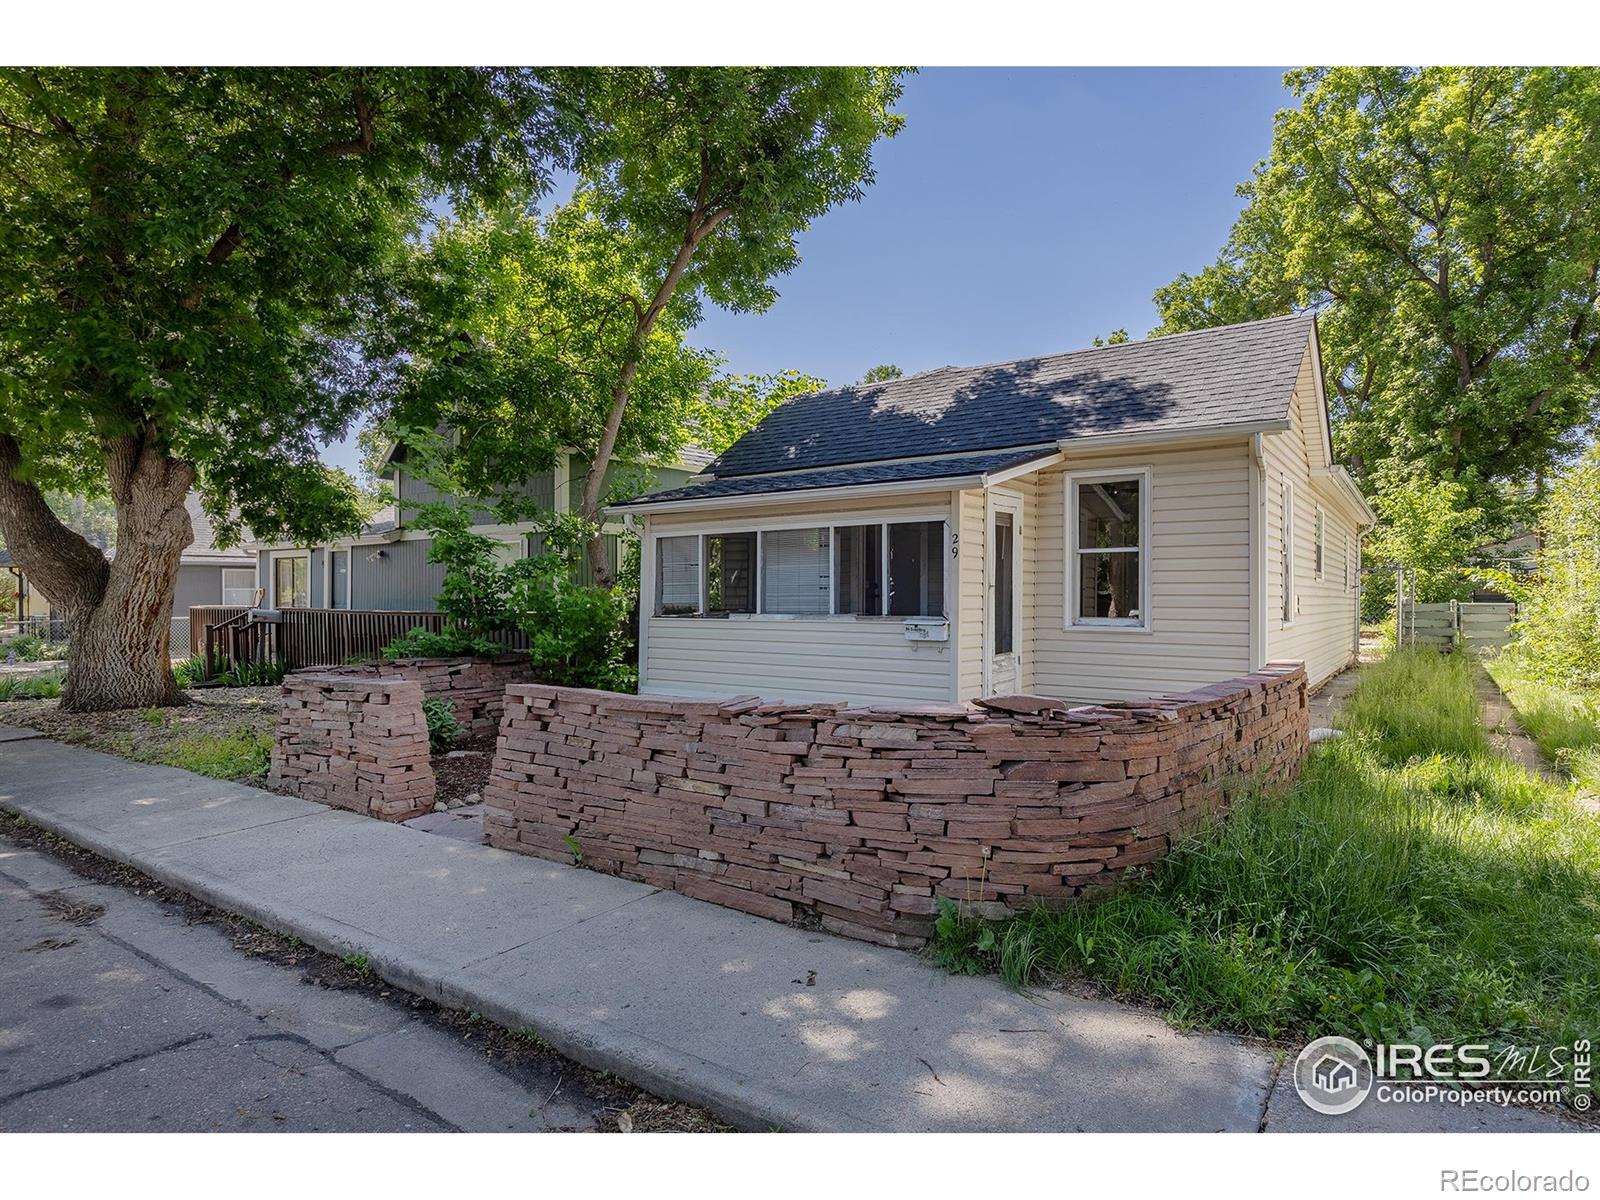
$388,999
2
bds
|
1
ba
|
760
sqft
|
built
1918
29 Marshall Pl, Longmont, CO 80504
$-798
Cash flow
-10.7%
Cash-on-Cash Return
3.8%
Cap rate
0.5%
Rent to Value Ratio
301 out of 320 properties for sale in Longmont, CO
Limited Results Shown
Create a free account, or log in to reveal all property listings and enjoy the complete experience.
Active
$2,800,000
3
bds
|
2
ba
|
2,460
sqft
|
built
1999
2832 County Road 20, Longmont, CO 80504
$-11,023
Cash flow
-20.5%
Cash-on-Cash Return
1.6%
Cap rate
0.2%
Rent to Value Ratio
Active
$1,097,450
4
bds
|
4
ba
|
3,929
sqft
|
built
2008
1025 Neon Forest Cir, Longmont, CO 80504
$-4,338
Cash flow
-20.6%
Cash-on-Cash Return
1.5%
Cap rate
0.3%
Rent to Value Ratio
Active
$2,500,000
3
bds
|
1
ba
|
1,400
sqft
|
built
1947
12027 Saint Vrain Rd, Longmont, CO 80504
$-10,569
Cash flow
-22.1%
Cash-on-Cash Return
1.2%
Cap rate
0.2%
Rent to Value Ratio
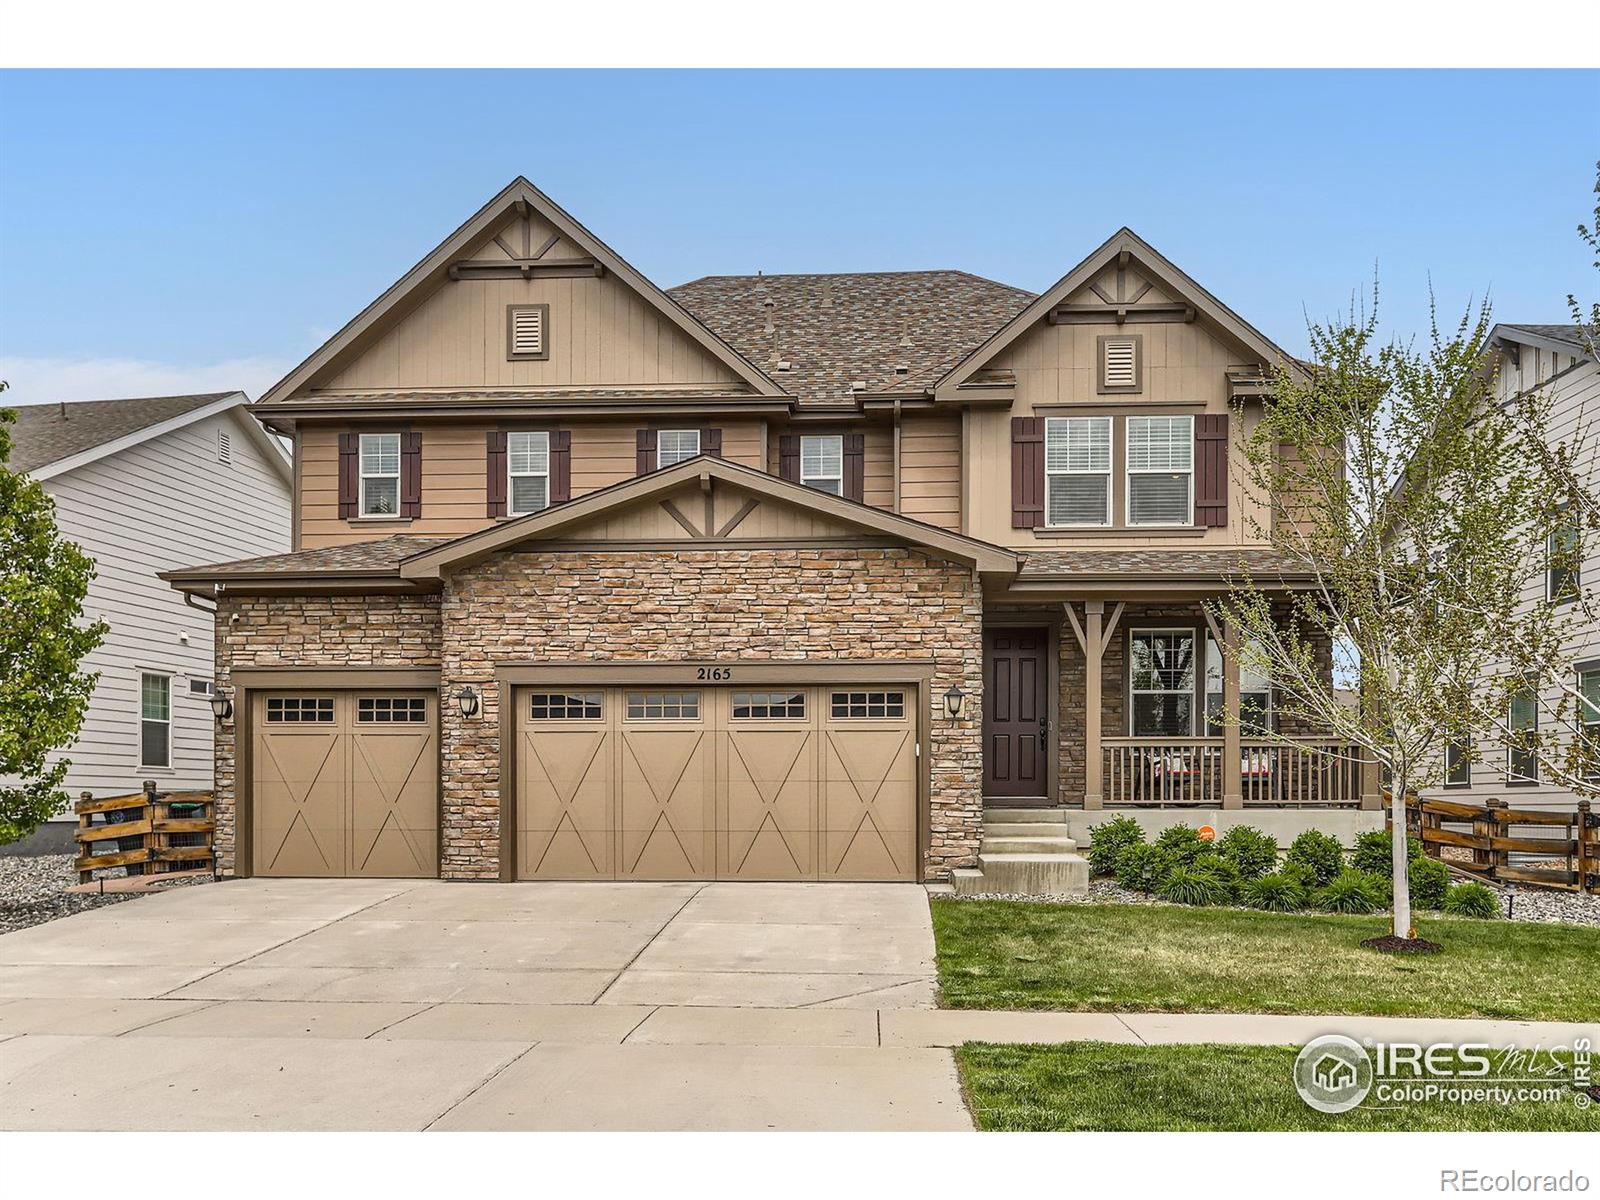
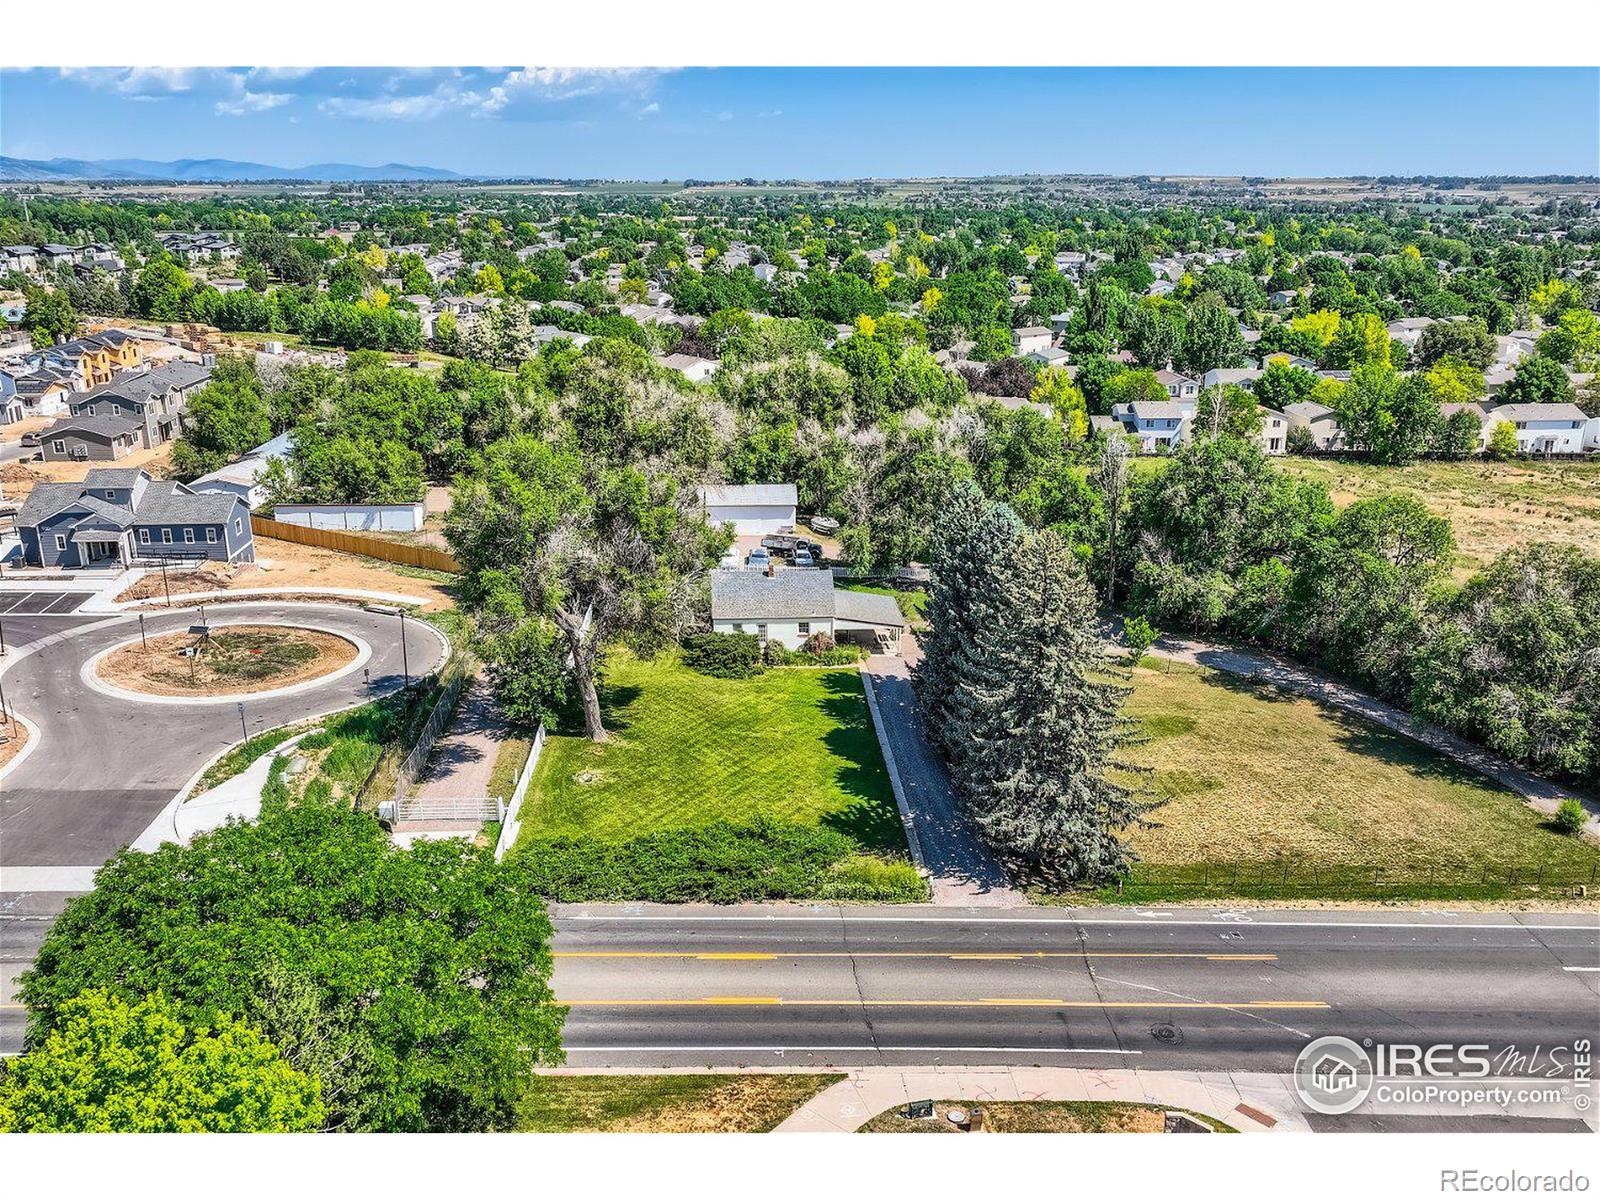
Active
$1,475,000
5
bds
|
5
ba
|
5,261
sqft
|
built
2017
2165 Summerlin Ln, Longmont, CO 80503
$-5,021
Cash flow
-17.8%
Cash-on-Cash Return
2.2%
Cap rate
0.3%
Rent to Value Ratio
Active
$600,000
4
bds
|
3
ba
|
1,831
sqft
|
built
2005
2432 Tyrrhenian Dr, Longmont, CO 80504
$-1,497
Cash flow
-13.0%
Cash-on-Cash Return
3.3%
Cap rate
0.5%
Rent to Value Ratio
Active
$595,000
4
bds
|
4
ba
|
2,715
sqft
|
built
2015
671 Robert St, Longmont, CO 80503
$-1,593
Cash flow
-14.0%
Cash-on-Cash Return
3.1%
Cap rate
0.5%
Rent to Value Ratio
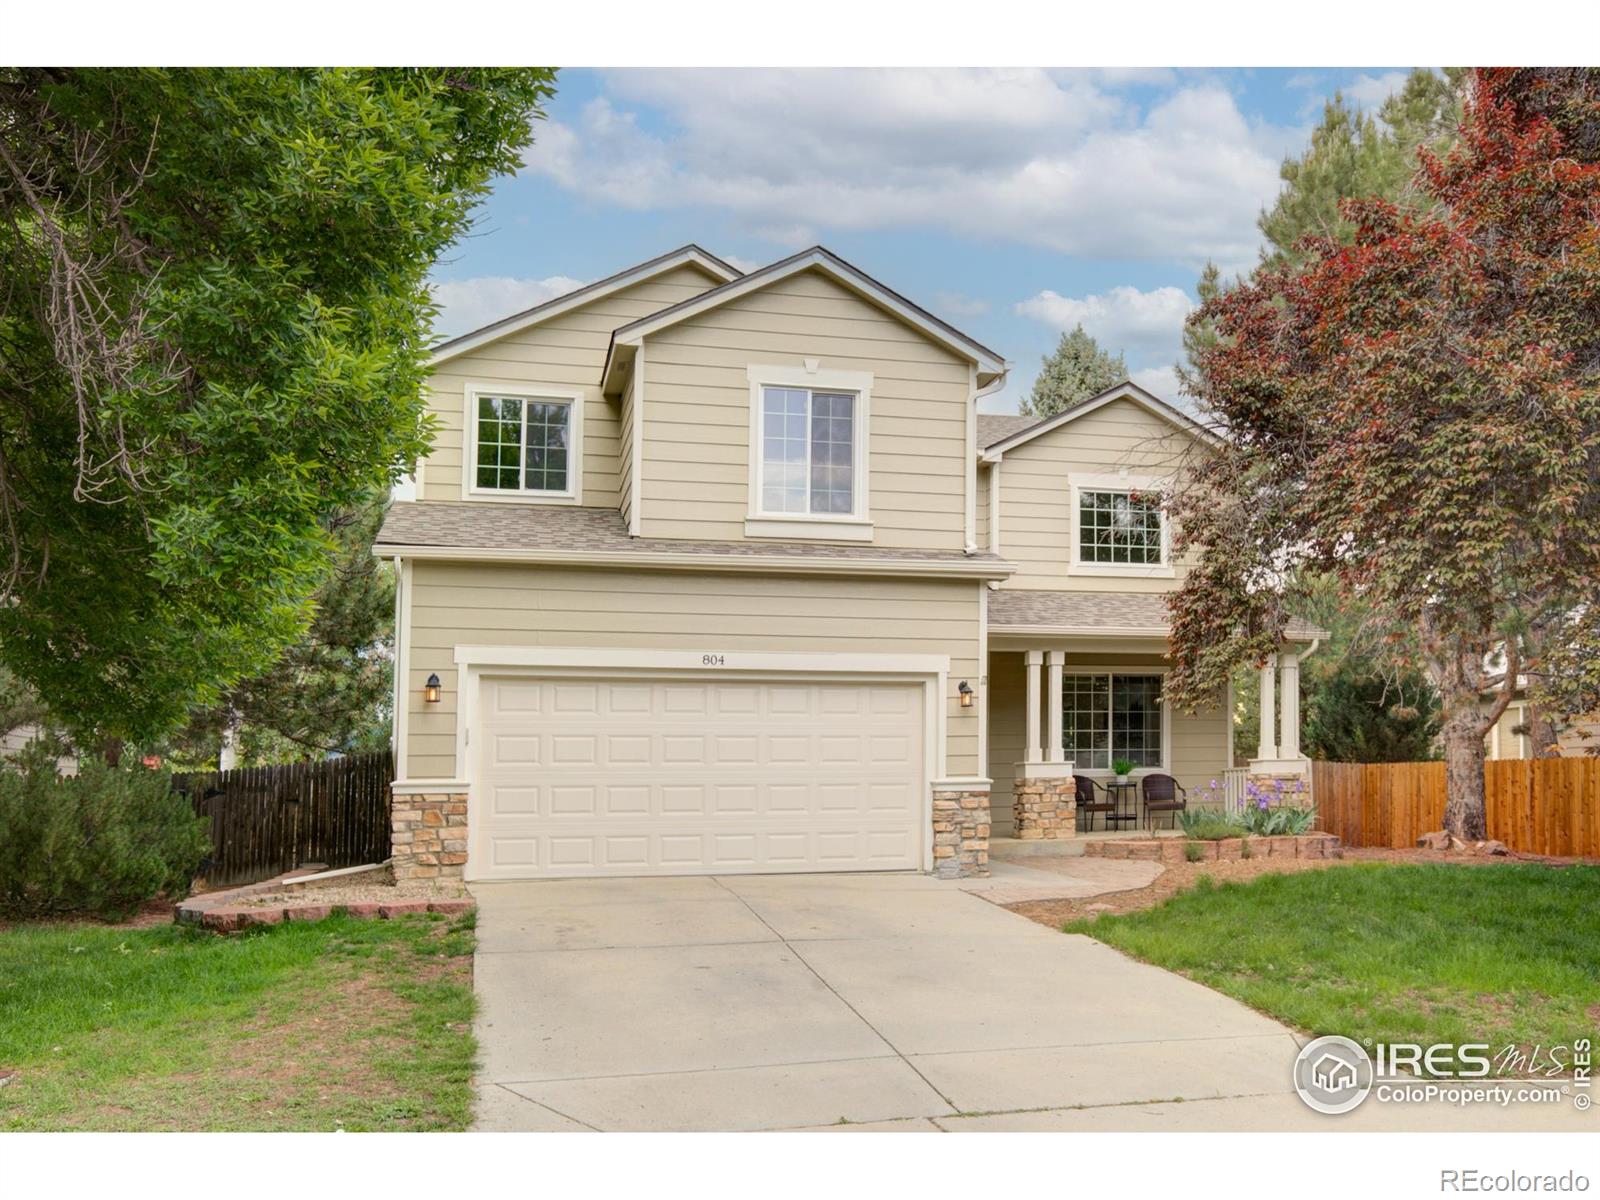
Active
$649,000
4
bds
|
4
ba
|
2,481
sqft
|
built
1995
804 Nelson Park Ln, Longmont, CO 80503
$-1,611
Cash flow
-13.0%
Cash-on-Cash Return
3.3%
Cap rate
0.5%
Rent to Value Ratio
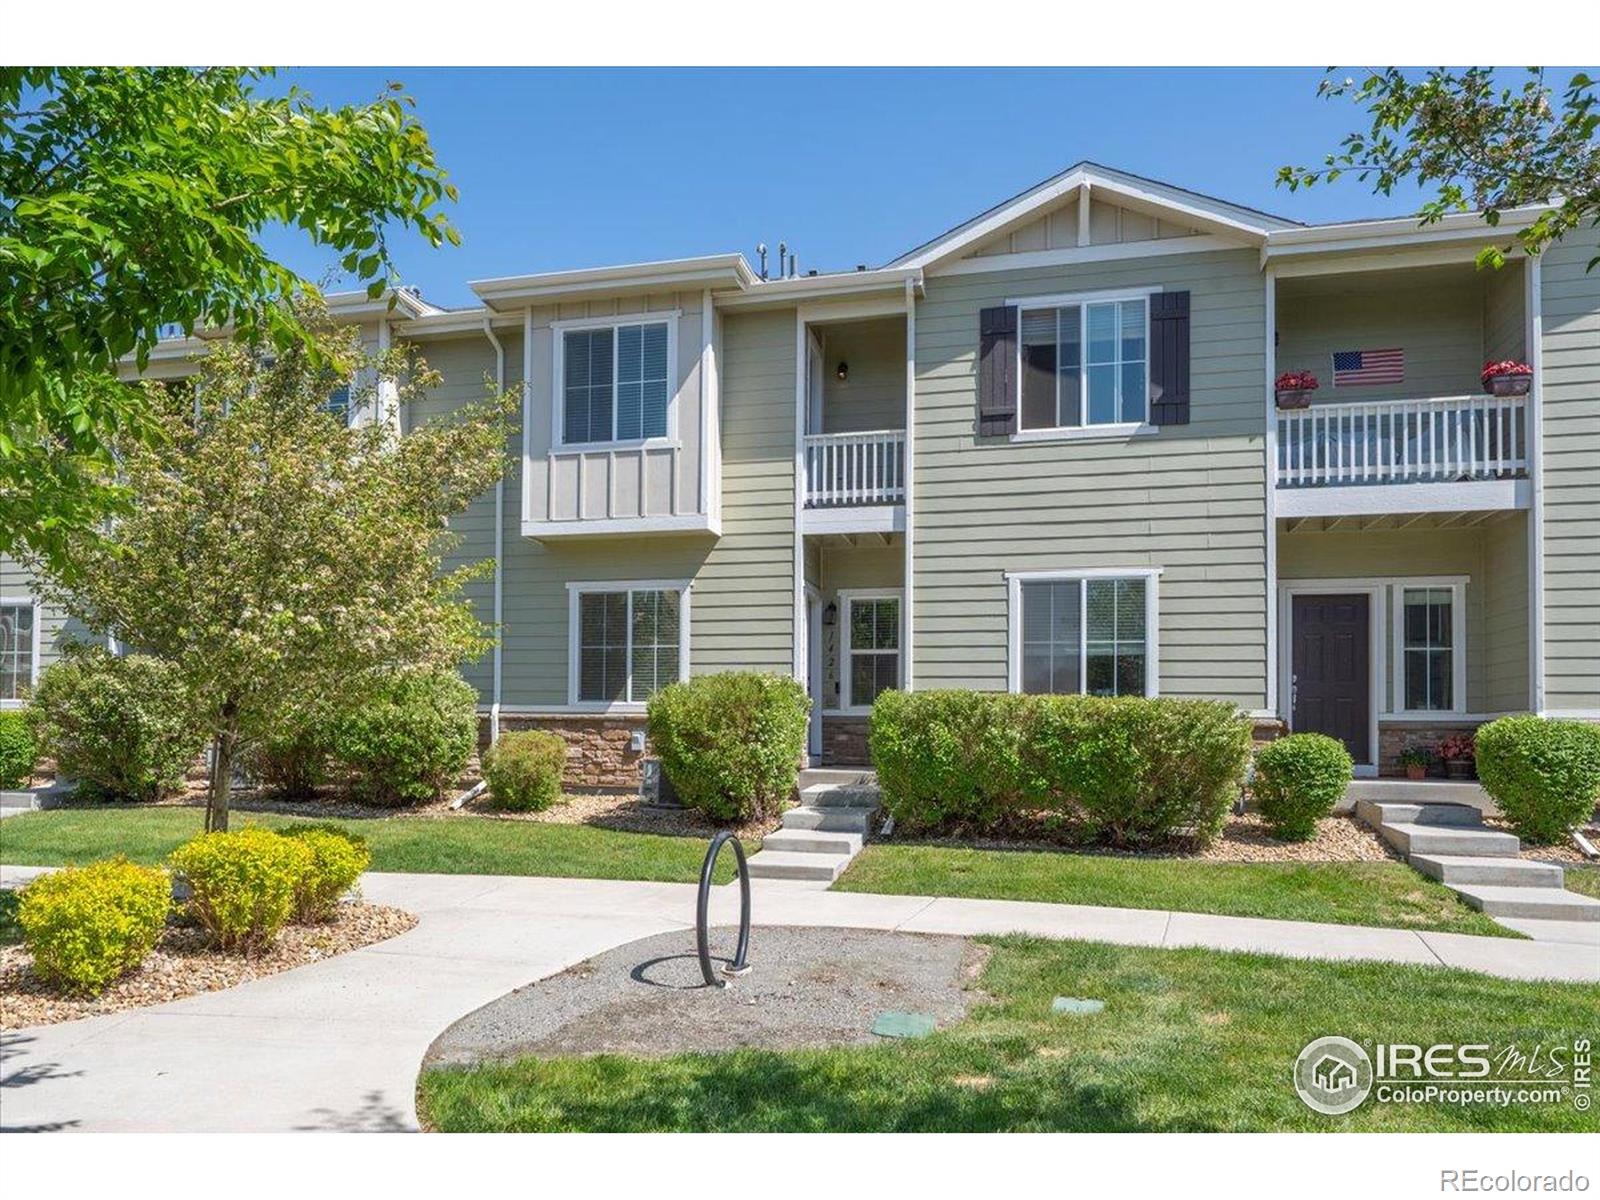
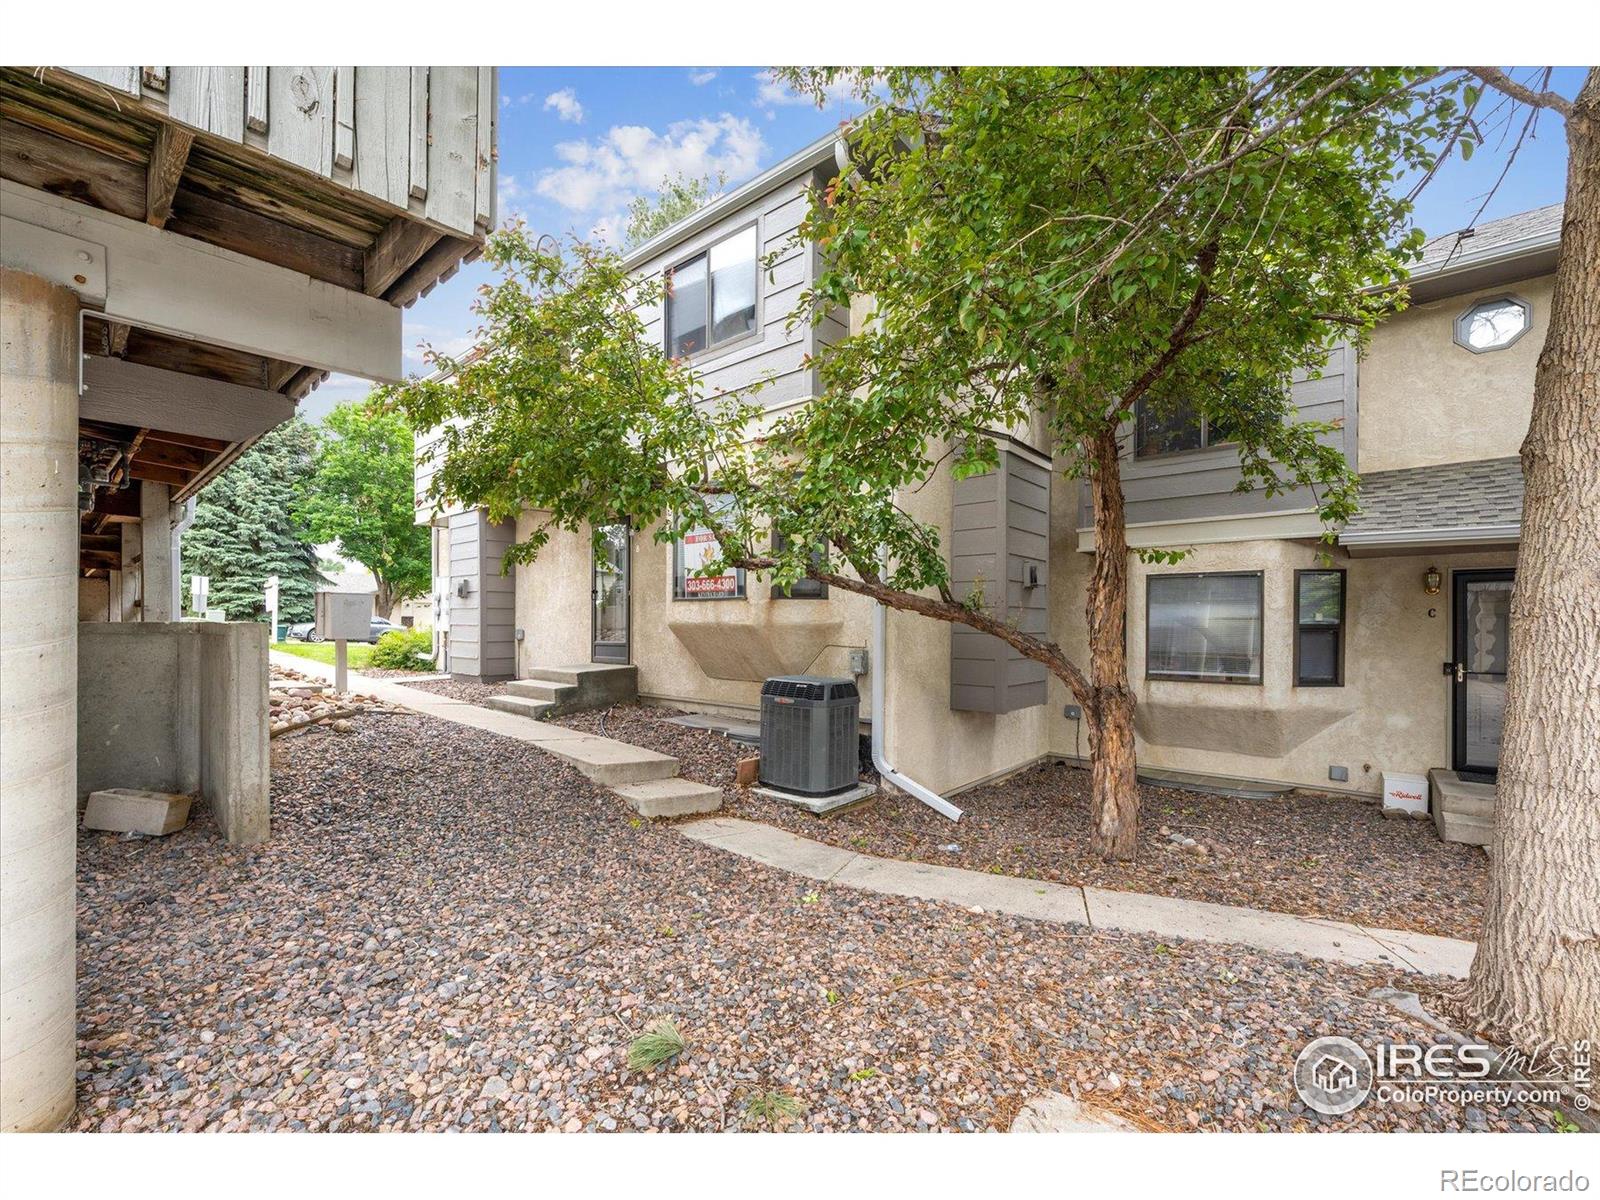
Active
$415,000
2
bds
|
3
ba
|
1,385
sqft
|
built
2018
1426 Sepia Ave, Longmont, CO 80501
$-1,411
Cash flow
-17.7%
Cash-on-Cash Return
2.2%
Cap rate
0.5%
Rent to Value Ratio
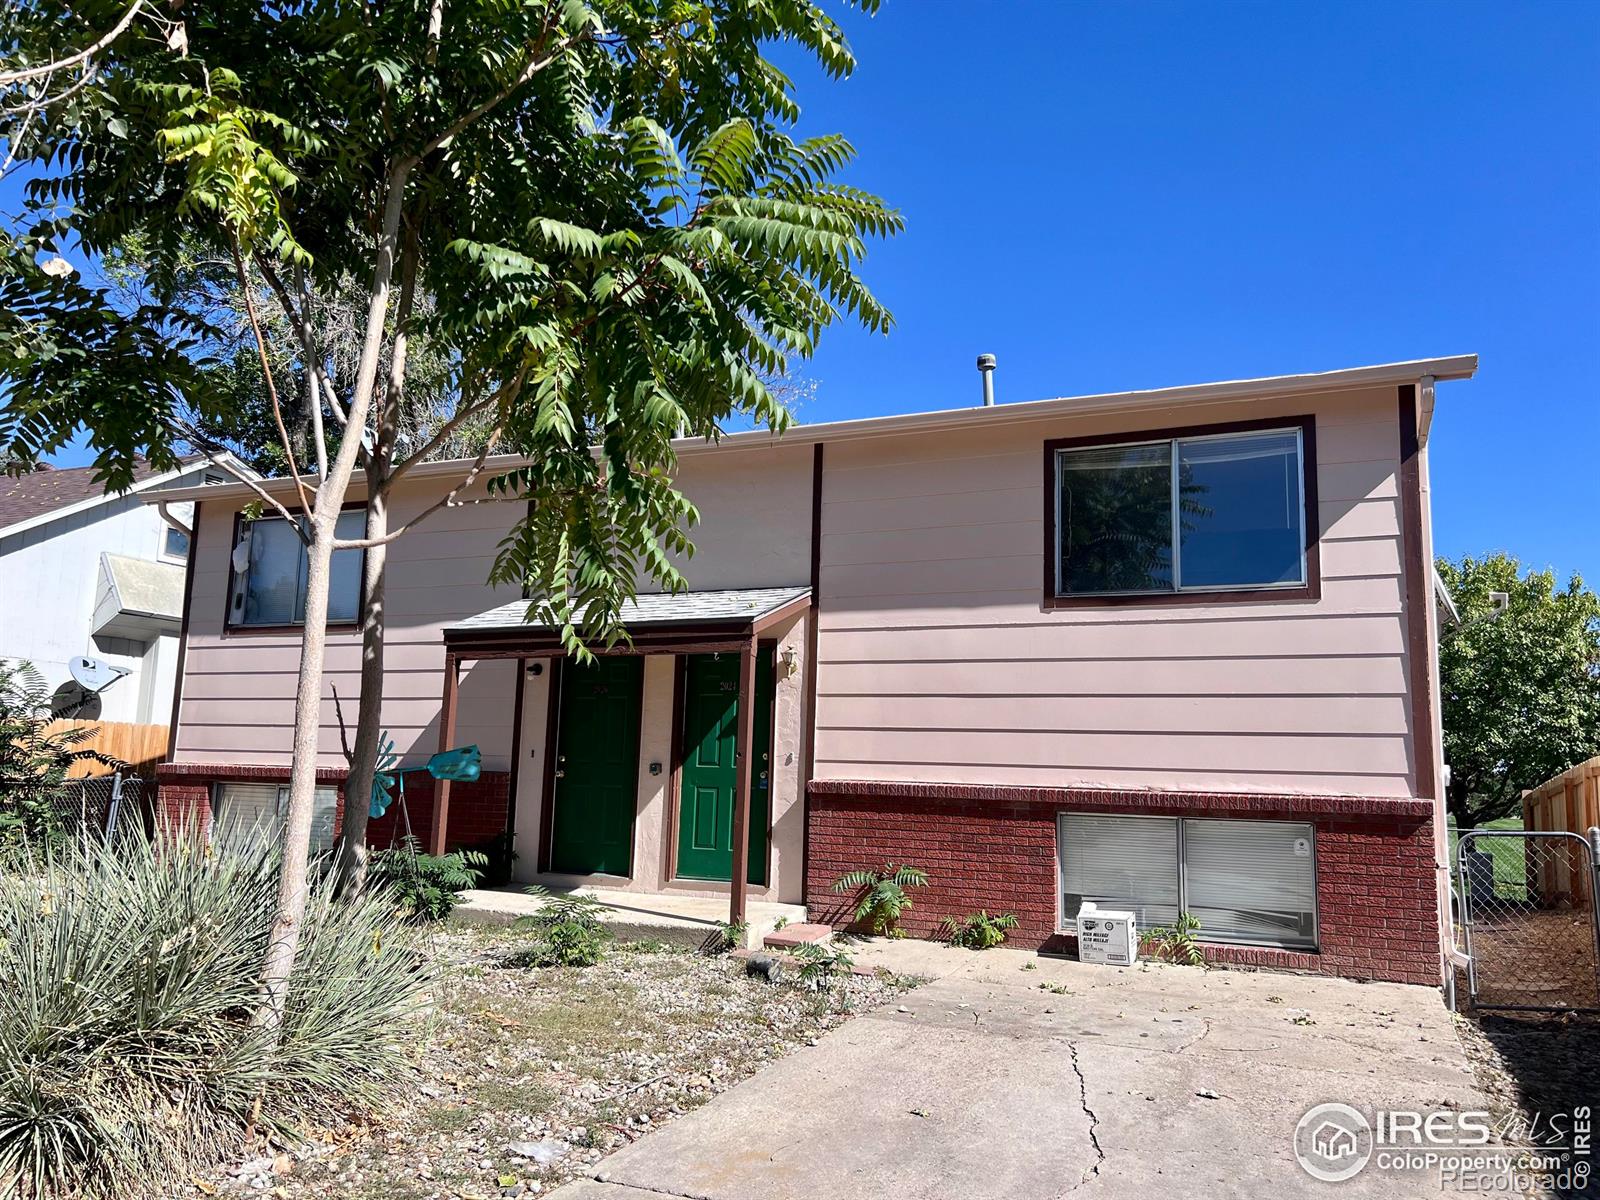
Active under contract
$450,000
4
bds
|
0
ba
|
0
sqft
|
built
1979
2024 Lincoln St, Longmont, CO 80501
$-977
Cash flow
-11.3%
Cash-on-Cash Return
3.7%
Cap rate
0.4%
Rent to Value Ratio
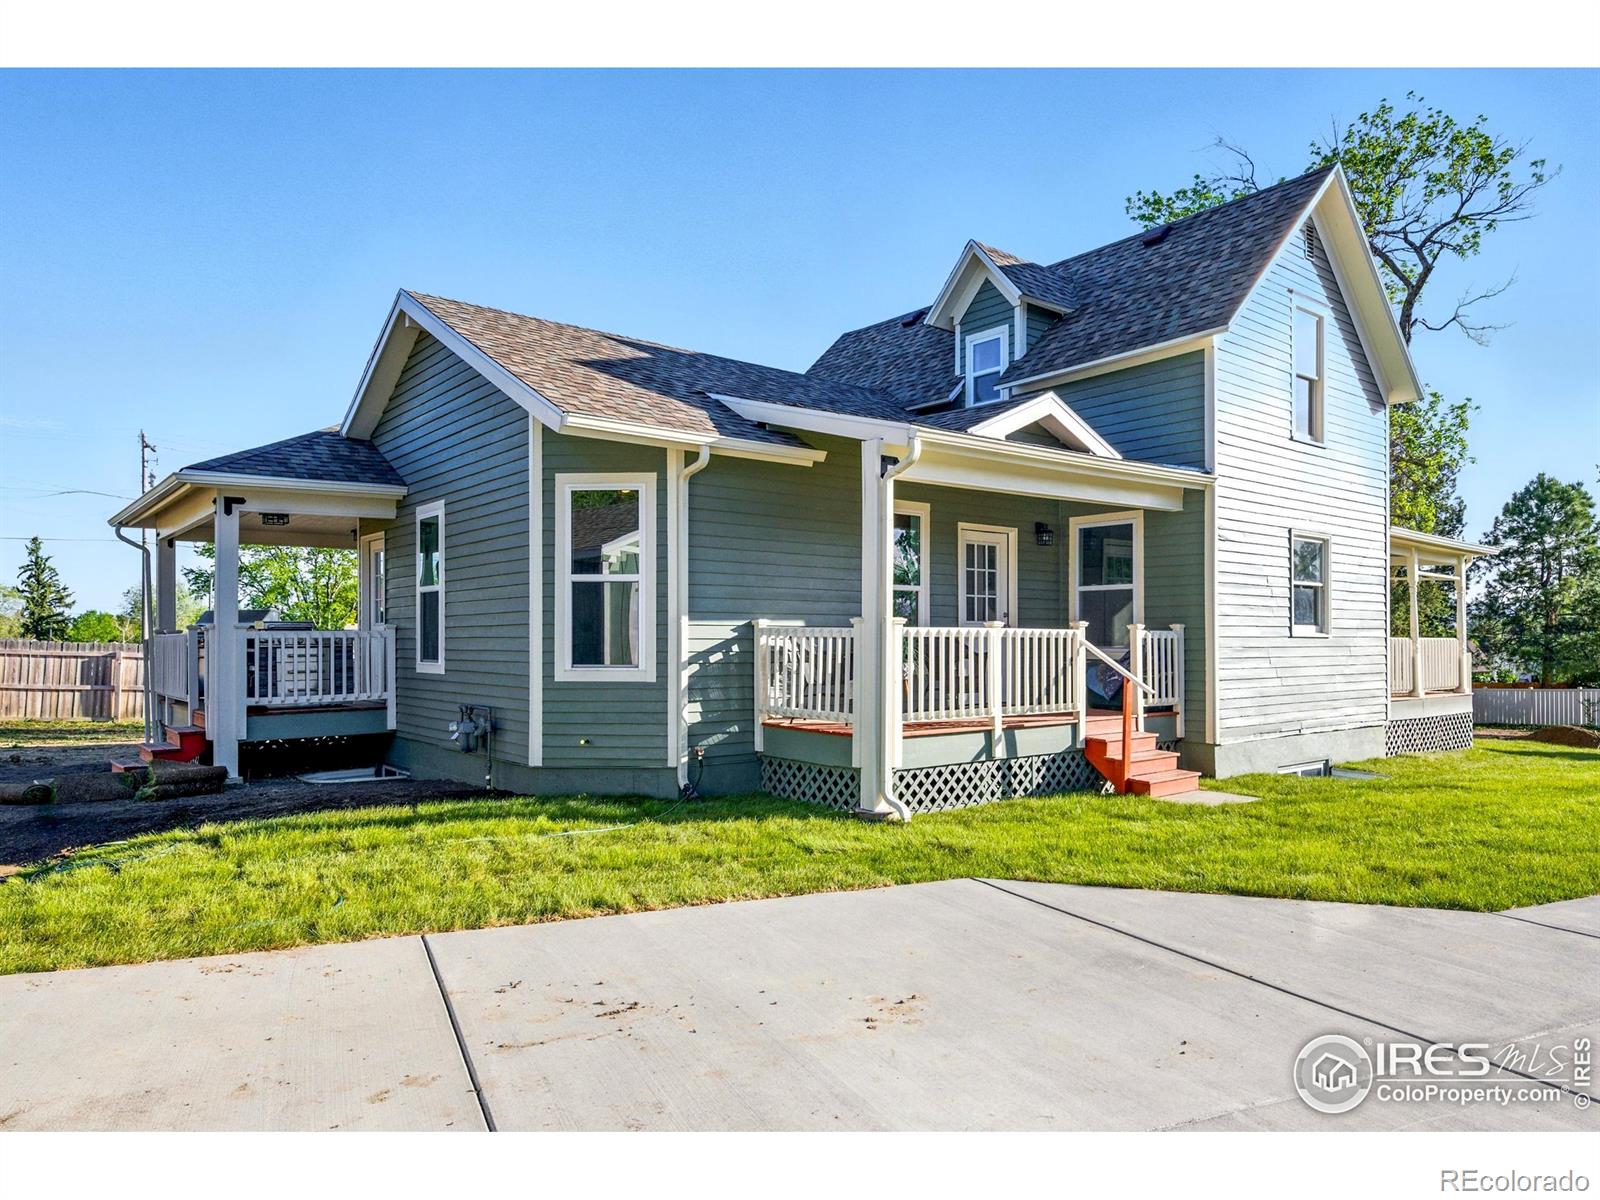
Active
$799,000
4
bds
|
4
ba
|
2,687
sqft
|
built
1910
1711 Antero Dr, Longmont, CO 80504
$-2,796
Cash flow
-18.3%
Cash-on-Cash Return
2.1%
Cap rate
0.3%
Rent to Value Ratio
Active
$430,000
4
bds
|
4
ba
|
1,784
sqft
|
built
1998
1419 Red Mountain Dr, Longmont, CO 80504
$-1,211
Cash flow
-14.7%
Cash-on-Cash Return
2.9%
Cap rate
0.5%
Rent to Value Ratio
Active
$1,150,000
3
bds
|
2
ba
|
1,280
sqft
|
built
1900
13183 N 95th St, Longmont, CO 80504
$-3,752
Cash flow
-17.0%
Cash-on-Cash Return
2.4%
Cap rate
0.3%
Rent to Value Ratio
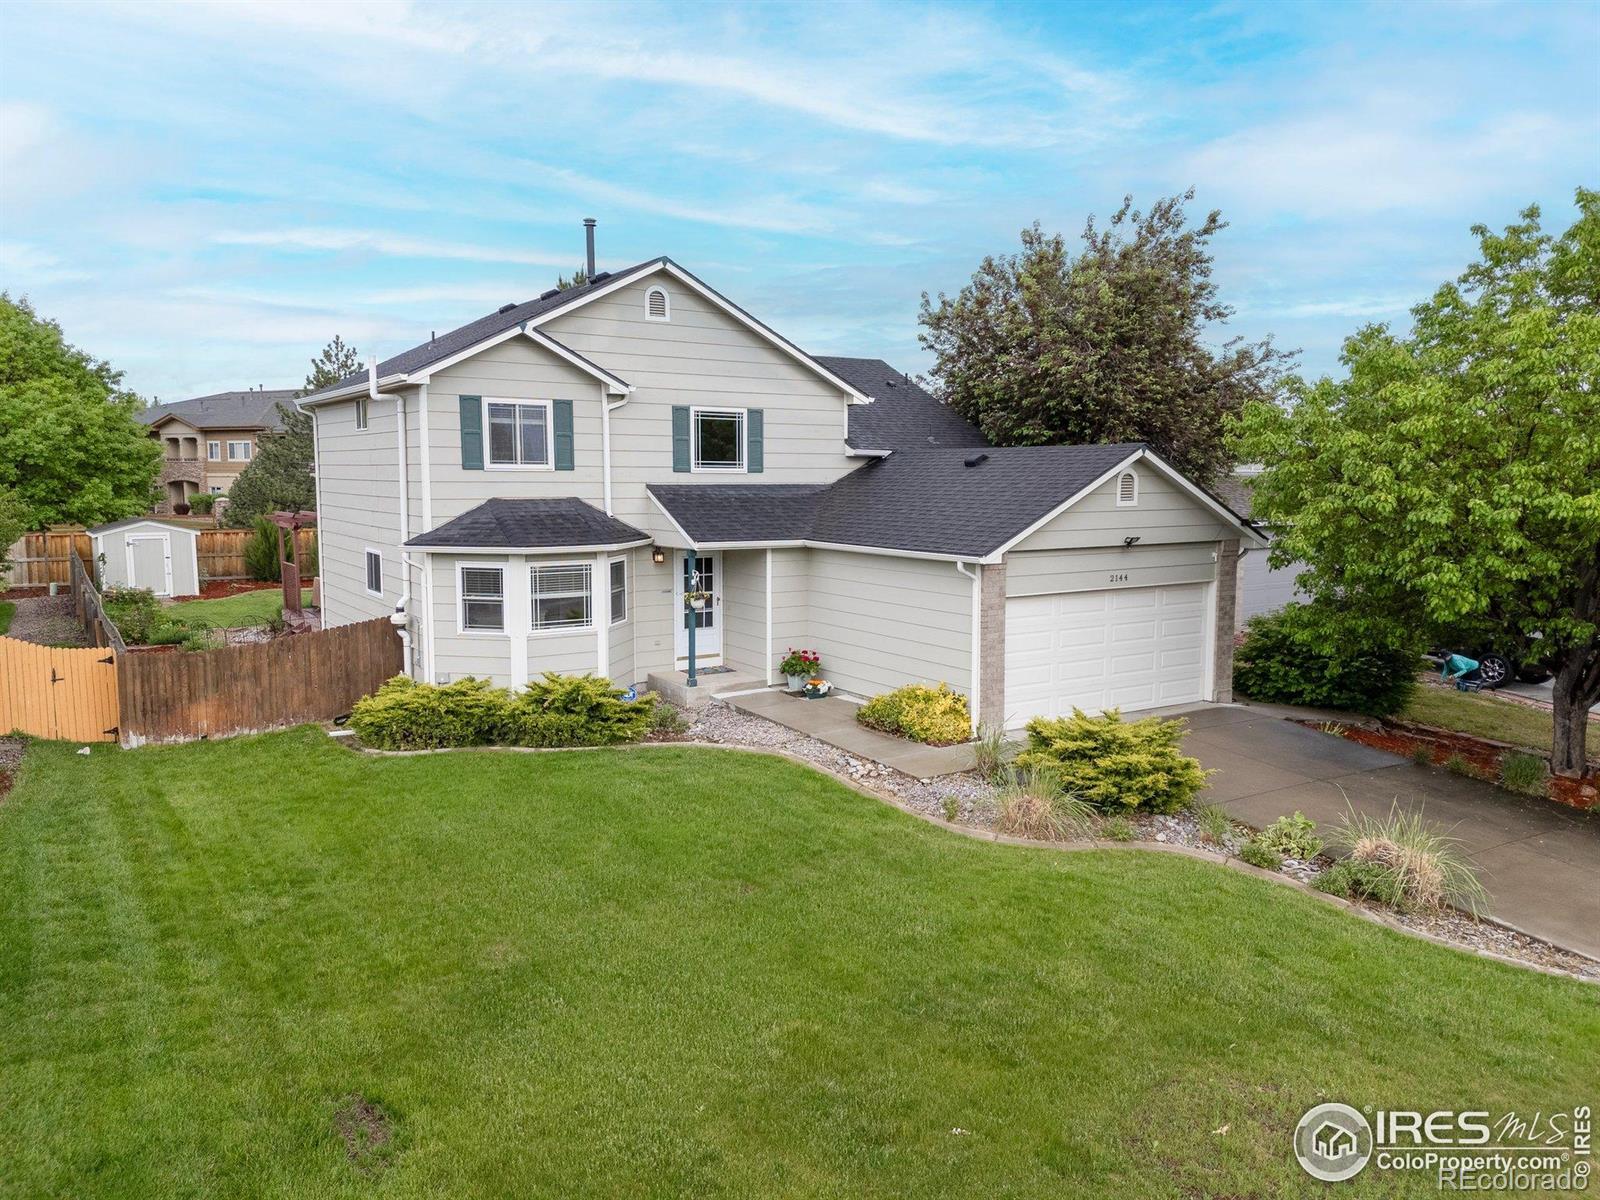
Active
$655,000
4
bds
|
4
ba
|
2,361
sqft
|
built
2002
2144 Santa Fe Dr, Longmont, CO 80504
$-1,735
Cash flow
-13.8%
Cash-on-Cash Return
3.1%
Cap rate
0.4%
Rent to Value Ratio
Active
$1,450,000
3
bds
|
3
ba
|
1,870
sqft
|
built
1949
7800 Hygiene Rd, Longmont, CO 80503
$-5,567
Cash flow
-20.0%
Cash-on-Cash Return
1.7%
Cap rate
0.2%
Rent to Value Ratio
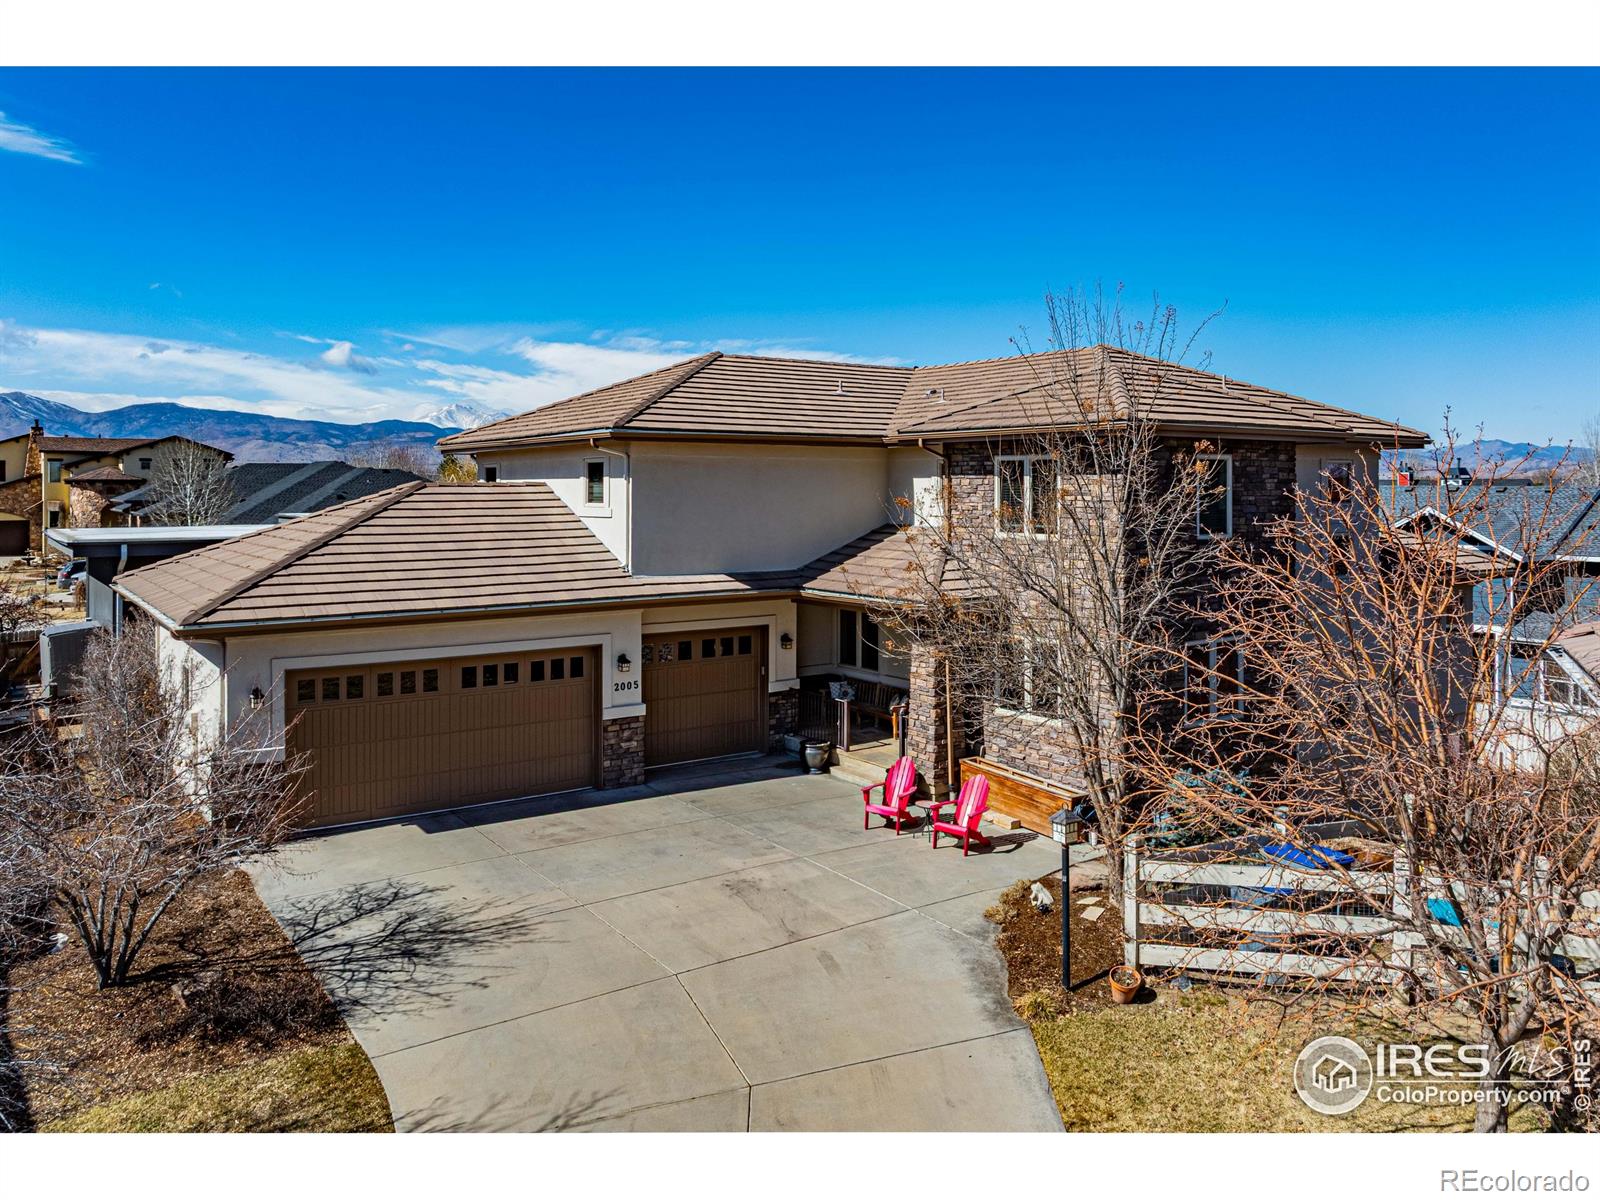
Active
$1,479,000
6
bds
|
5
ba
|
5,723
sqft
|
built
2004
2005 Calico Ct, Longmont, CO 80503
$-5,597
Cash flow
-19.7%
Cash-on-Cash Return
1.7%
Cap rate
0.3%
Rent to Value Ratio
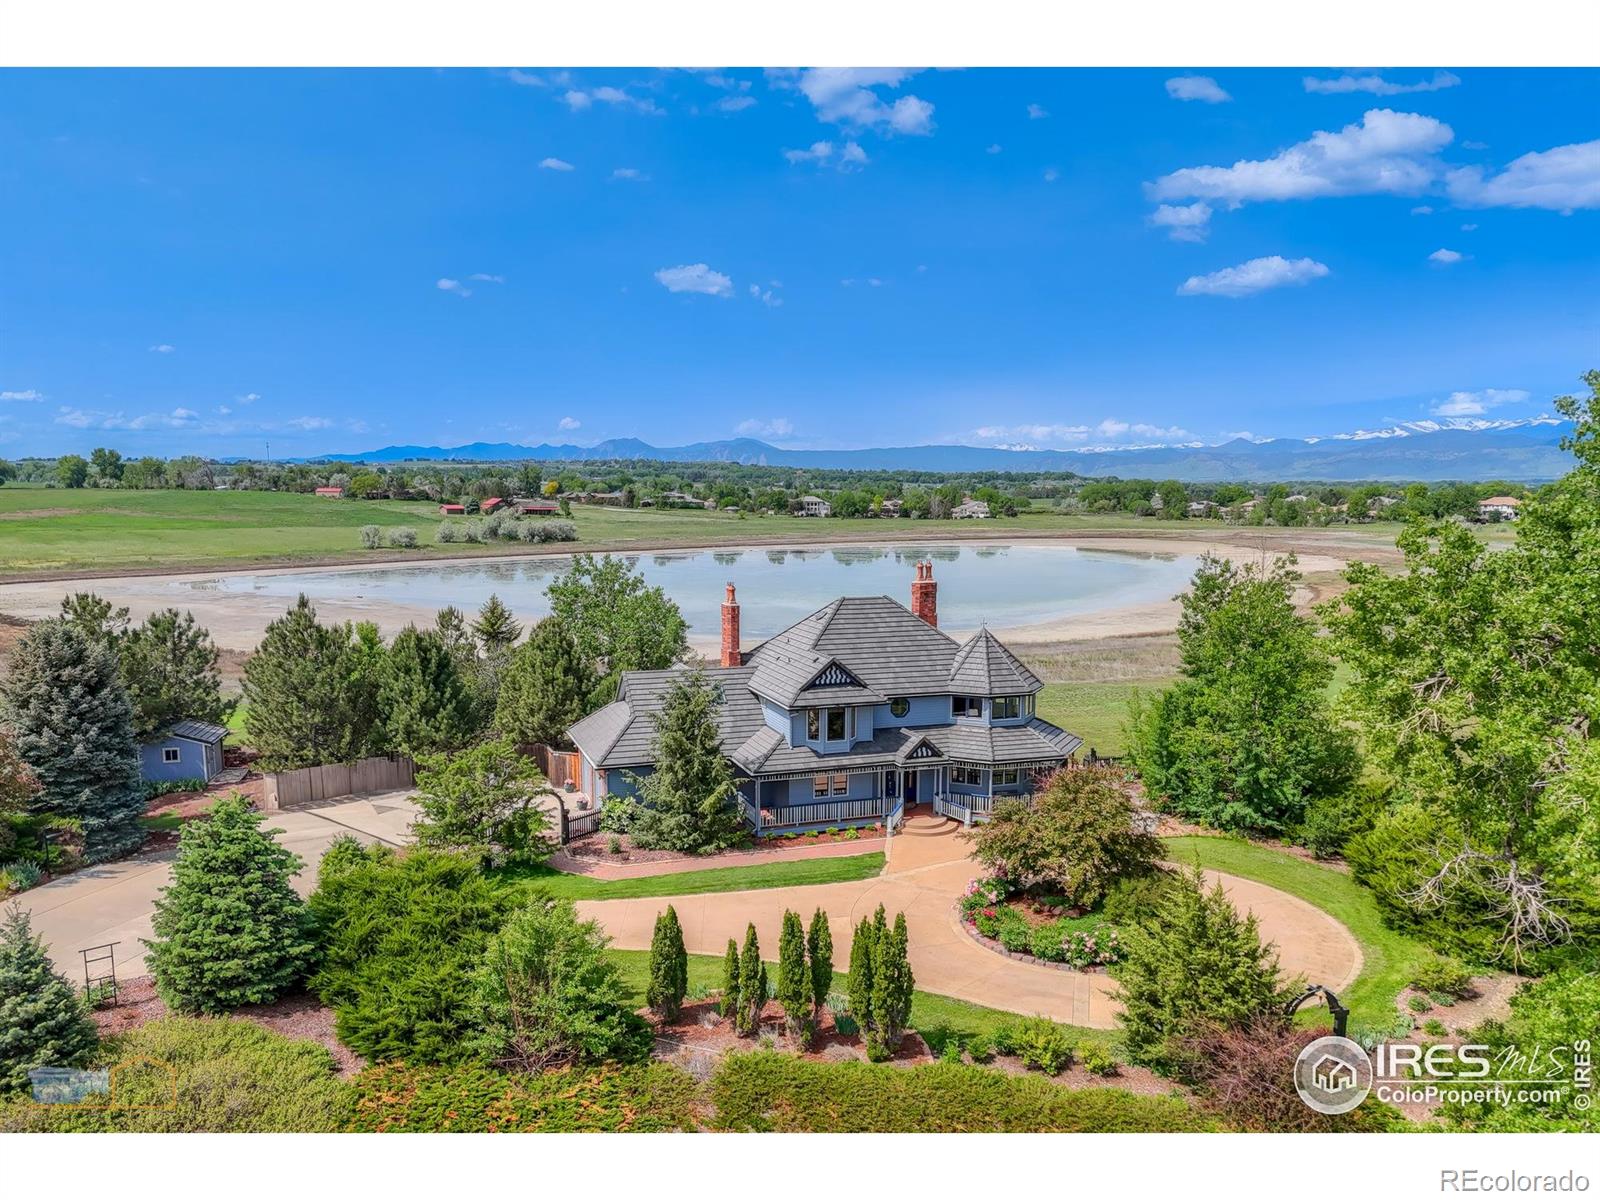
Active
$1,477,000
3
bds
|
3
ba
|
2,164
sqft
|
built
1972
8586 N 55th St, Longmont, CO 80503
$-4,616
Cash flow
-16.3%
Cash-on-Cash Return
2.5%
Cap rate
0.4%
Rent to Value Ratio
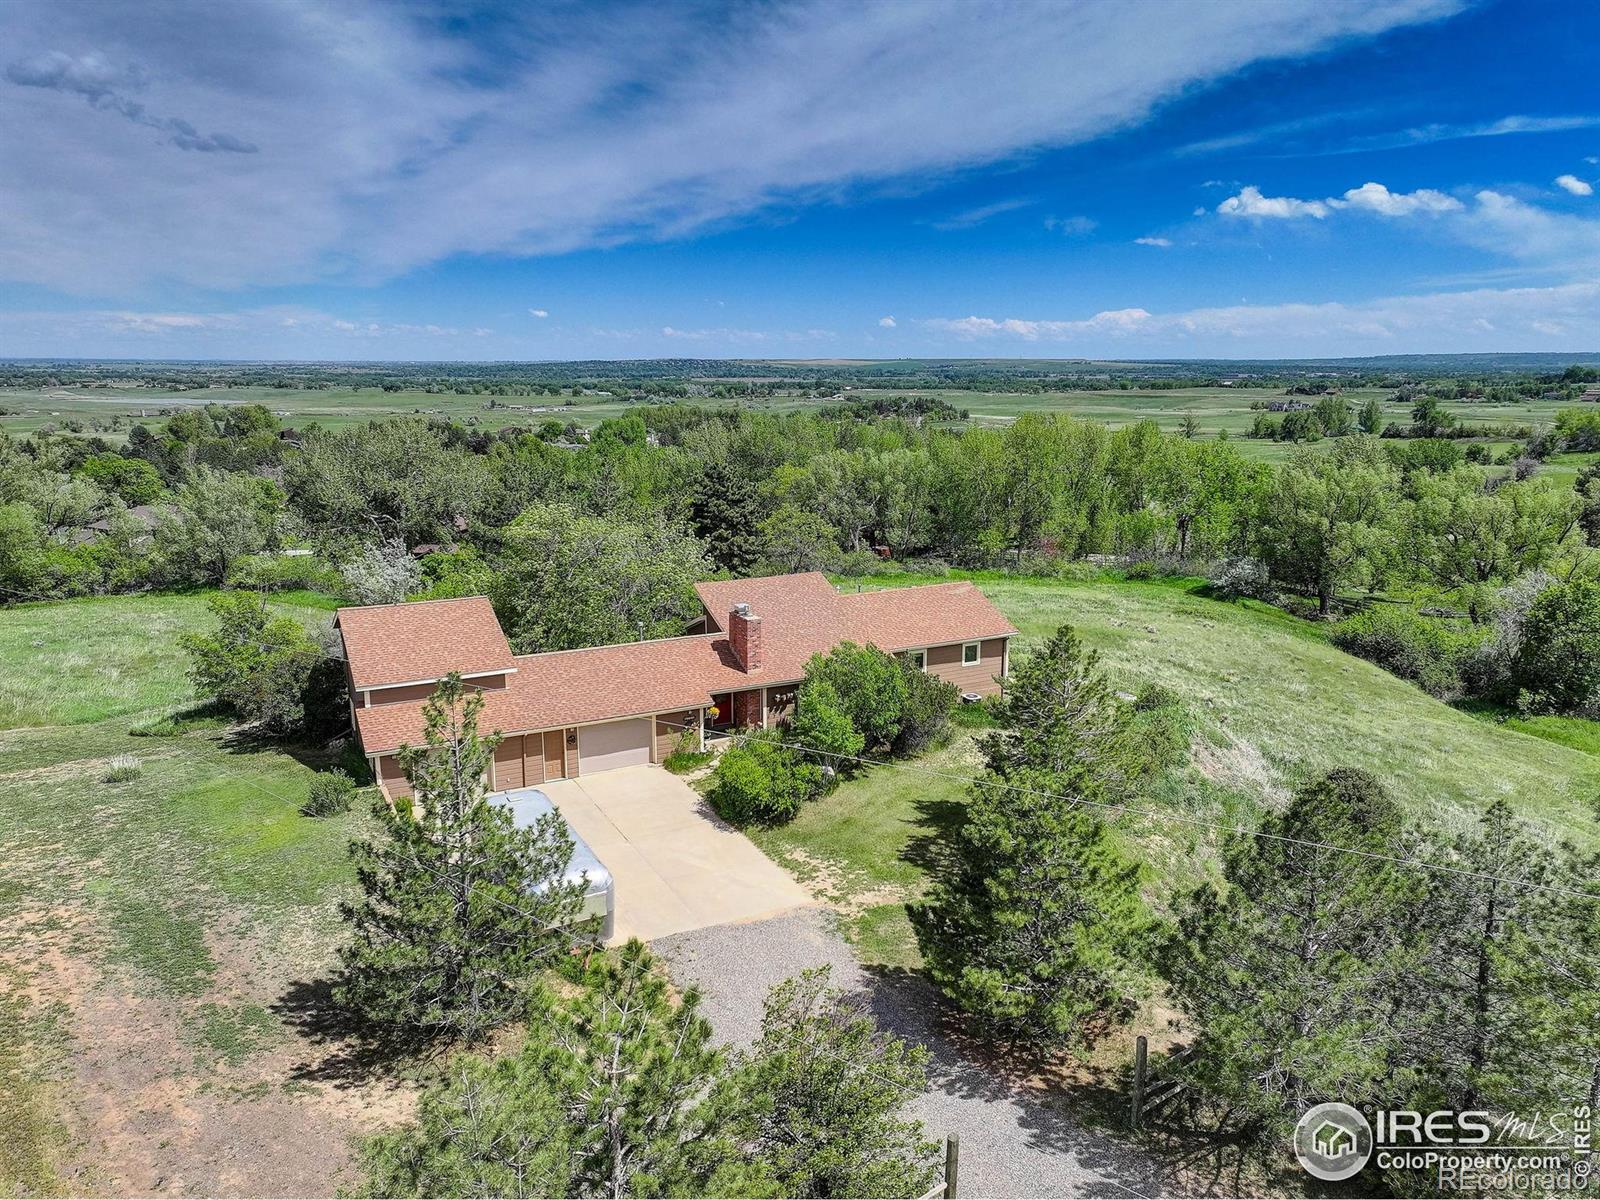
Active
$1,925,000
3
bds
|
3
ba
|
3,066
sqft
|
built
1991
7785 Darvey Ln, Longmont, CO 80504
$-8,377
Cash flow
-22.7%
Cash-on-Cash Return
1.1%
Cap rate
0.2%
Rent to Value Ratio
Active under contract
$1,200,000
6
bds
|
4
ba
|
4,300
sqft
|
built
1996
2133 Indian Peaks Cir, Longmont, CO 80504
$-4,102
Cash flow
-17.8%
Cash-on-Cash Return
2.2%
Cap rate
0.3%
Rent to Value Ratio
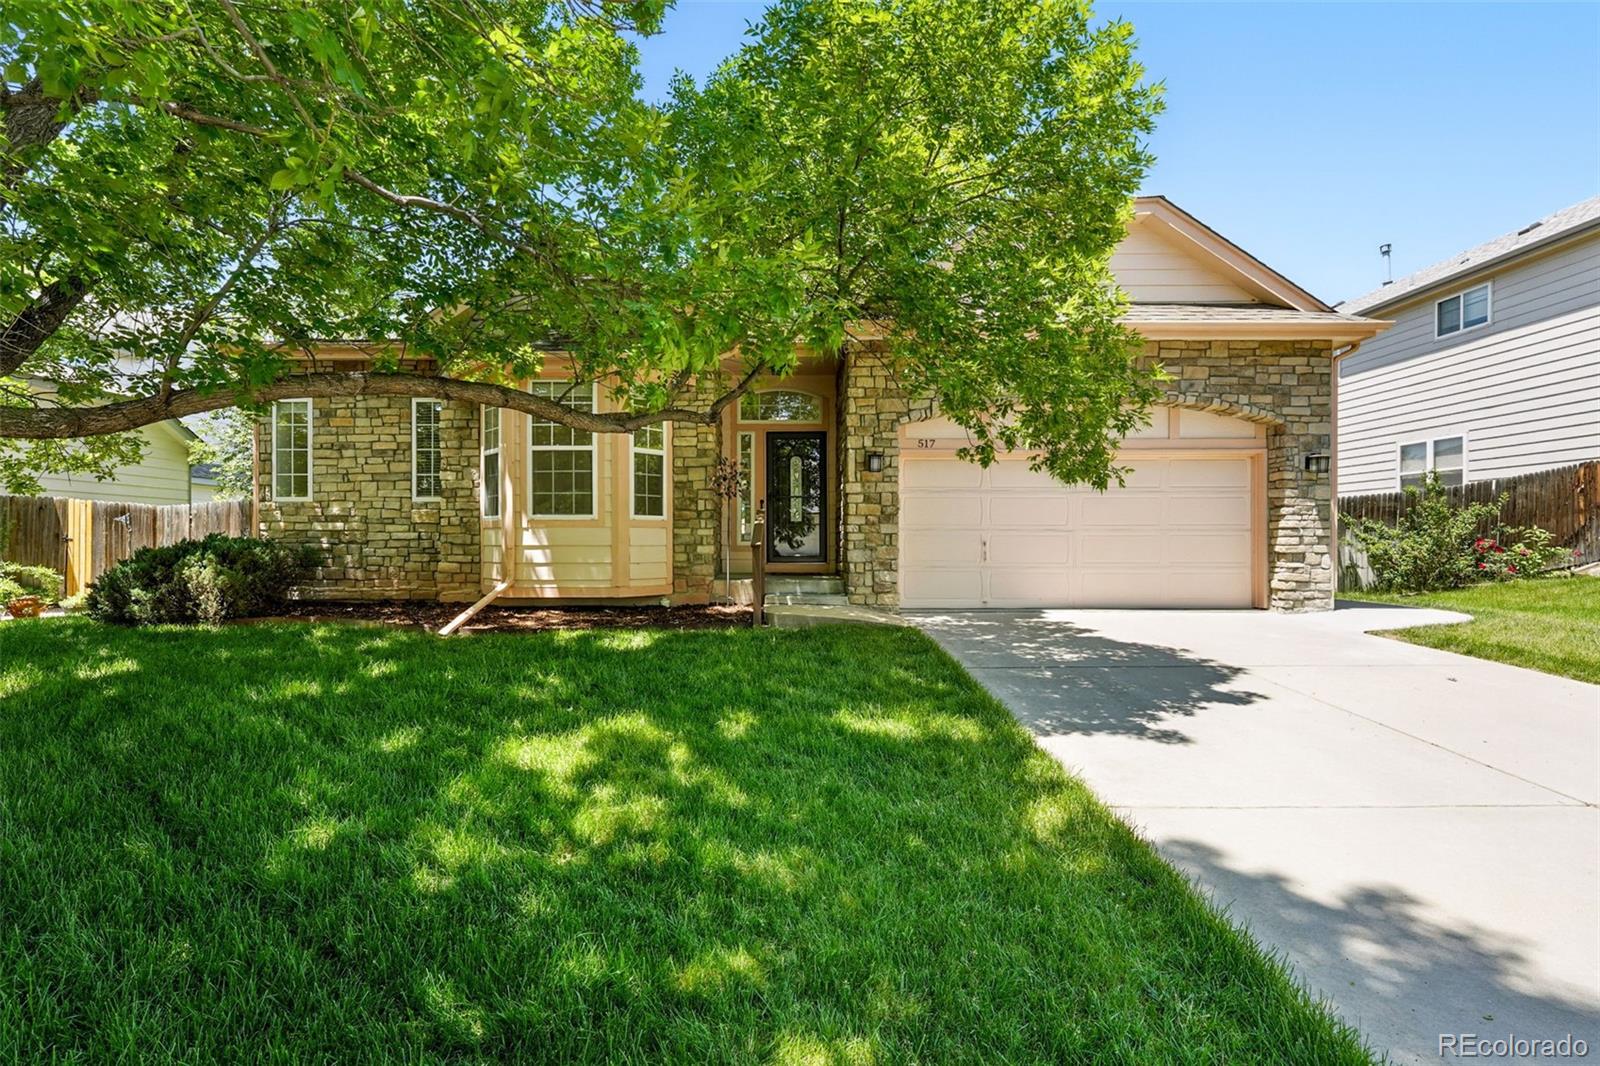
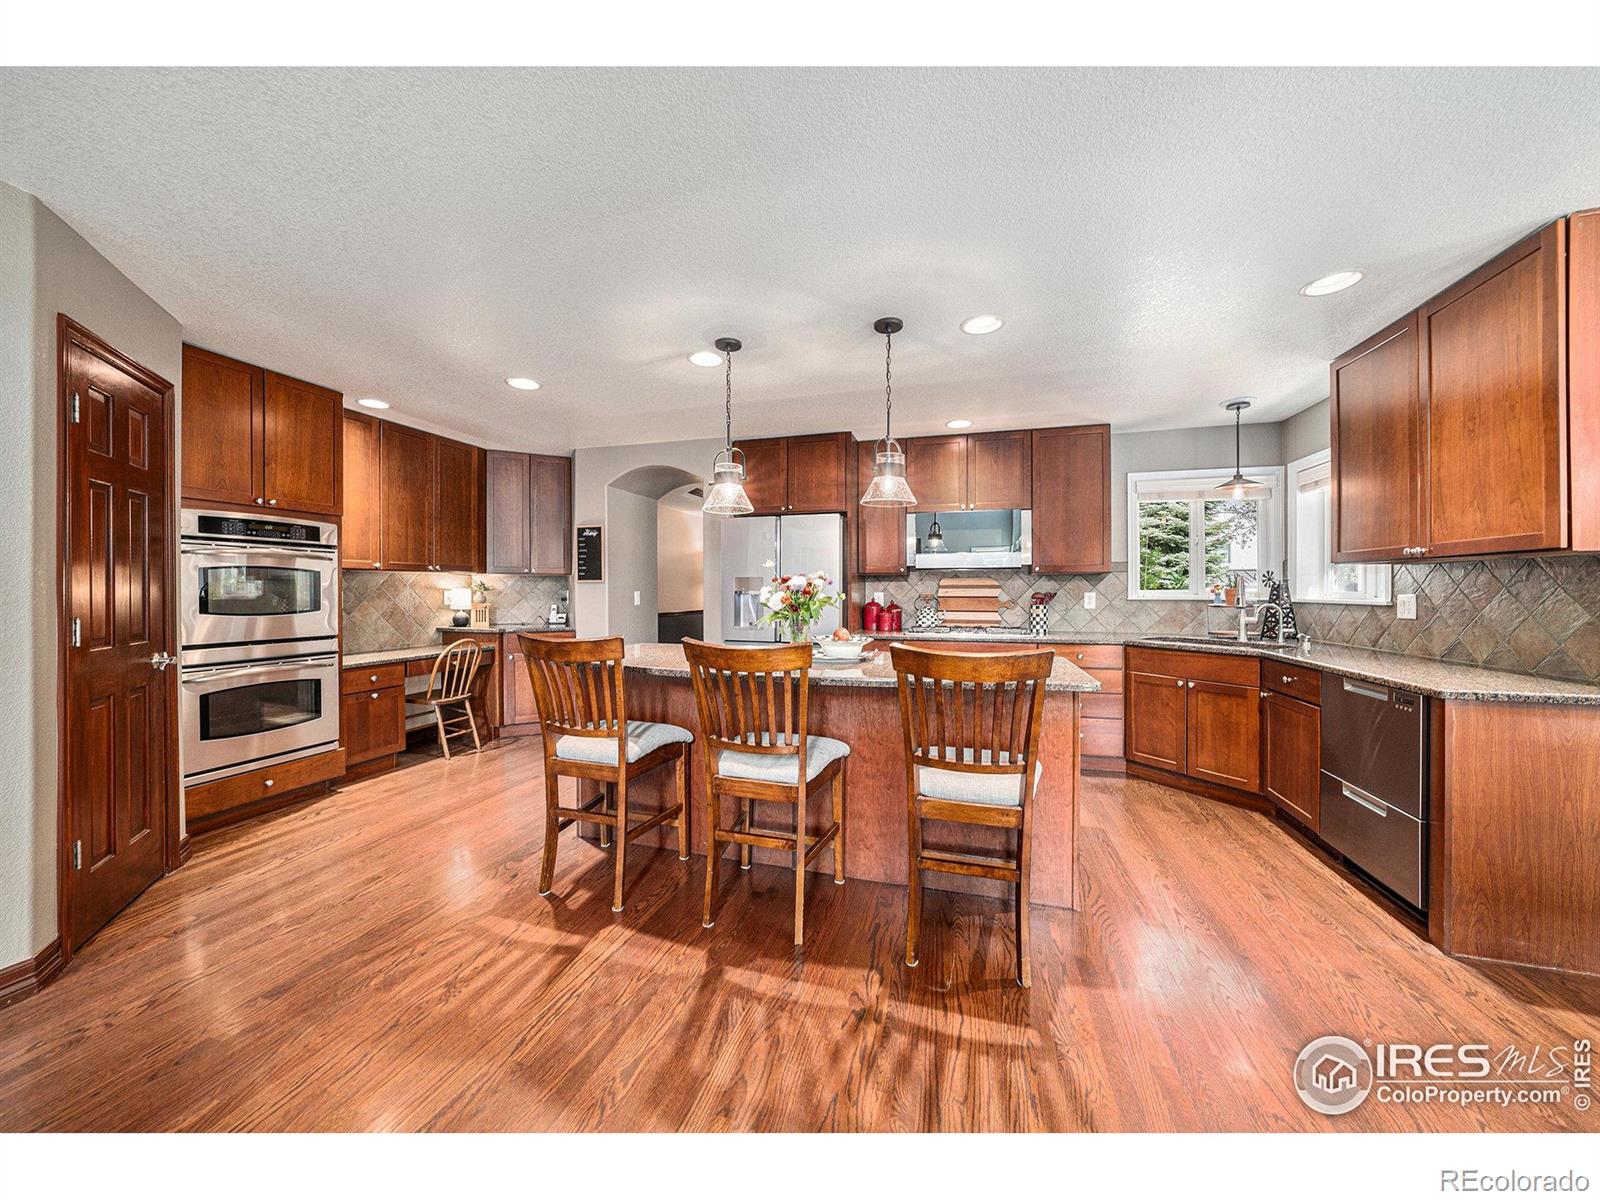
Active
$650,000
3
bds
|
4
ba
|
3,020
sqft
|
built
1994
517 Rider Ridge Dr, Longmont, CO 80504
$-1,726
Cash flow
-13.9%
Cash-on-Cash Return
3.1%
Cap rate
0.4%
Rent to Value Ratio
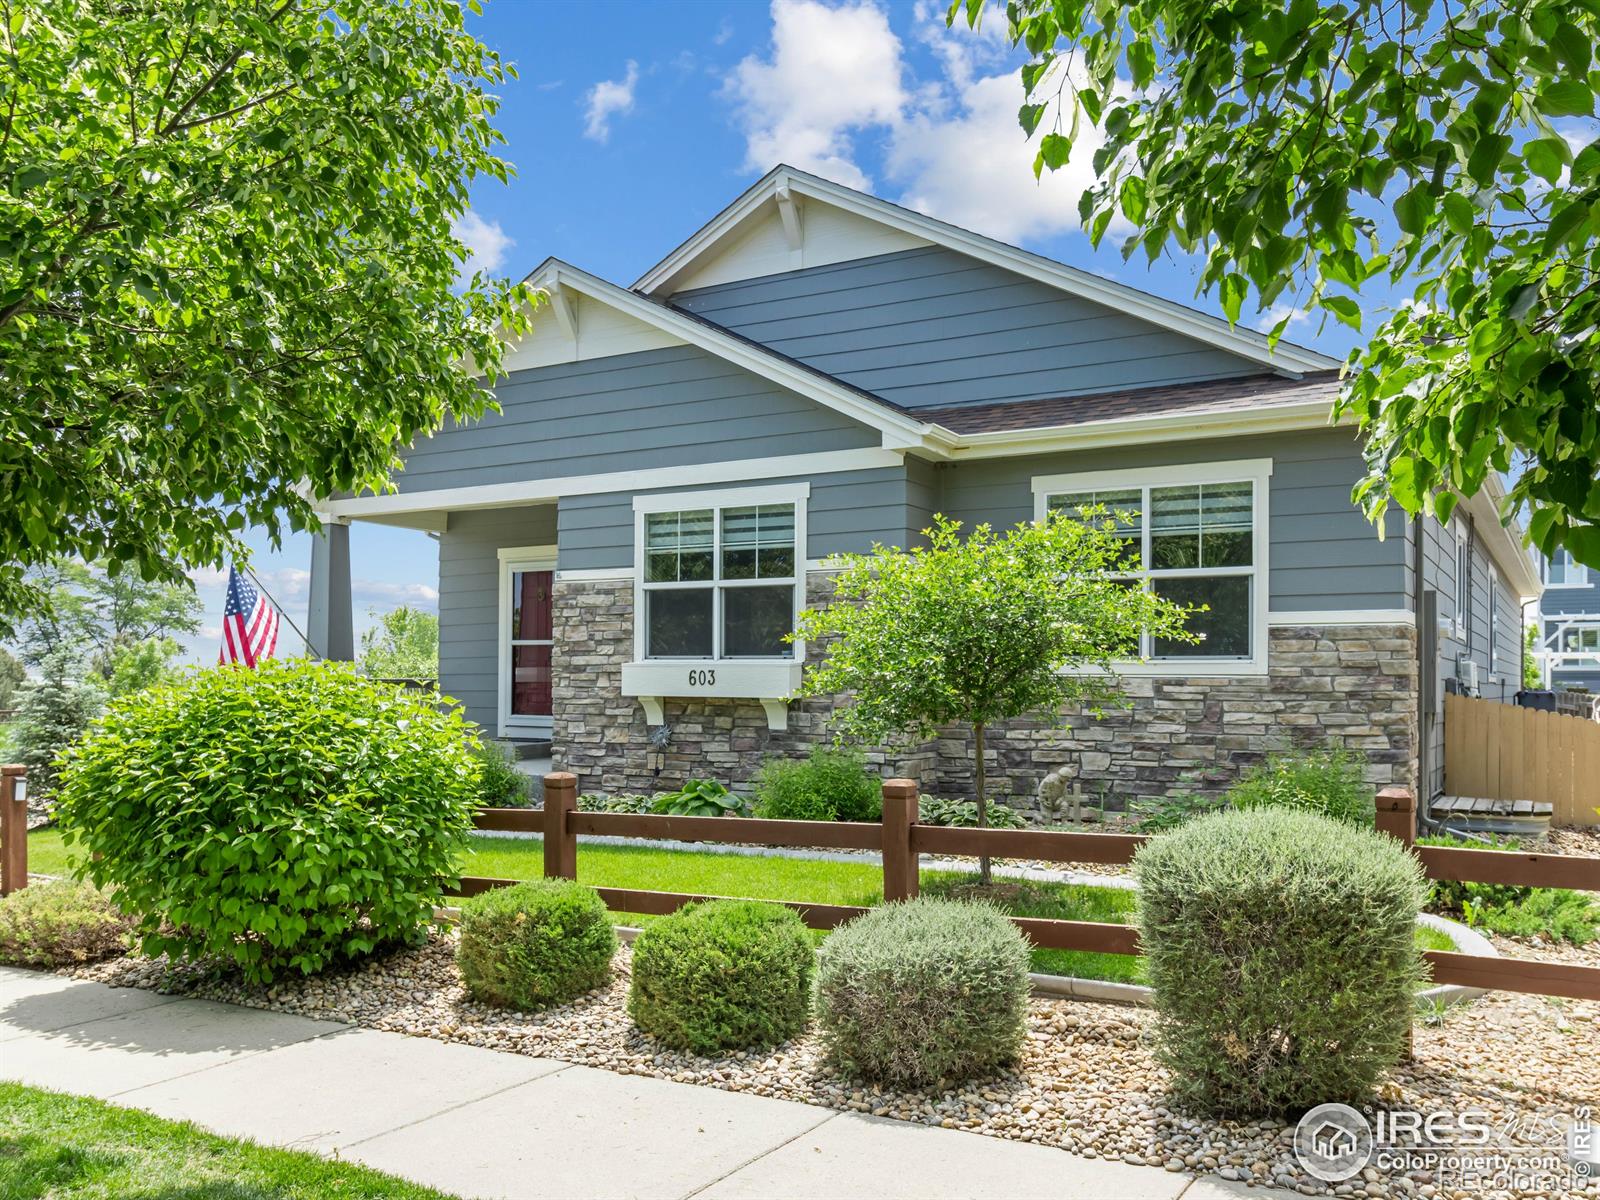
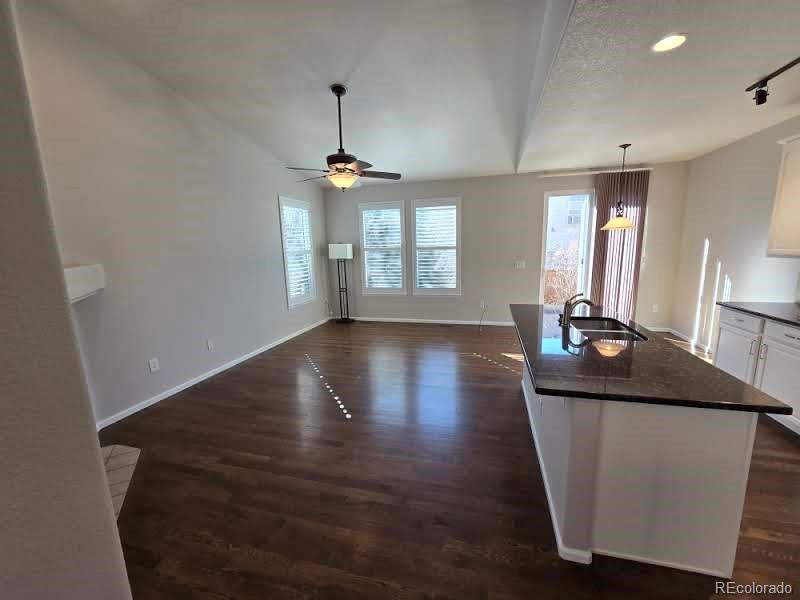
Active
$649,000
4
bds
|
3
ba
|
3,098
sqft
|
built
2008
603 Summer Hawk Dr, Longmont, CO 80504
$-1,674
Cash flow
-13.5%
Cash-on-Cash Return
3.2%
Cap rate
0.5%
Rent to Value Ratio
Active
$1,100,000
5
bds
|
5
ba
|
4,078
sqft
|
built
2005
1766 Montgomery Cir, Longmont, CO 80504
$-3,700
Cash flow
-17.5%
Cash-on-Cash Return
2.2%
Cap rate
0.4%
Rent to Value Ratio
Active
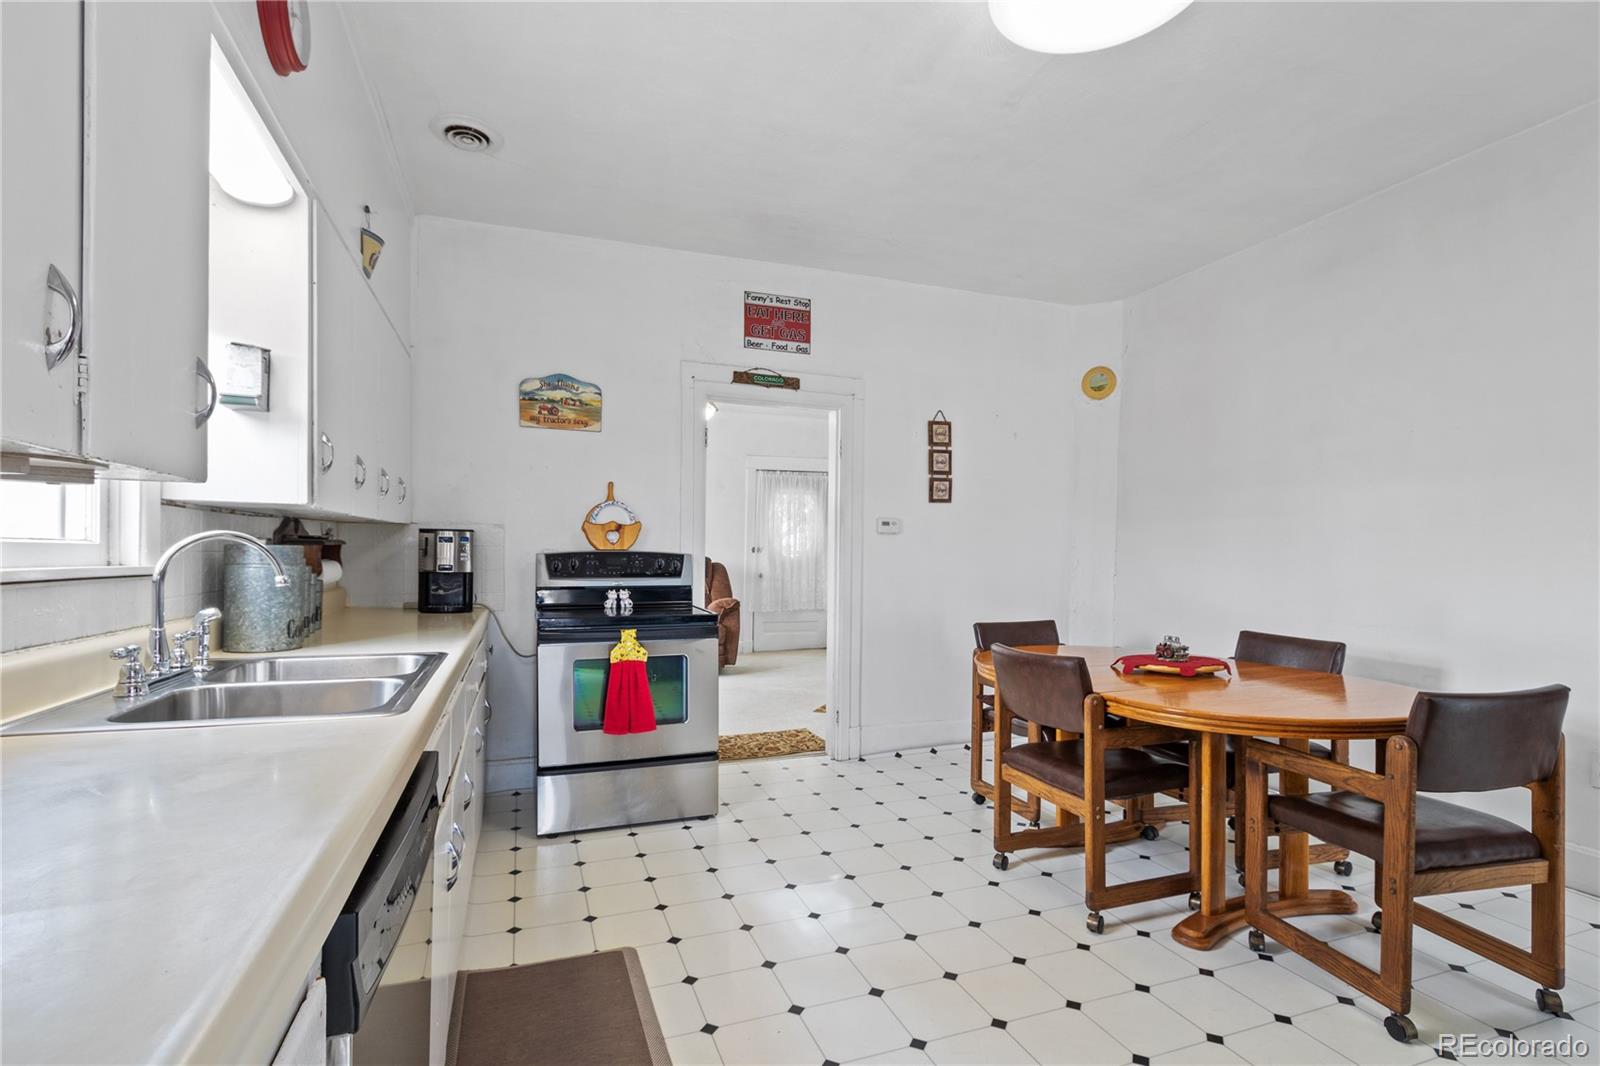
$345,000
2
bds
|
2
ba
|
1,196
sqft
|
built
1998
911 Tulip St, Longmont, CO 80501
$-646
Cash flow
-9.8%
Cash-on-Cash Return
4.0%
Cap rate
0.6%
Rent to Value Ratio
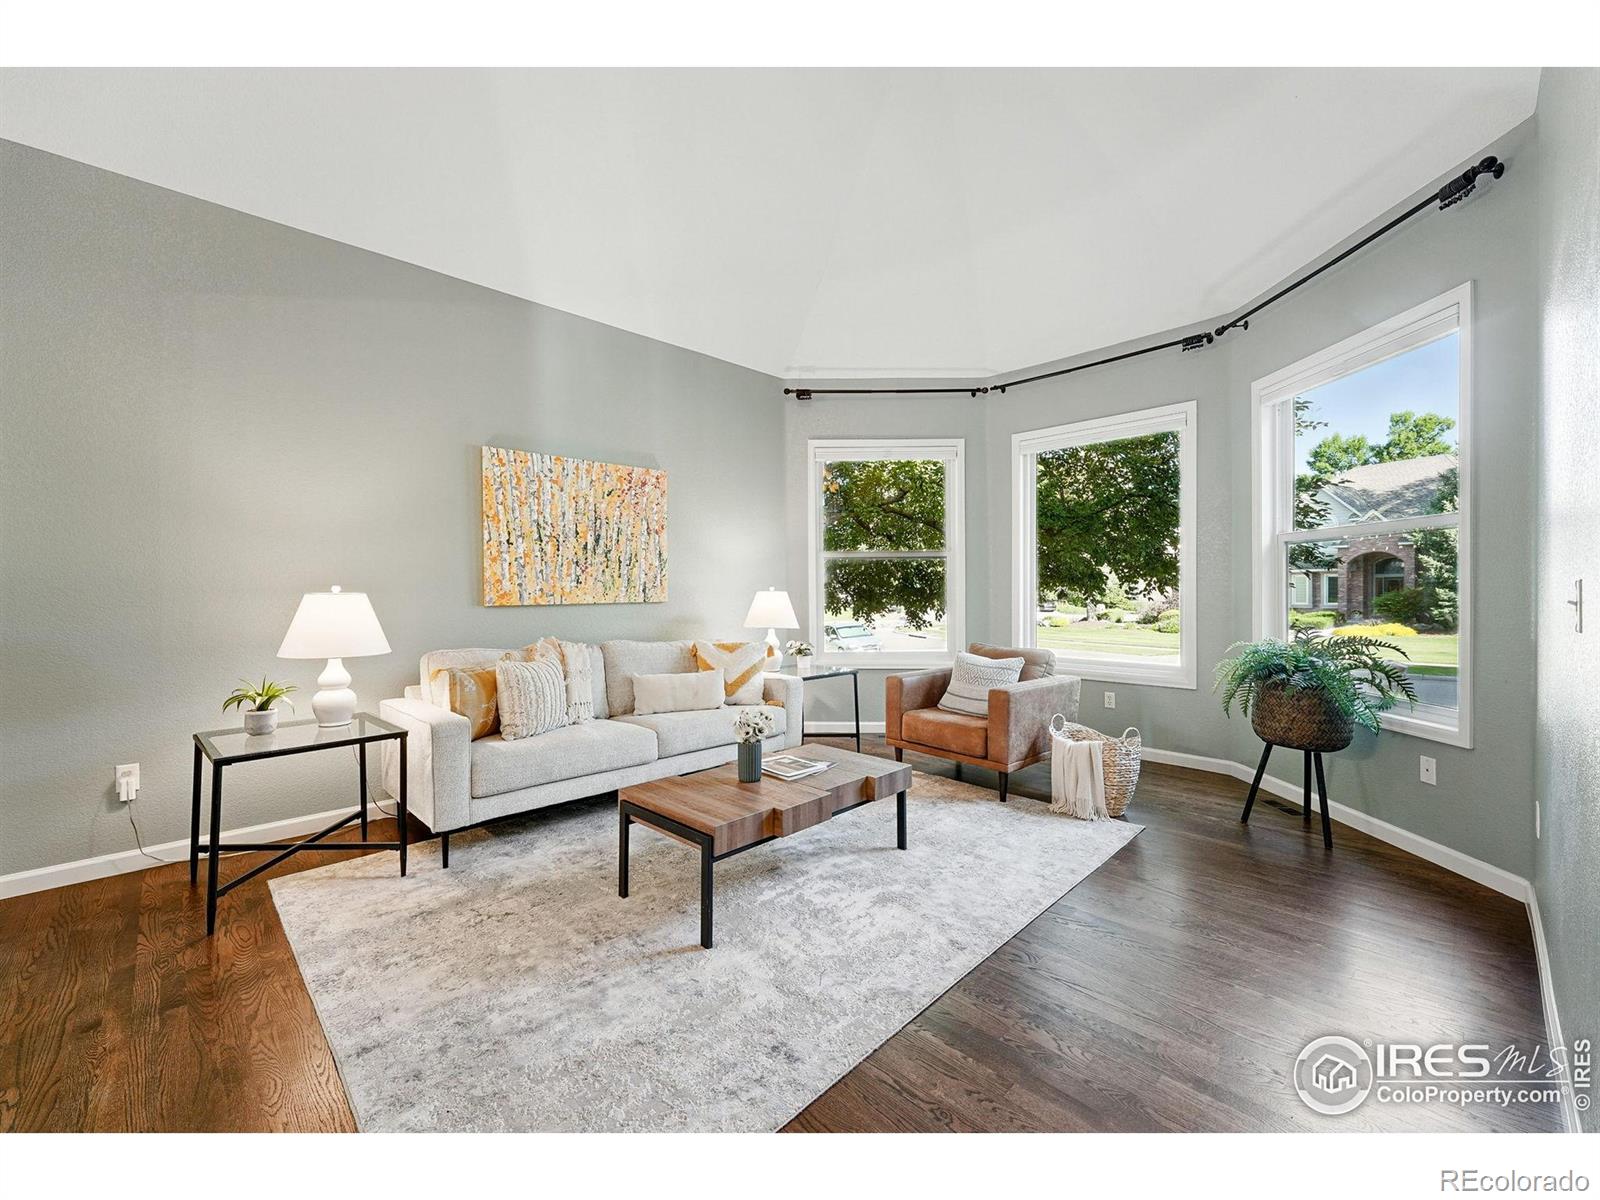
Active
$699,000
5
bds
|
3
ba
|
3,762
sqft
|
built
2002
1927 Rannoch Dr, Longmont, CO 80504
$-1,854
Cash flow
-13.8%
Cash-on-Cash Return
3.1%
Cap rate
0.5%
Rent to Value Ratio
Active
$515,000
3
bds
|
2
ba
|
1,737
sqft
|
built
1962
1217 Lincoln St, Longmont, CO 80501
$-1,013
Cash flow
-10.3%
Cash-on-Cash Return
3.9%
Cap rate
0.5%
Rent to Value Ratio
Active
$443,000
3
bds
|
4
ba
|
1,605
sqft
|
built
2019
1240 Wren Ct, Longmont, CO 80501
$-1,262
Cash flow
-14.9%
Cash-on-Cash Return
2.9%
Cap rate
0.5%
Rent to Value Ratio
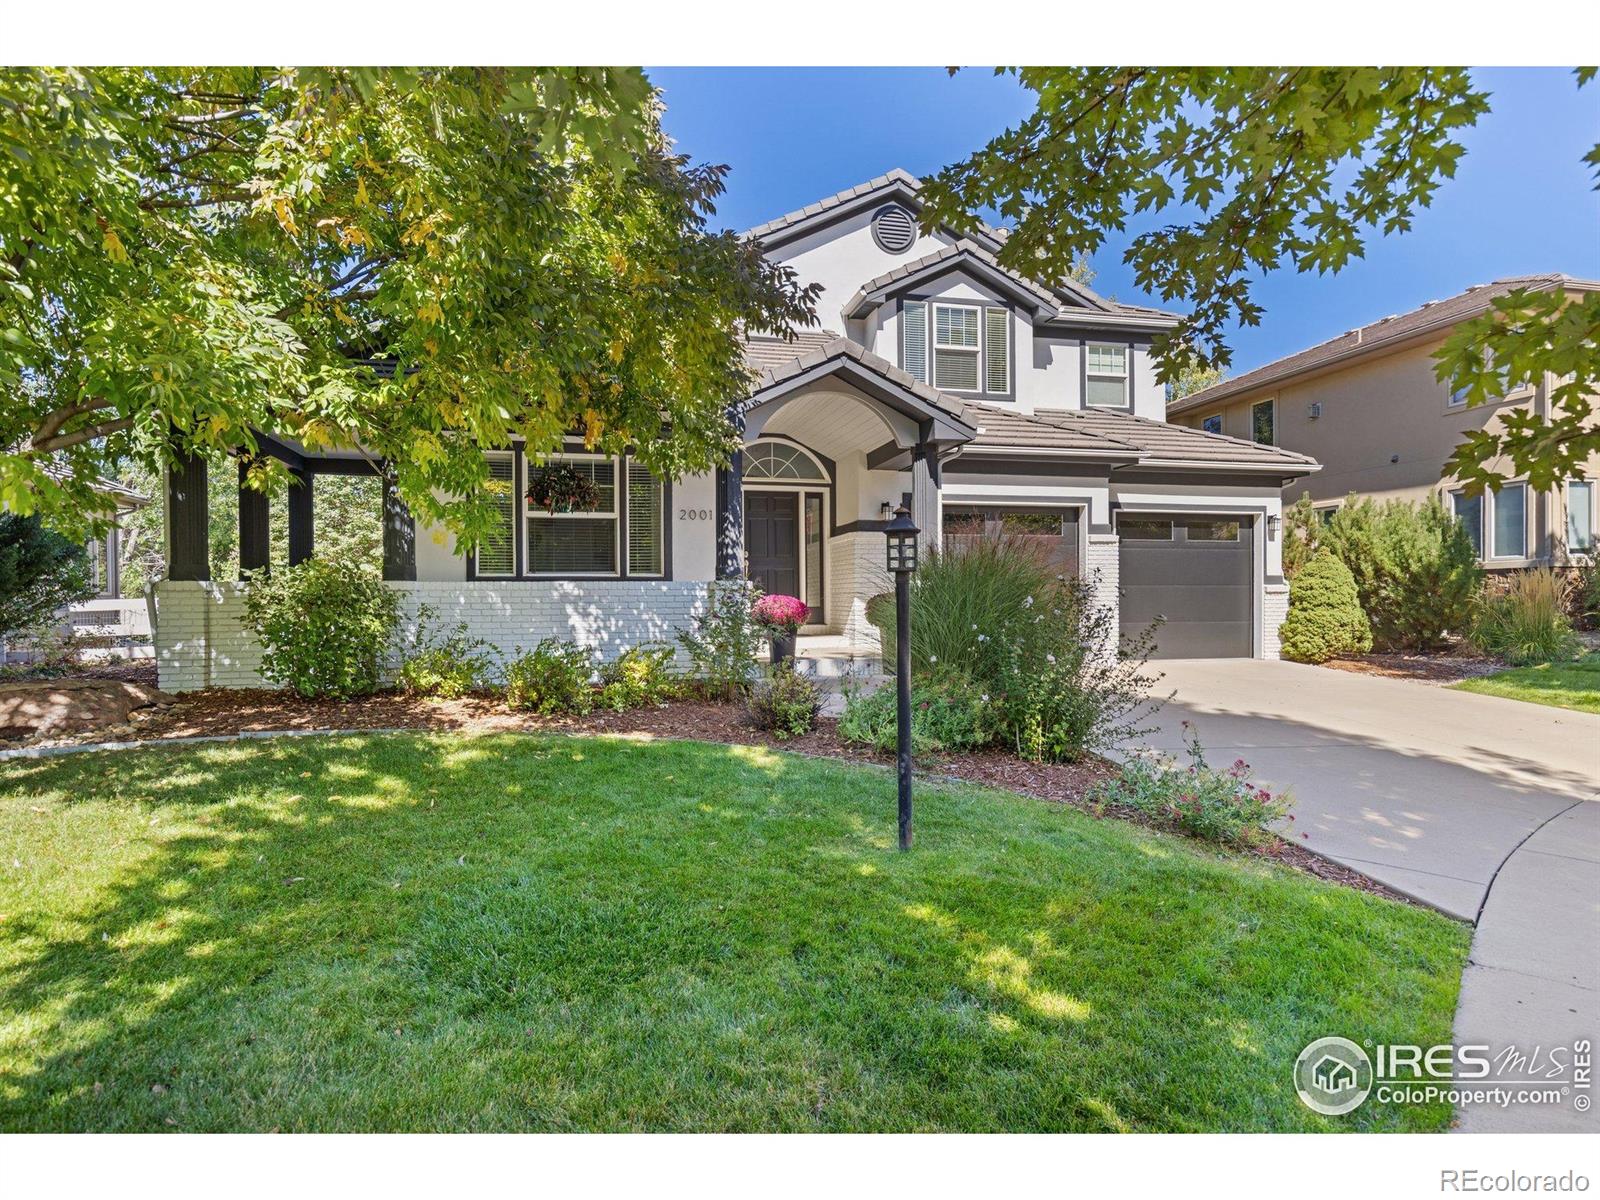
Active
$1,319,000
4
bds
|
4
ba
|
3,769
sqft
|
built
2005
2001 Coralbells Ct, Longmont, CO 80503
$-4,894
Cash flow
-19.4%
Cash-on-Cash Return
1.8%
Cap rate
0.3%
Rent to Value Ratio
Active
$460,000
1
bds
|
2
ba
|
1,062
sqft
|
built
2004
801 Confidence Dr, Longmont, CO 80504
$-1,345
Cash flow
-15.3%
Cash-on-Cash Return
2.8%
Cap rate
0.5%
Rent to Value Ratio
Active
$698,000
3
bds
|
3
ba
|
2,330
sqft
|
built
2004
336 Olympia Ave, Longmont, CO 80504
$-1,859
Cash flow
-13.9%
Cash-on-Cash Return
3.1%
Cap rate
0.5%
Rent to Value Ratio
Active
$388,999
2
bds
|
1
ba
|
760
sqft
|
built
1918
29 Marshall Pl, Longmont, CO 80504
$-798
Cash flow
-10.7%
Cash-on-Cash Return
3.8%
Cap rate
0.5%
Rent to Value Ratio
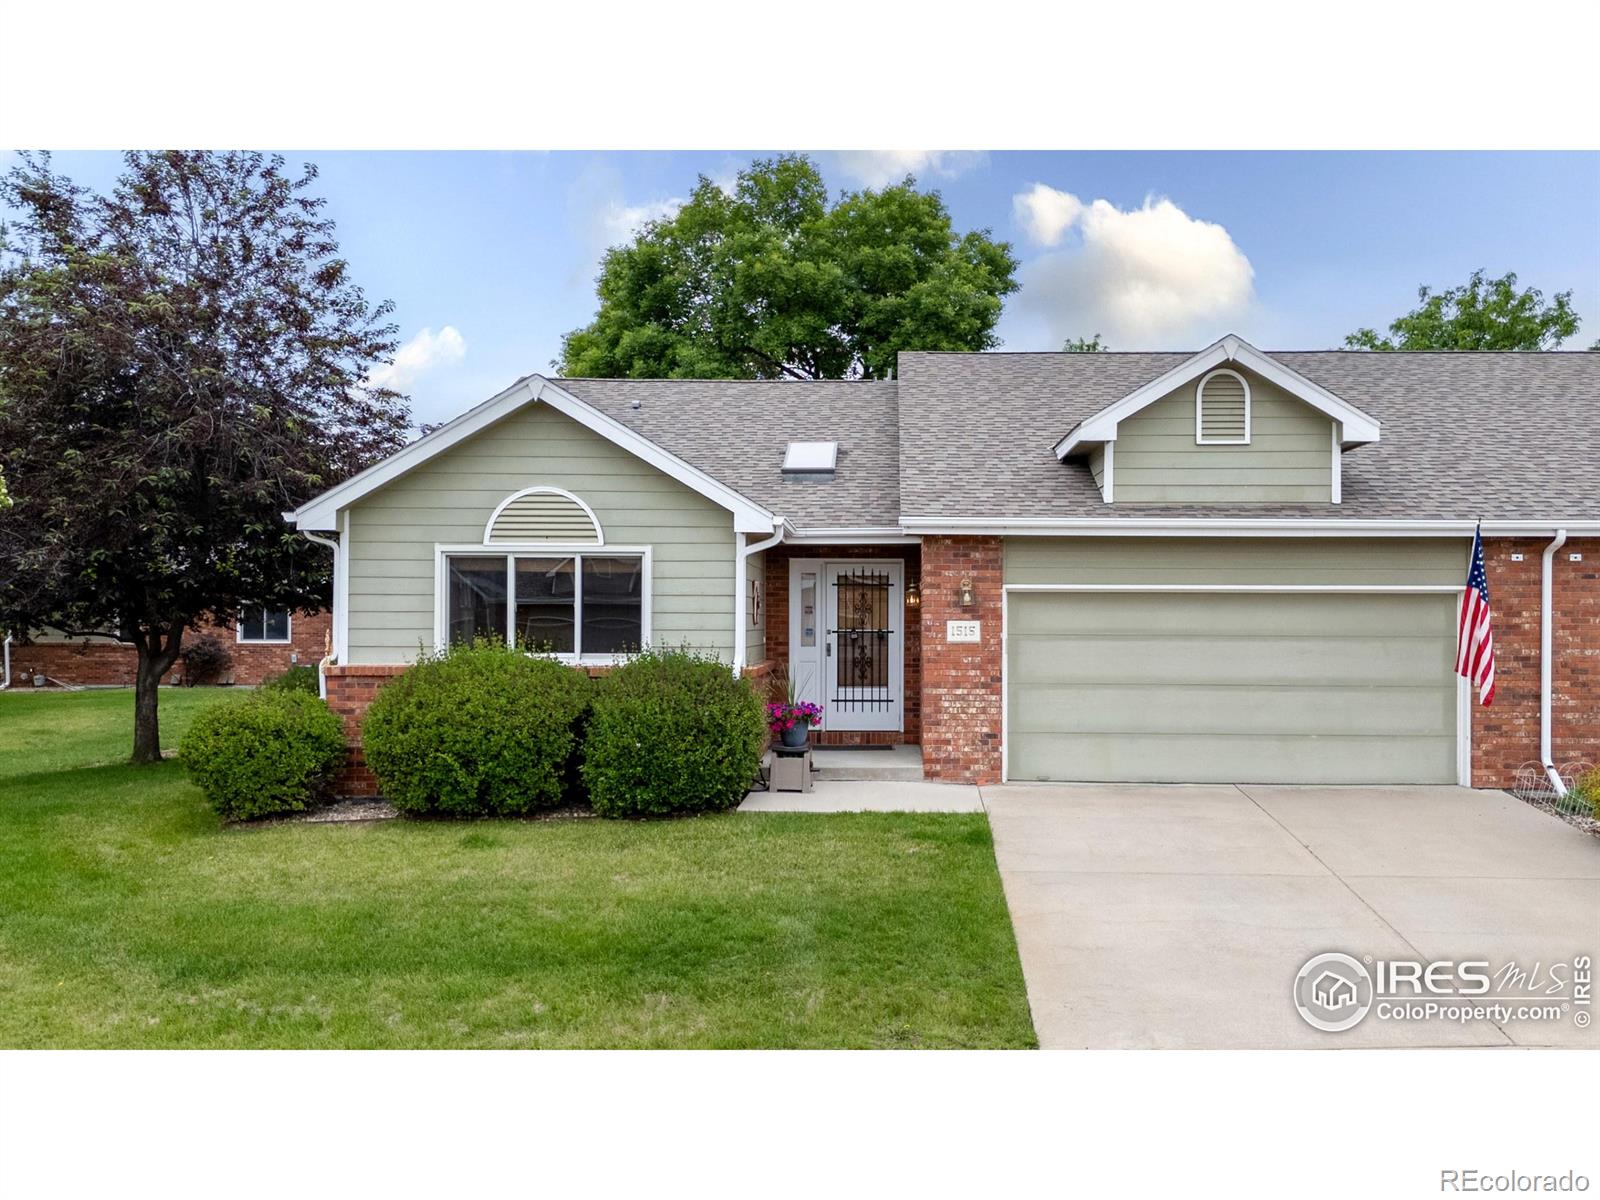
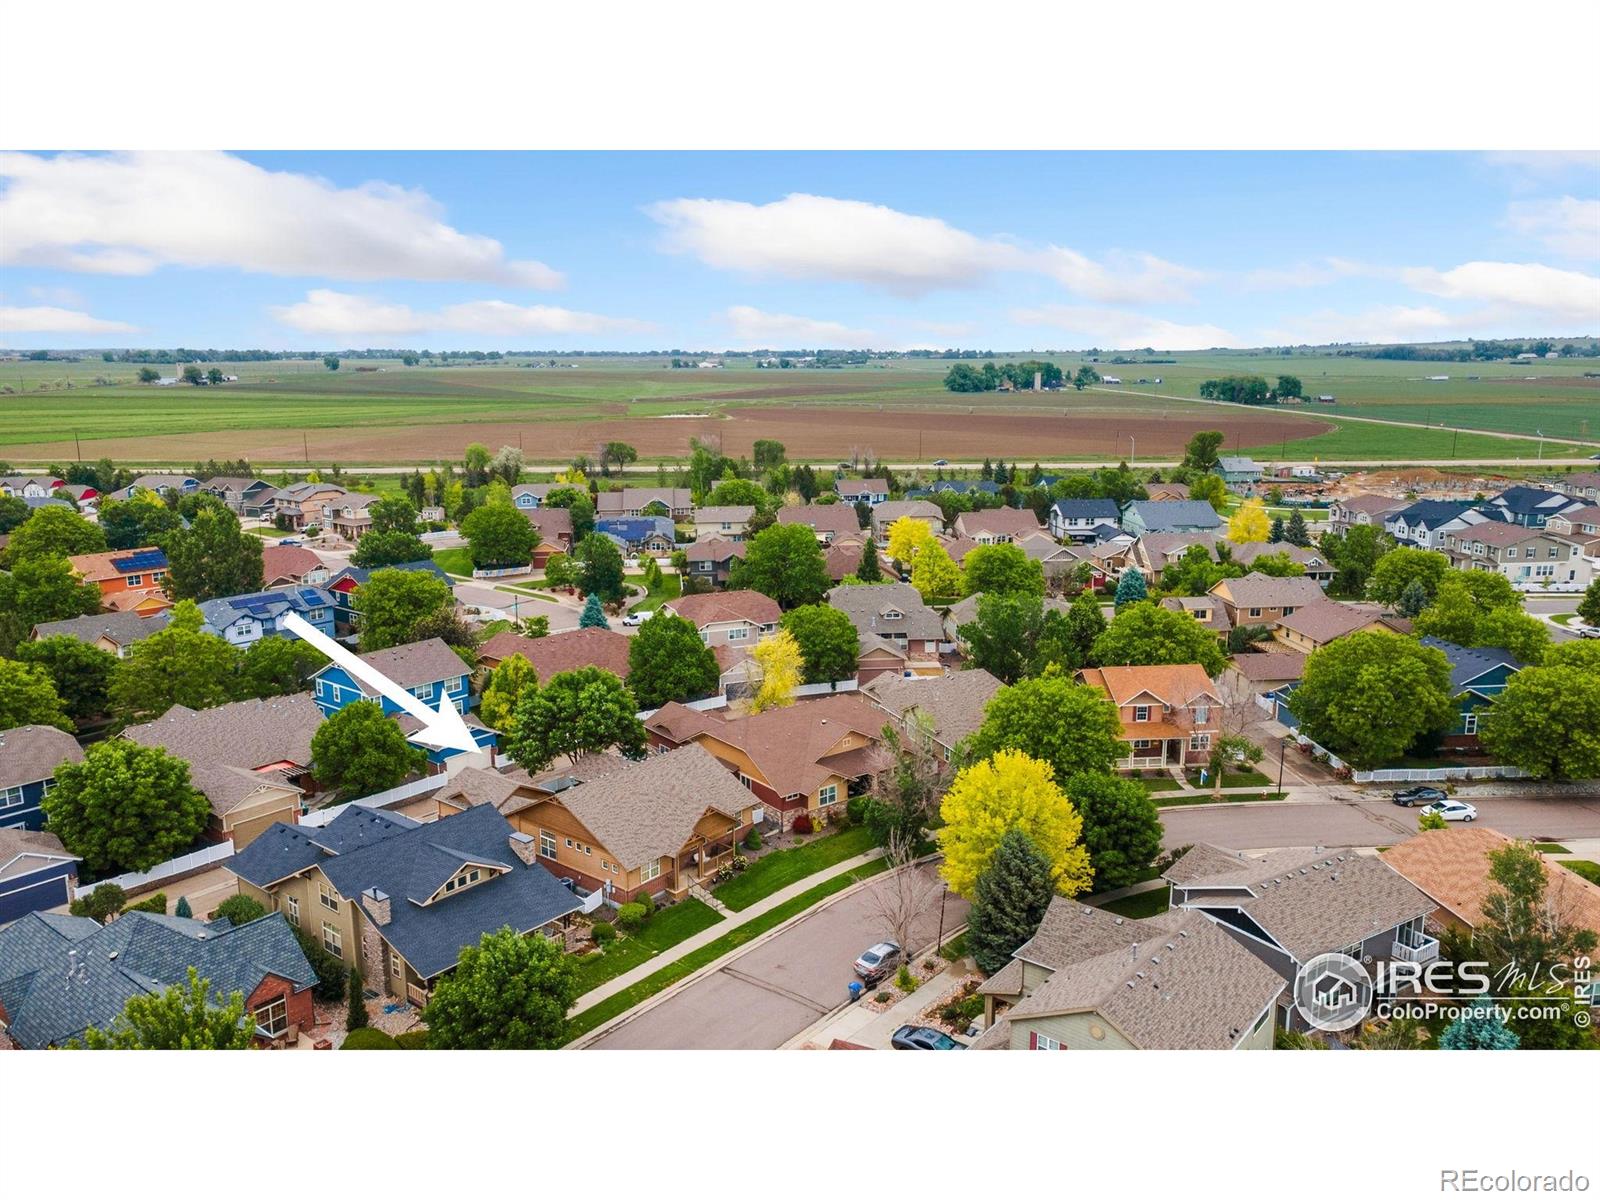
Active
$539,500
2
bds
|
2
ba
|
1,660
sqft
|
built
1993
1515 Tulip Ct, Longmont, CO 80501
$-1,592
Cash flow
-15.4%
Cash-on-Cash Return
2.7%
Cap rate
0.5%
Rent to Value Ratio
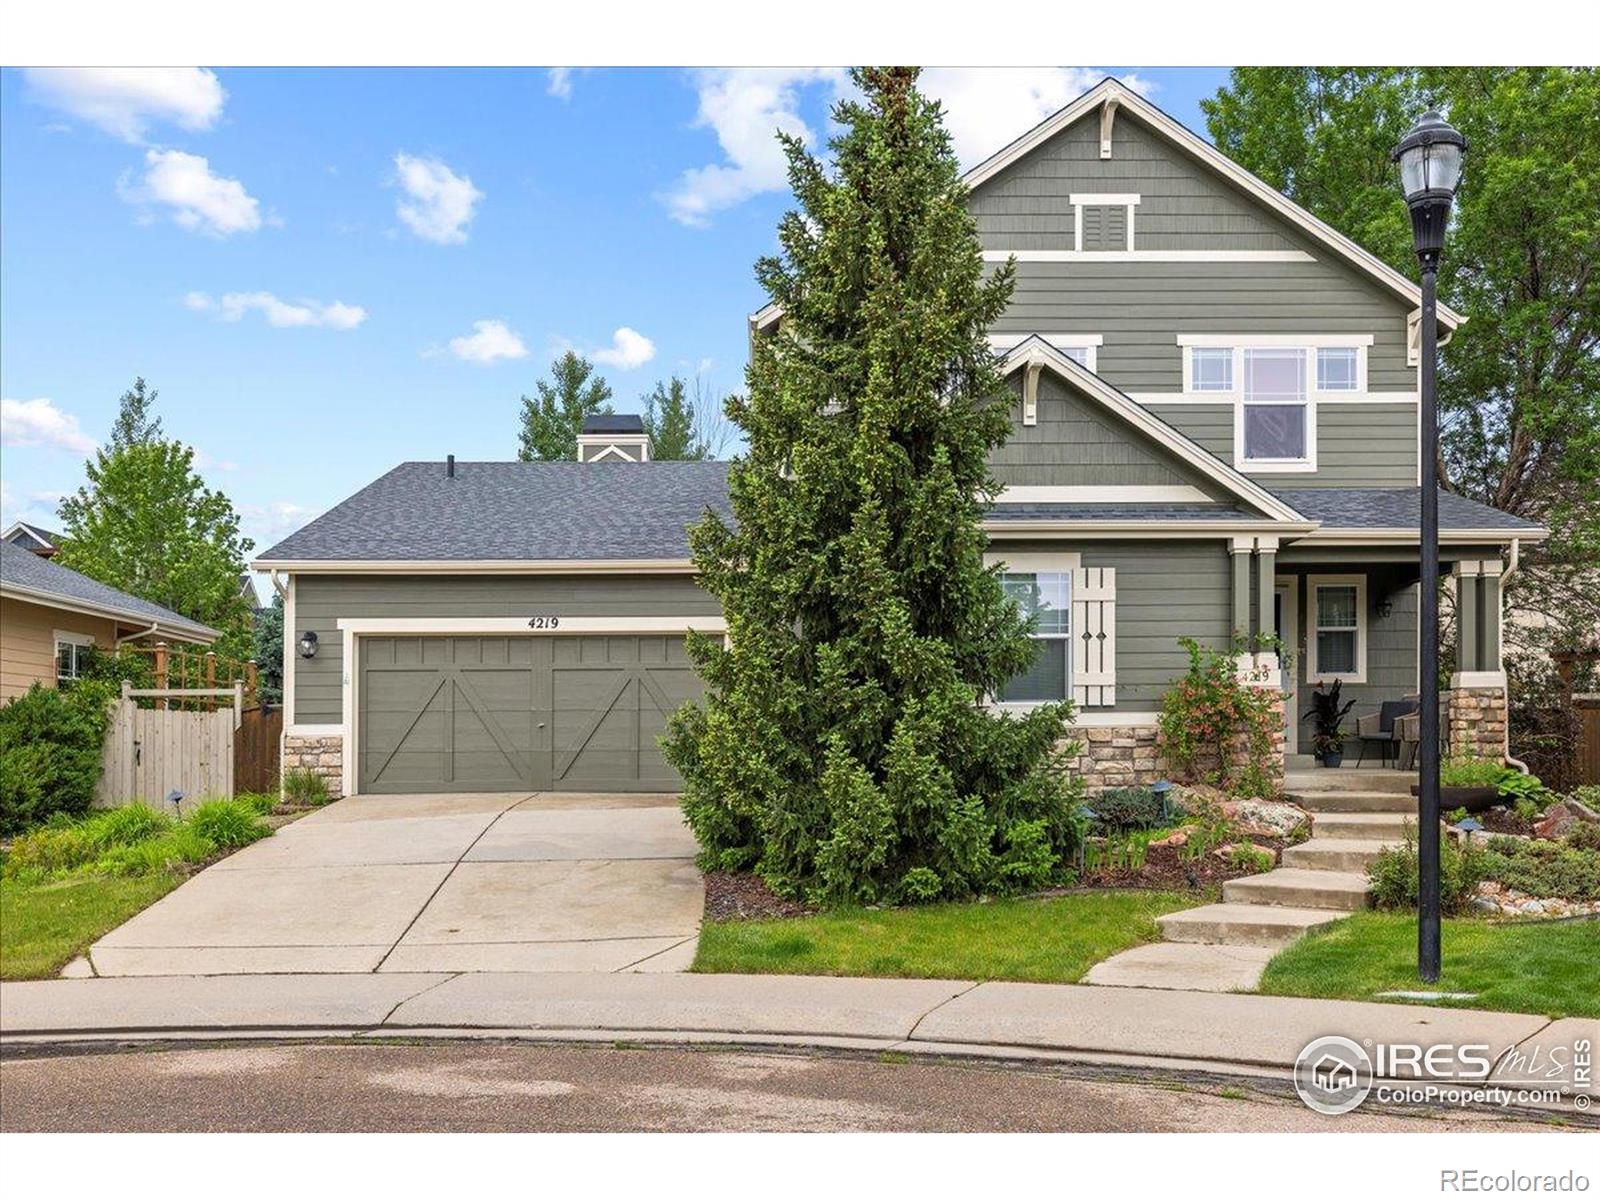
Active
$929,000
4
bds
|
4
ba
|
4,260
sqft
|
built
2003
4219 Frederick Cir, Longmont, CO 80503
$-2,315
Cash flow
-13.0%
Cash-on-Cash Return
3.3%
Cap rate
0.5%
Rent to Value Ratio
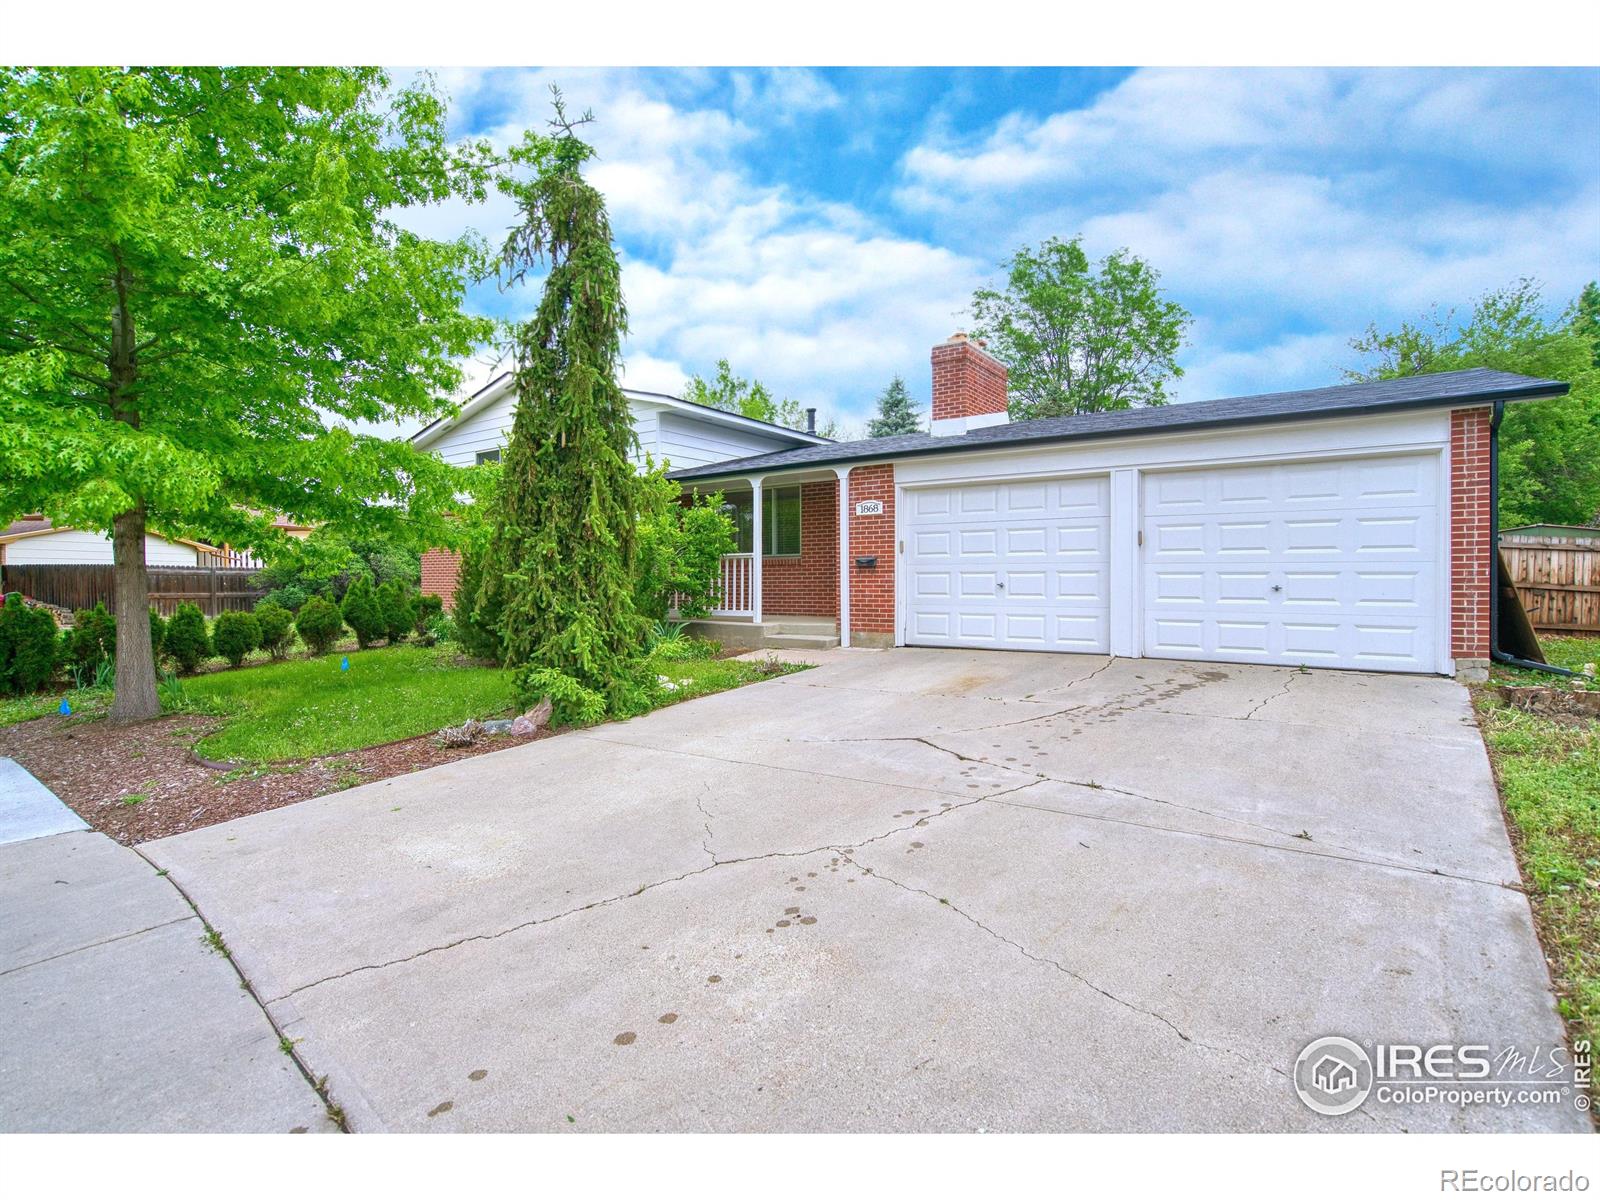
Active under contract
$499,000
4
bds
|
2
ba
|
1,737
sqft
|
built
1965
1868 Princess Dr, Longmont, CO 80501
$-1,085
Cash flow
-11.3%
Cash-on-Cash Return
3.7%
Cap rate
0.5%
Rent to Value Ratio
Active
$363,900
4
bds
|
3
ba
|
1,492
sqft
|
built
1985
2249 Emery St, Longmont, CO 80501
$-974
Cash flow
-14.0%
Cash-on-Cash Return
3.1%
Cap rate
0.6%
Rent to Value Ratio
Active
$445,000
3
bds
|
4
ba
|
1,675
sqft
|
built
2019
1240 Wren Ct, Longmont, CO 80501
$-1,122
Cash flow
-13.2%
Cash-on-Cash Return
3.3%
Cap rate
0.6%
Rent to Value Ratio
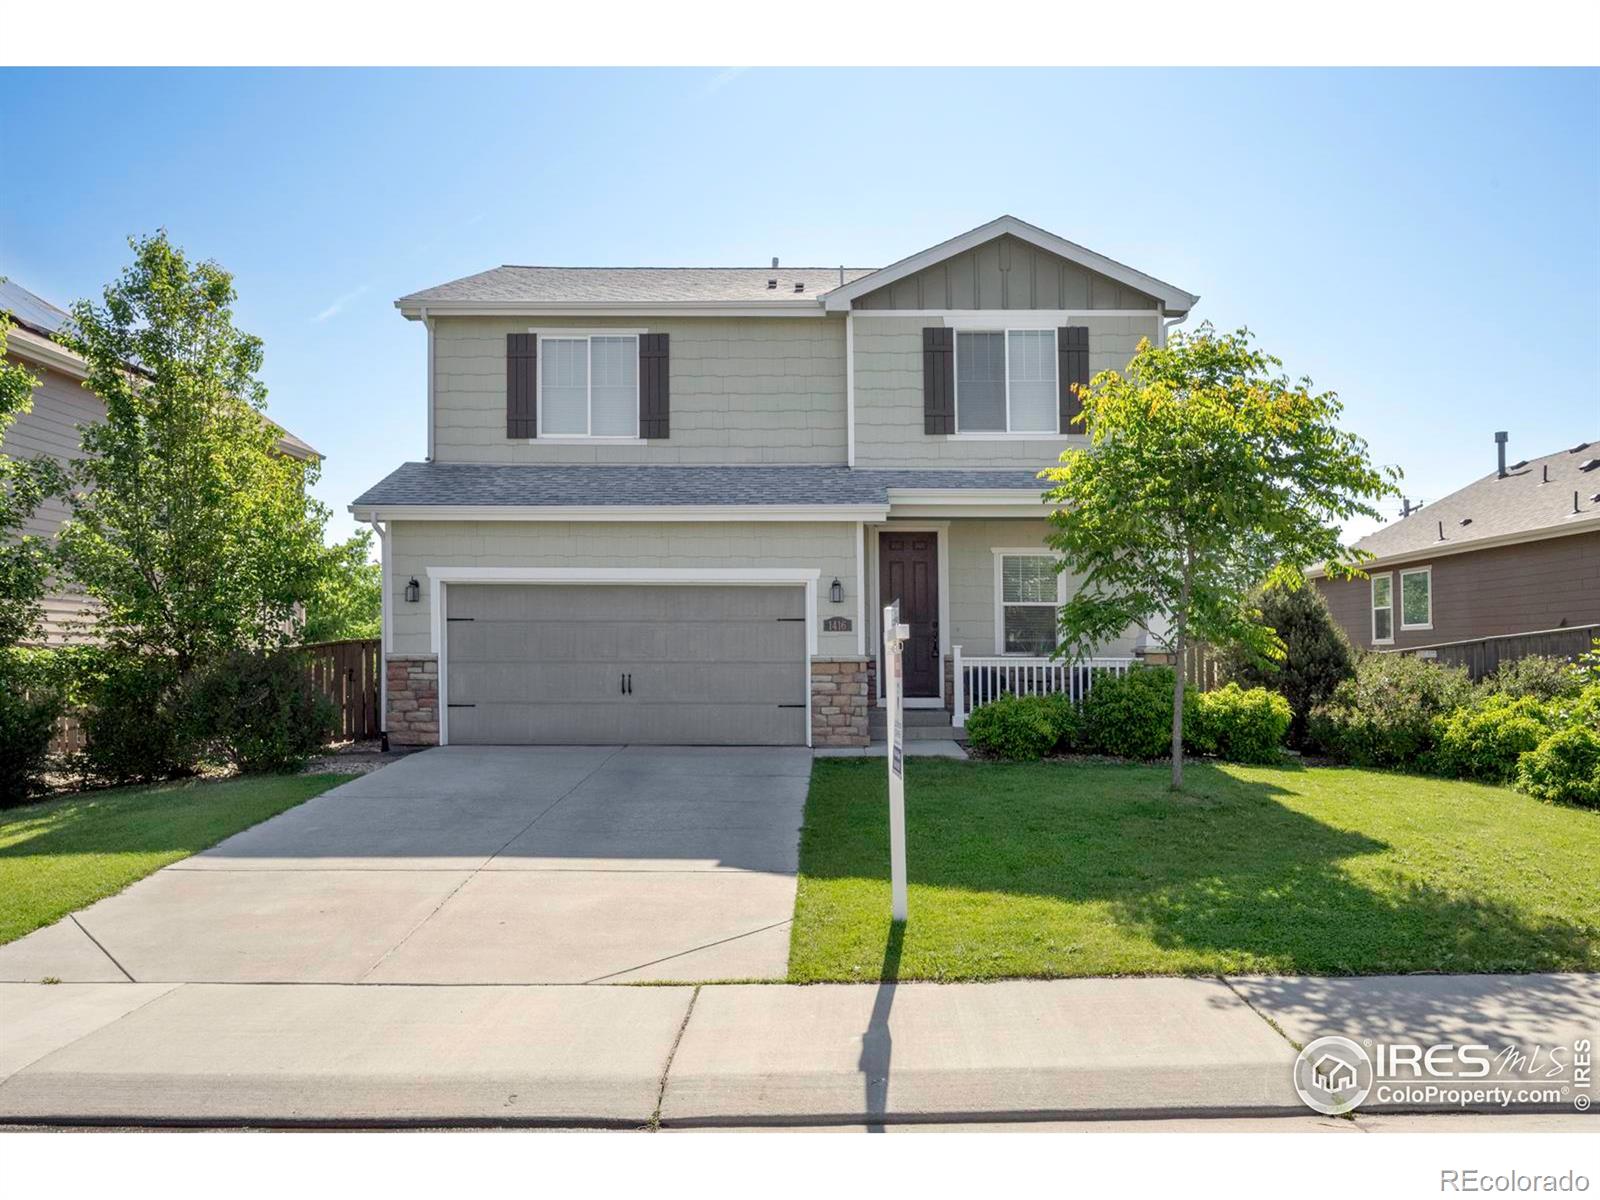
Active
$650,000
3
bds
|
3
ba
|
1,879
sqft
|
built
2016
1416 Monroe Ct, Longmont, CO 80501
$-1,842
Cash flow
-14.8%
Cash-on-Cash Return
2.9%
Cap rate
0.4%
Rent to Value Ratio
Active
$695,000
4
bds
|
3
ba
|
2,712
sqft
|
built
2011
1512 Lasalle Way, Longmont, CO 80504
$-1,674
Cash flow
-12.6%
Cash-on-Cash Return
3.4%
Cap rate
0.5%
Rent to Value Ratio
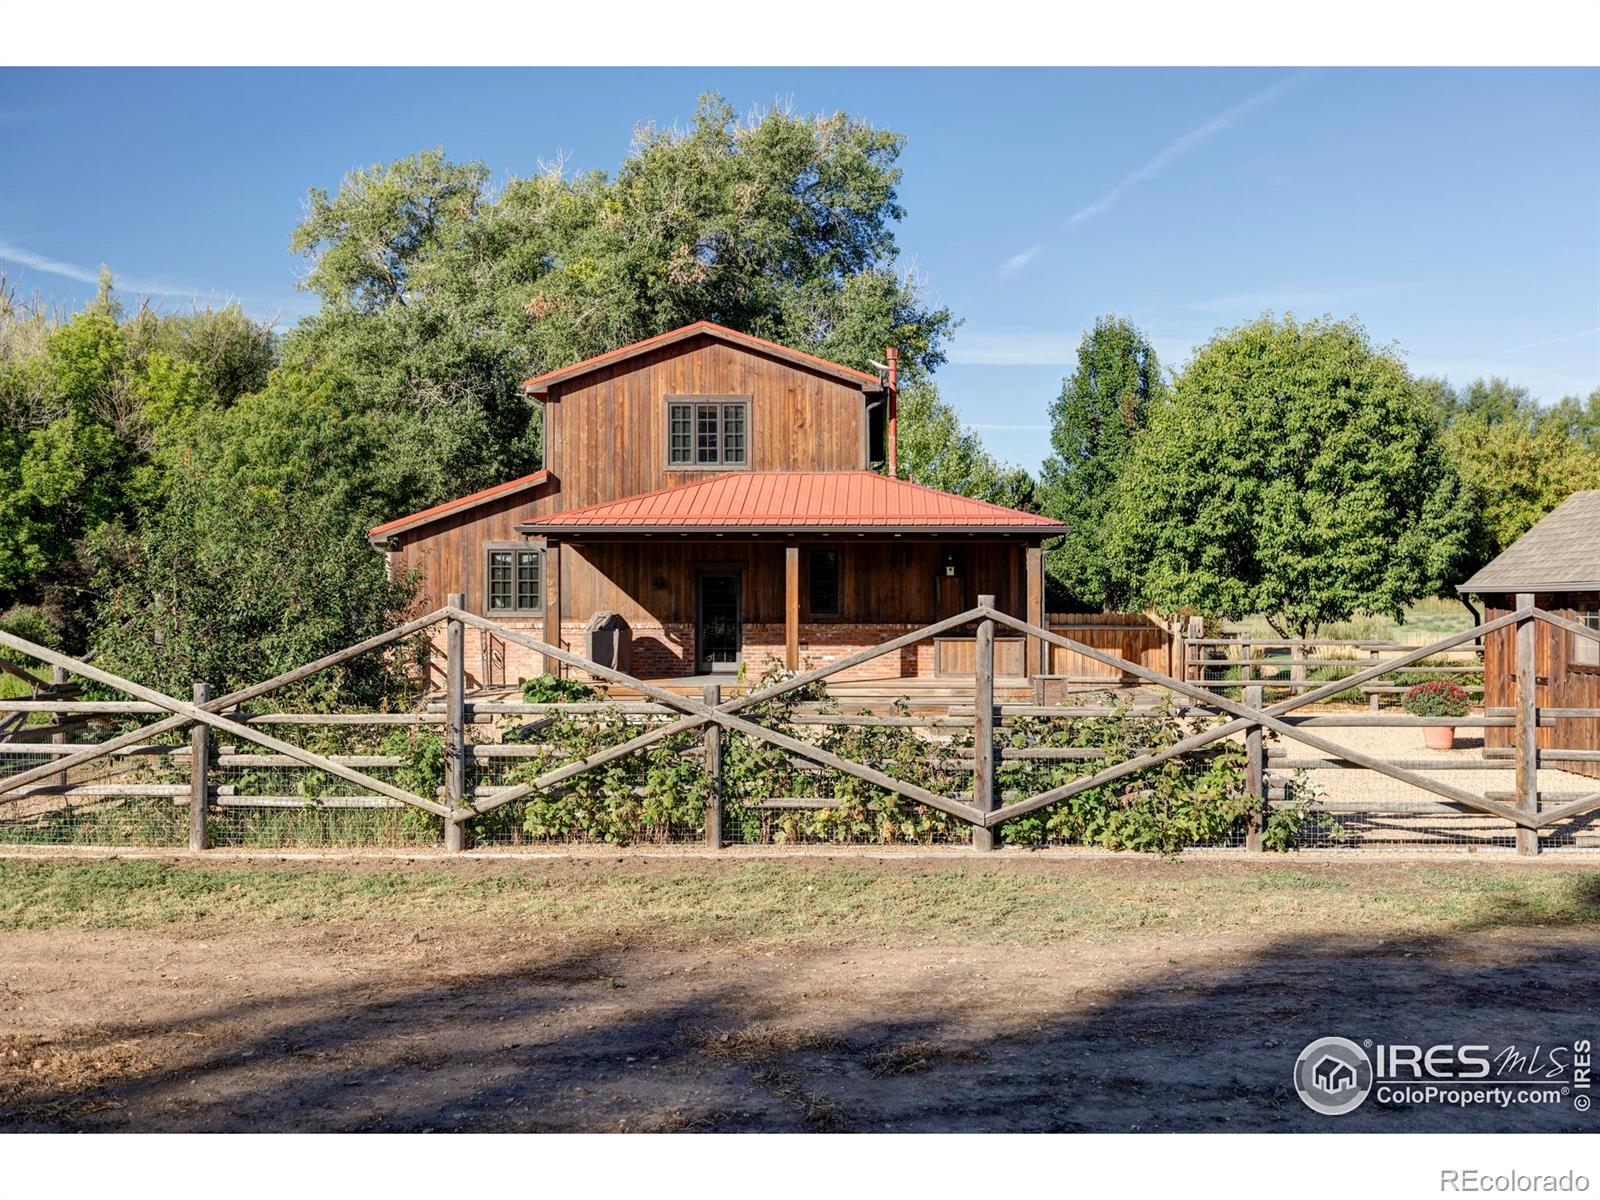
Active
$975,000
2
bds
|
1
ba
|
904
sqft
|
built
1925
14798 N 115th St, Longmont, CO 80504
$-3,235
Cash flow
-17.3%
Cash-on-Cash Return
2.3%
Cap rate
0.3%
Rent to Value Ratio
Active
$3,750,000
4
bds
|
5
ba
|
6,465
sqft
|
built
2000
15789 N 83rd St, Longmont, CO 80503
$-15,428
Cash flow
-21.5%
Cash-on-Cash Return
1.3%
Cap rate
0.2%
Rent to Value Ratio
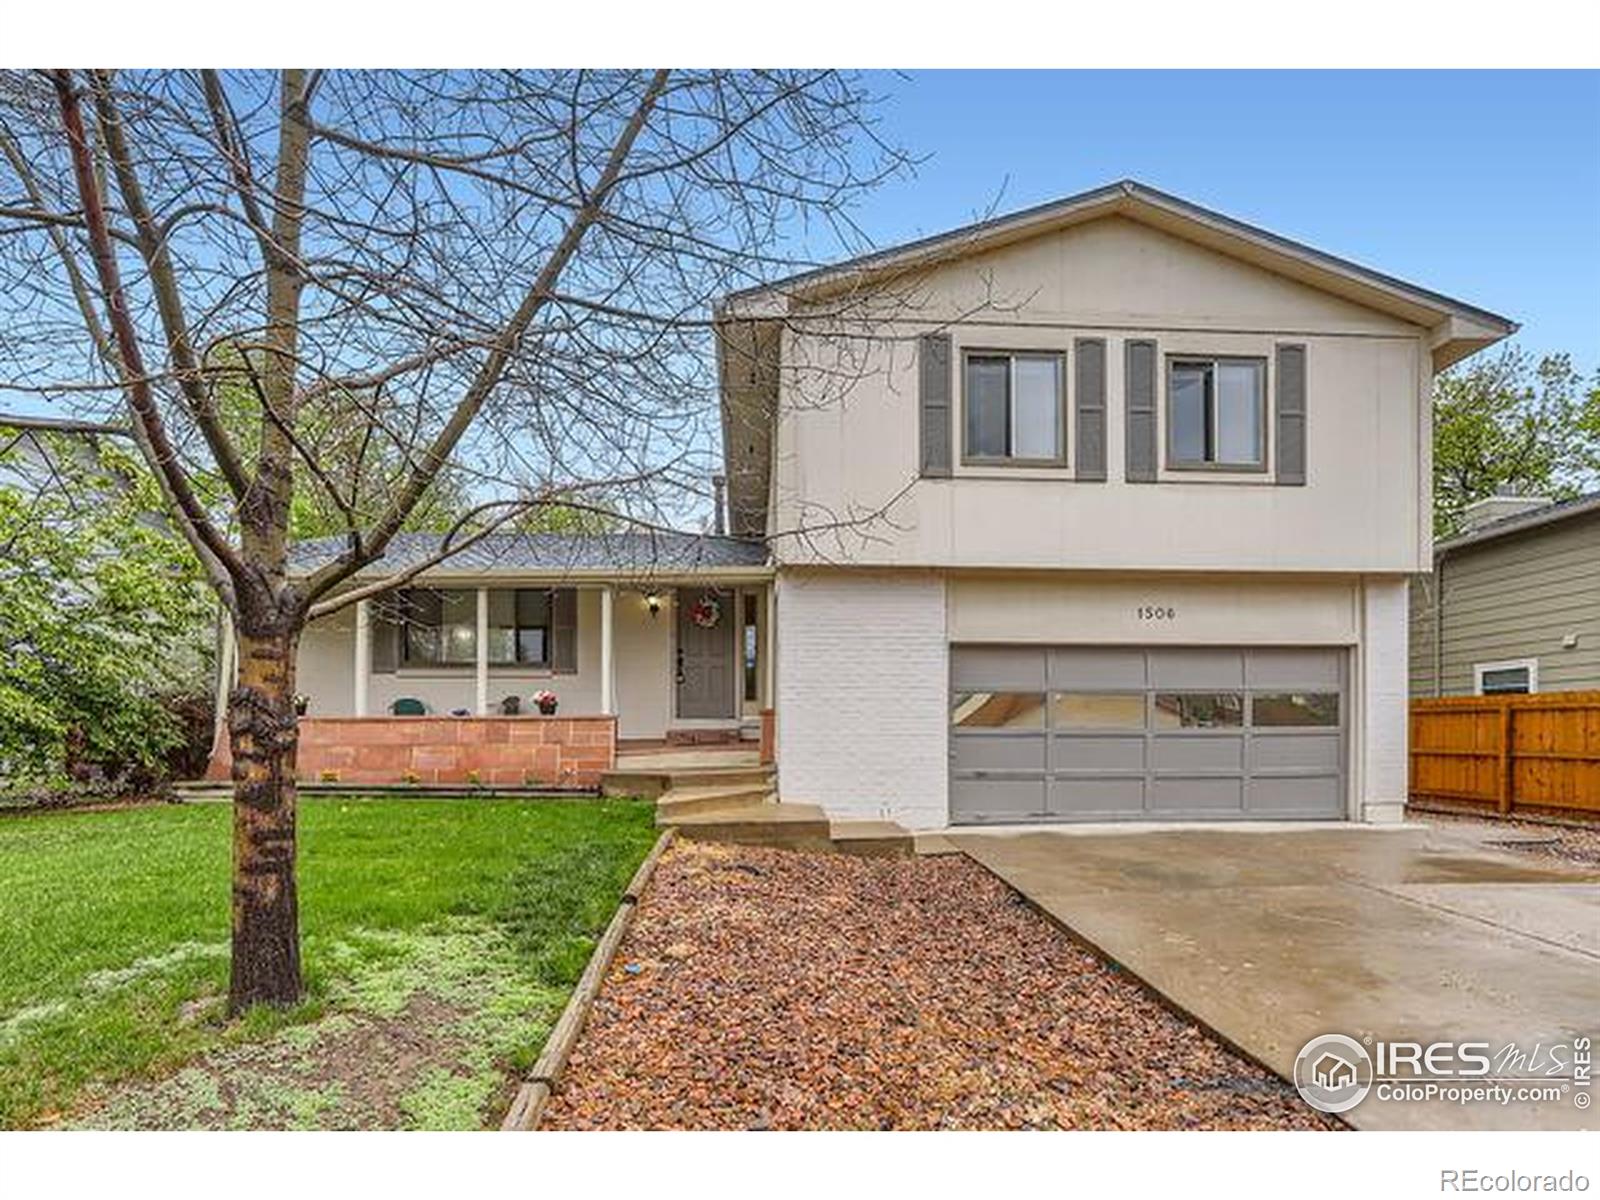
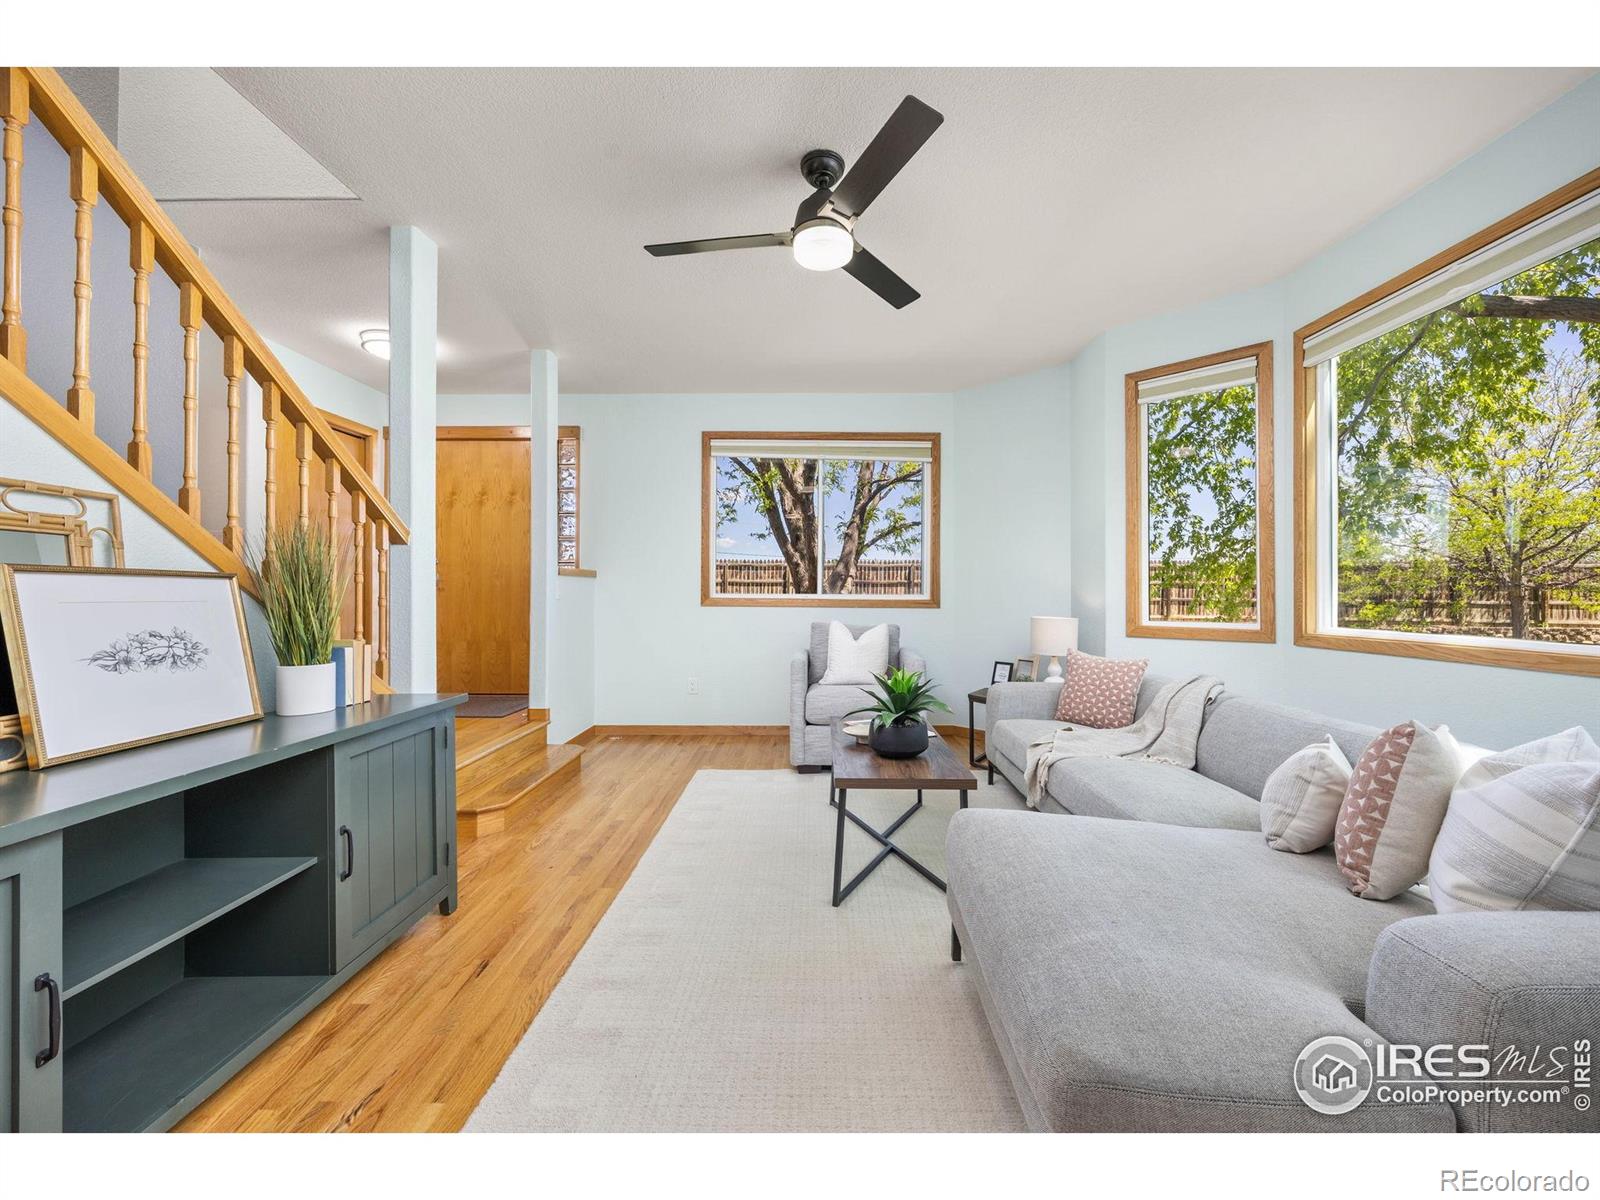
Active
$660,000
4
bds
|
3
ba
|
2,657
sqft
|
built
1983
1506 Fisk Ct, Longmont, CO 80503
$-1,619
Cash flow
-12.8%
Cash-on-Cash Return
3.3%
Cap rate
0.5%
Rent to Value Ratio
Active under contract
$639,000
4
bds
|
4
ba
|
2,955
sqft
|
built
1993
2437 Maplewood Cir E, Longmont, CO 80503
$-1,263
Cash flow
-10.3%
Cash-on-Cash Return
3.9%
Cap rate
0.5%
Rent to Value Ratio