Longmont, CO Investment Properties for Sale
Browse homes for sale and investment properties in Longmont, CO. Refine your search by price, property type, or more.
Best cash flowing properties in Longmont, CO

Active
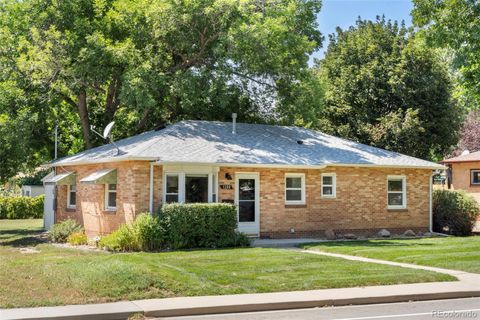
$355,000
2
bds
|
1
ba
|
1,015
sqft
|
built
1946
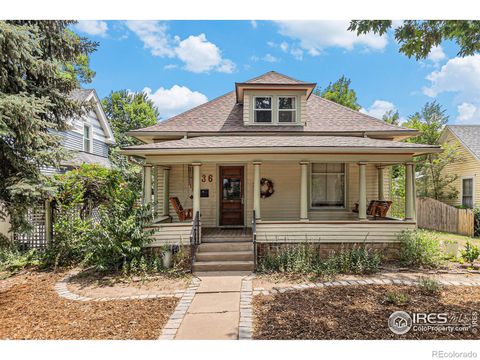
32 E Rogers Rd, Longmont, CO 80501
$-437
Cash flow
-6.4%
Cash-on-Cash Return
4.2%
Cap rate
0.6%
Rent to Value Ratio

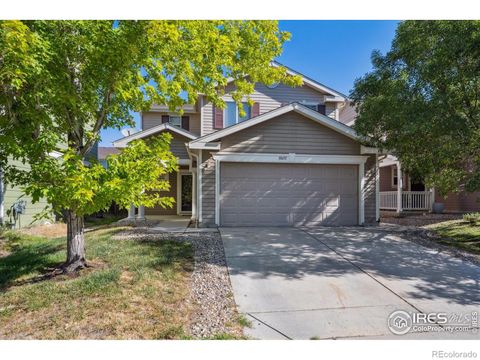
Active
$280,000
3
bds
|
2
ba
|
1,130
sqft
|
built
1973
1943 Meadow Dr, Longmont, CO 80501
$-444
Cash flow
-8.3%
Cash-on-Cash Return
3.8%
Cap rate
0.6%
Rent to Value Ratio
177 out of 200 properties for sale in Longmont, CO
Limited Results Shown
Create a free account, or log in to reveal all property listings and enjoy the complete experience.
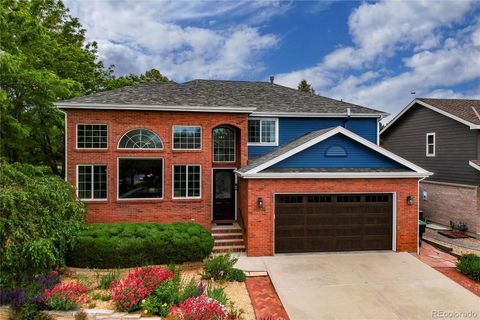
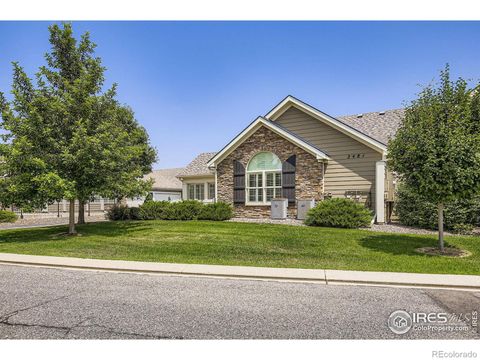
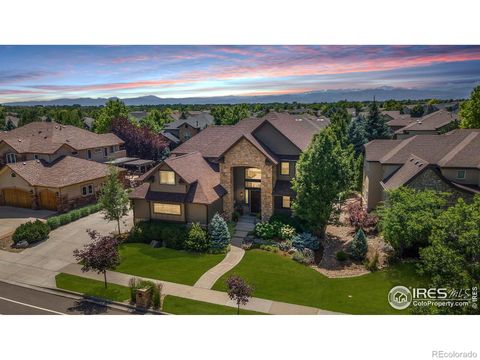
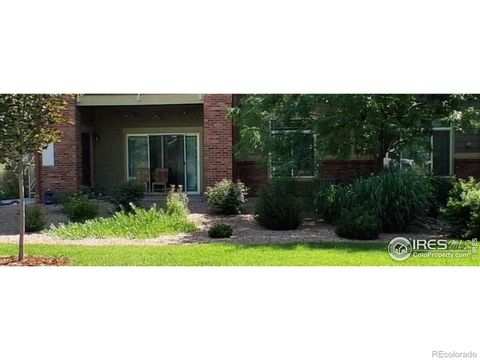
Active
$899,999
4
bds
|
4
ba
|
2,622
sqft
|
built
1996
3142 Captains Ln, Longmont, CO 80503
$-2,311
Cash flow
-13.4%
Cash-on-Cash Return
2.6%
Cap rate
0.4%
Rent to Value Ratio
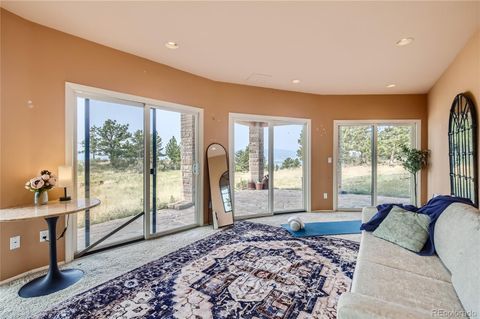
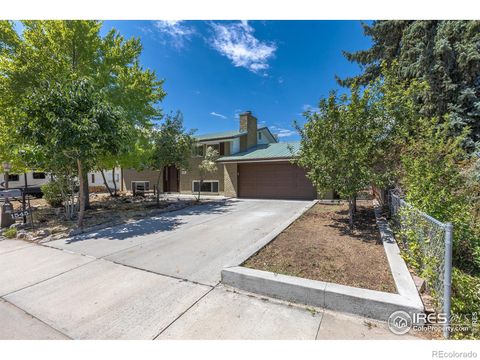
Active
$1,250,000
3
bds
|
2
ba
|
2,019
sqft
|
built
1995
3001 Eagle Ridge Rd, Longmont, CO 80503
$-2,590
Cash flow
-10.8%
Cash-on-Cash Return
3.2%
Cap rate
0.5%
Rent to Value Ratio
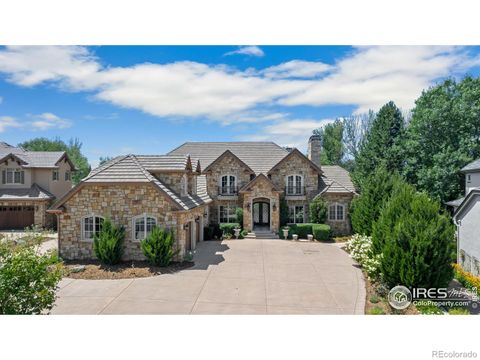
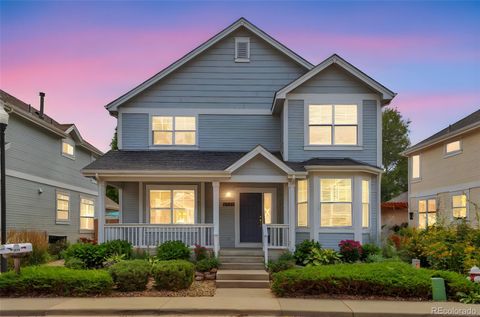
Active
$2,890,000
5
bds
|
6
ba
|
9,510
sqft
|
built
2006
1615 Stardance Cir, Longmont, CO 80504
$-8,534
Cash flow
-15.4%
Cash-on-Cash Return
2.1%
Cap rate
0.3%
Rent to Value Ratio
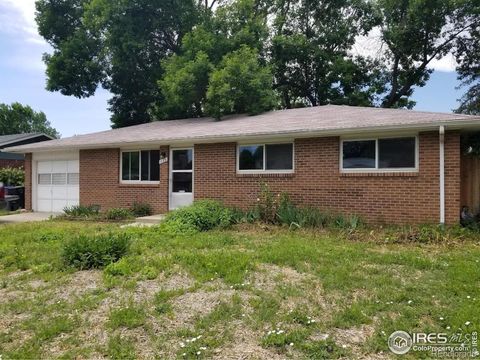
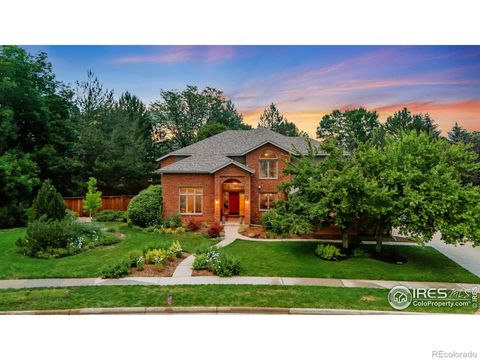
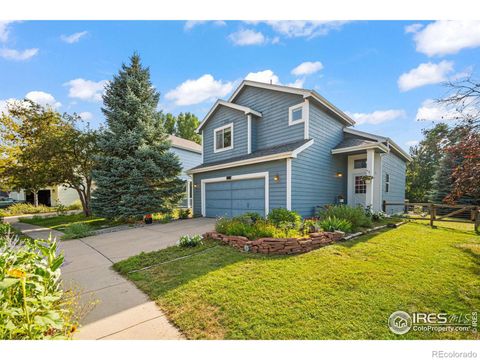
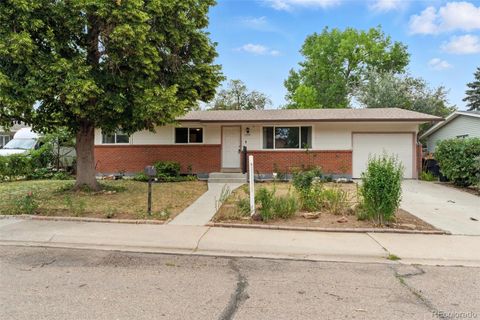
Active
$410,000
3
bds
|
1
ba
|
1,000
sqft
|
built
1973
829 Hubbard Dr, Longmont, CO 80504
$-566
Cash flow
-7.2%
Cash-on-Cash Return
4.0%
Cap rate
0.5%
Rent to Value Ratio
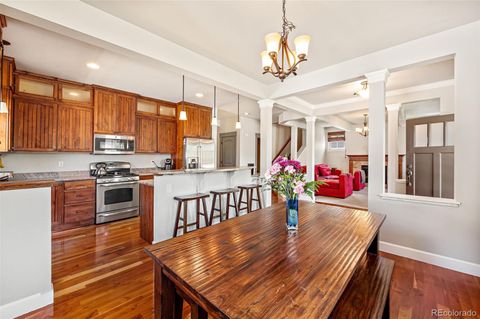
Active
$699,000
3
bds
|
3
ba
|
2,127
sqft
|
built
1999
301 Widgeon Dr, Longmont, CO 80503
$-1,591
Cash flow
-11.9%
Cash-on-Cash Return
2.9%
Cap rate
0.4%
Rent to Value Ratio
Active
$369,000
2
bds
|
2
ba
|
1,282
sqft
|
built
1999
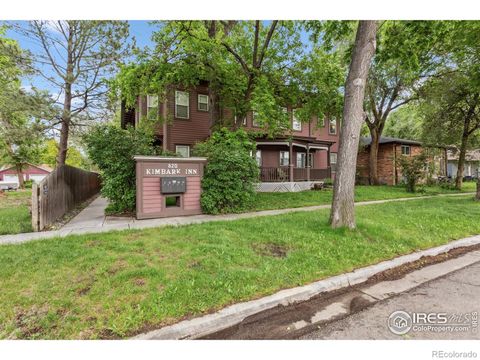
820 Kimbark St, Longmont, CO 80501
$-610
Cash flow
-8.6%
Cash-on-Cash Return
3.7%
Cap rate
0.6%
Rent to Value Ratio
Active
$725,000
5
bds
|
3
ba
|
2,164
sqft
|
built
1910
736 Kimbark St, Longmont, CO 80501
$-1,401
Cash flow
-10.1%
Cash-on-Cash Return
3.4%
Cap rate
0.5%
Rent to Value Ratio
Active
$424,800
2
bds
|
1
ba
|
1,215
sqft
|
built
1959
1202 9th Ave, Longmont, CO 80501
$-649
Cash flow
-8.0%
Cash-on-Cash Return
3.8%
Cap rate
0.5%
Rent to Value Ratio
Active
$534,900
3
bds
|
3
ba
|
2,342
sqft
|
built
2018
883 Widgeon Cir, Longmont, CO 80503
$-912
Cash flow
-8.9%
Cash-on-Cash Return
3.6%
Cap rate
0.6%
Rent to Value Ratio
Active
$549,000
3
bds
|
3
ba
|
1,446
sqft
|
built
2001
1201 Trout Creek Cir, Longmont, CO 80504
$-1,155
Cash flow
-11.0%
Cash-on-Cash Return
3.2%
Cap rate
0.5%
Rent to Value Ratio
Active
$1,550,000
3
bds
|
4
ba
|
4,769
sqft
|
built
1997
8858 Prairie Knoll Dr, Longmont, CO 80503
$-5,444
Cash flow
-18.3%
Cash-on-Cash Return
1.5%
Cap rate
0.3%
Rent to Value Ratio
Active
$589,999
5
bds
|
4
ba
|
2,300
sqft
|
built
2000
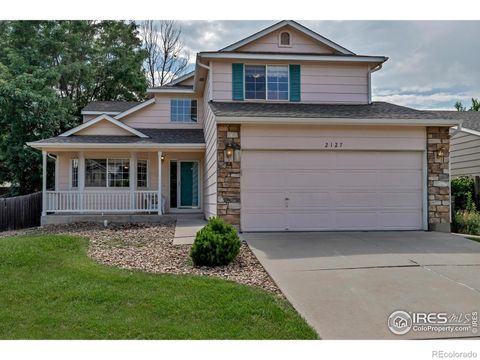
2127 Astoria Ln, Longmont, CO 80504
$-1,146
Cash flow
-10.1%
Cash-on-Cash Return
3.3%
Cap rate
0.5%
Rent to Value Ratio
Active
$565,000
2
bds
|
2
ba
|
1,737
sqft
|
built
2011
2481 Santa Fe Dr, Longmont, CO 80504
$-1,448
Cash flow
-13.4%
Cash-on-Cash Return
2.6%
Cap rate
0.5%
Rent to Value Ratio
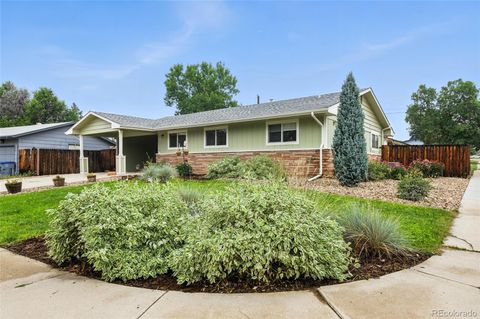
Active
$555,000
4
bds
|
2
ba
|
2,240
sqft
|
built
1971
1545 Drake St, Longmont, CO 80503
$-1,078
Cash flow
-10.1%
Cash-on-Cash Return
3.3%
Cap rate
0.5%
Rent to Value Ratio

Active
$330,000
2
bds
|
1
ba
|
1,069
sqft
|
built
1981
400 Emery St, Longmont, CO 80501
$-802
Cash flow
-12.7%
Cash-on-Cash Return
2.8%
Cap rate
0.6%
Rent to Value Ratio
Active
$699,000
3
bds
|
3
ba
|
1,932
sqft
|
built
1999
2111 River Walk Ln, Longmont, CO 80504
$-1,627
Cash flow
-12.1%
Cash-on-Cash Return
2.9%
Cap rate
0.4%
Rent to Value Ratio

Active
$585,000
3
bds
|
1
ba
|
1,259
sqft
|
built
1938
814 Gay St, Longmont, CO 80501
$-1,284
Cash flow
-11.5%
Cash-on-Cash Return
3.0%
Cap rate
0.4%
Rent to Value Ratio
Active
$1,200,000
4
bds
|
4
ba
|
3,237
sqft
|
built
1992
2030 Emerald Dr, Longmont, CO 80504
$-2,724
Cash flow
-11.8%
Cash-on-Cash Return
3.0%
Cap rate
0.4%
Rent to Value Ratio
Active
$1,250,000
4
bds
|
3
ba
|
3,686
sqft
|
built
2013
1939 Sundance Dr, Longmont, CO 80504
$-3,831
Cash flow
-16.0%
Cash-on-Cash Return
2.0%
Cap rate
0.3%
Rent to Value Ratio
Active
$675,000
4
bds
|
4
ba
|
2,114
sqft
|
built
1997
1313 Carnation Cir, Longmont, CO 80503
$-1,465
Cash flow
-11.3%
Cash-on-Cash Return
3.1%
Cap rate
0.5%
Rent to Value Ratio

Active
$569,900
3
bds
|
2
ba
|
1,552
sqft
|
built
1910
836 Emery St, Longmont, CO 80501
$-972
Cash flow
-8.9%
Cash-on-Cash Return
3.6%
Cap rate
0.5%
Rent to Value Ratio
Active
$455,000
4
bds
|
2
ba
|
1,444
sqft
|
built
1965
50 Forsyth Dr, Longmont, CO 80504
$-666
Cash flow
-7.6%
Cash-on-Cash Return
3.9%
Cap rate
0.5%
Rent to Value Ratio

Active
$475,000
3
bds
|
2
ba
|
1,422
sqft
|
built
1986
2124 Kay St, Longmont, CO 80501
$-697
Cash flow
-7.7%
Cash-on-Cash Return
3.9%
Cap rate
0.5%
Rent to Value Ratio
Active
$650,000
4
bds
|
4
ba
|
2,810
sqft
|
built
2007
1458 Ajax Way, Longmont, CO 80504
$-1,367
Cash flow
-11.0%
Cash-on-Cash Return
3.2%
Cap rate
0.5%
Rent to Value Ratio
Active
$699,000
5
bds
|
4
ba
|
2,851
sqft
|
built
2016
1435 Rustic Dr, Longmont, CO 80504
$-1,313
Cash flow
-9.8%
Cash-on-Cash Return
3.4%
Cap rate
0.5%
Rent to Value Ratio
Active
$569,900
2
bds
|
2
ba
|
1,957
sqft
|
built
2001
1430 Bluefield Ave, Longmont, CO 80504
$-1,290
Cash flow
-11.8%
Cash-on-Cash Return
3.0%
Cap rate
0.5%
Rent to Value Ratio
Active
$475,000
3
bds
|
3
ba
|
1,470
sqft
|
built
2016
749 Robert St, Longmont, CO 80503
$-943
Cash flow
-10.4%
Cash-on-Cash Return
3.3%
Cap rate
0.6%
Rent to Value Ratio
Active
$600,000
3
bds
|
2
ba
|
1,700
sqft
|
built
1966
12682 Anhawa Ave, Longmont, CO 80503
$-1,041
Cash flow
-9.1%
Cash-on-Cash Return
3.6%
Cap rate
0.5%
Rent to Value Ratio
Active
$680,000
4
bds
|
3
ba
|
2,000
sqft
|
built
1998
1730 Crestone Dr, Longmont, CO 80504
$-1,439
Cash flow
-11.0%
Cash-on-Cash Return
3.1%
Cap rate
0.5%
Rent to Value Ratio
Active
$850,000
5
bds
|
3
ba
|
3,361
sqft
|
built
2001
653 Glenarbor Cir, Longmont, CO 80504
$-2,112
Cash flow
-13.0%
Cash-on-Cash Return
2.7%
Cap rate
0.4%
Rent to Value Ratio

Active
$349,900
2
bds
|
3
ba
|
1,171
sqft
|
built
2000
1601 Great Western Dr, Longmont, CO 80501
$-858
Cash flow
-12.8%
Cash-on-Cash Return
2.7%
Cap rate
0.6%
Rent to Value Ratio
Active
$475,000
3
bds
|
2
ba
|
1,086
sqft
|
built
1962
1247 Linden St, Longmont, CO 80501
$-734
Cash flow
-8.1%
Cash-on-Cash Return
3.8%
Cap rate
0.5%
Rent to Value Ratio
Active
$579,000
3
bds
|
3
ba
|
1,694
sqft
|
built
1997
713 Pendleton Ave, Longmont, CO 80504
$-1,101
Cash flow
-9.9%
Cash-on-Cash Return
3.4%
Cap rate
0.5%
Rent to Value Ratio
Active
$470,000
2
bds
|
1
ba
|
1,008
sqft
|
built
1953
1209 Gay St, Longmont, CO 80501
$-816
Cash flow
-9.1%
Cash-on-Cash Return
3.6%
Cap rate
0.5%
Rent to Value Ratio
Active
$445,000
3
bds
|
3
ba
|
1,561
sqft
|
built
2005
10691 Durango Pl, Longmont, CO 80504
$-662
Cash flow
-7.8%
Cash-on-Cash Return
3.9%
Cap rate
0.6%
Rent to Value Ratio
Active
$349,900
3
bds
|
2
ba
|
1,300
sqft
|
built
2018
804 Summer Hawk Dr, Longmont, CO 80504
$-719
Cash flow
-10.7%
Cash-on-Cash Return
3.2%
Cap rate
0.6%
Rent to Value Ratio
Active
$440,000
3
bds
|
2
ba
|
1,517
sqft
|
built
1969
1534 Mount Evans Dr, Longmont, CO 80504
$-502
Cash flow
-6.0%
Cash-on-Cash Return
4.3%
Cap rate
0.6%
Rent to Value Ratio
Active
$720,000
4
bds
|
3
ba
|
2,577
sqft
|
built
1994
1108 Chokecherry Ln, Longmont, CO 80503
$-1,660
Cash flow
-12.0%
Cash-on-Cash Return
2.9%
Cap rate
0.4%
Rent to Value Ratio