Longmont, CO Investment Properties for Sale
Browse homes for sale and investment properties in Longmont, CO. Refine your search by price, property type, or more.
Best cash flowing properties in Longmont, CO
Active
$173,128
2
bds
|
1
ba
|
802
sqft
|
built
2008
237 Cardinal Way, Longmont, CO 80501
$157
Cash flow
4.7%
Cash-on-Cash Return
6.8%
Cap rate
1.0%
Rent to Value Ratio
Active under contract
$250,000
3
bds
|
2
ba
|
975
sqft
|
built
1979
2241 Dexter Dr, Longmont, CO 80501
$-242
Cash flow
-5.1%
Cash-on-Cash Return
4.5%
Cap rate
0.7%
Rent to Value Ratio
37 out of 43 properties for sale in Longmont, CO
Limited Results Shown
Create a free account, or log in to reveal all property listings and enjoy the complete experience.
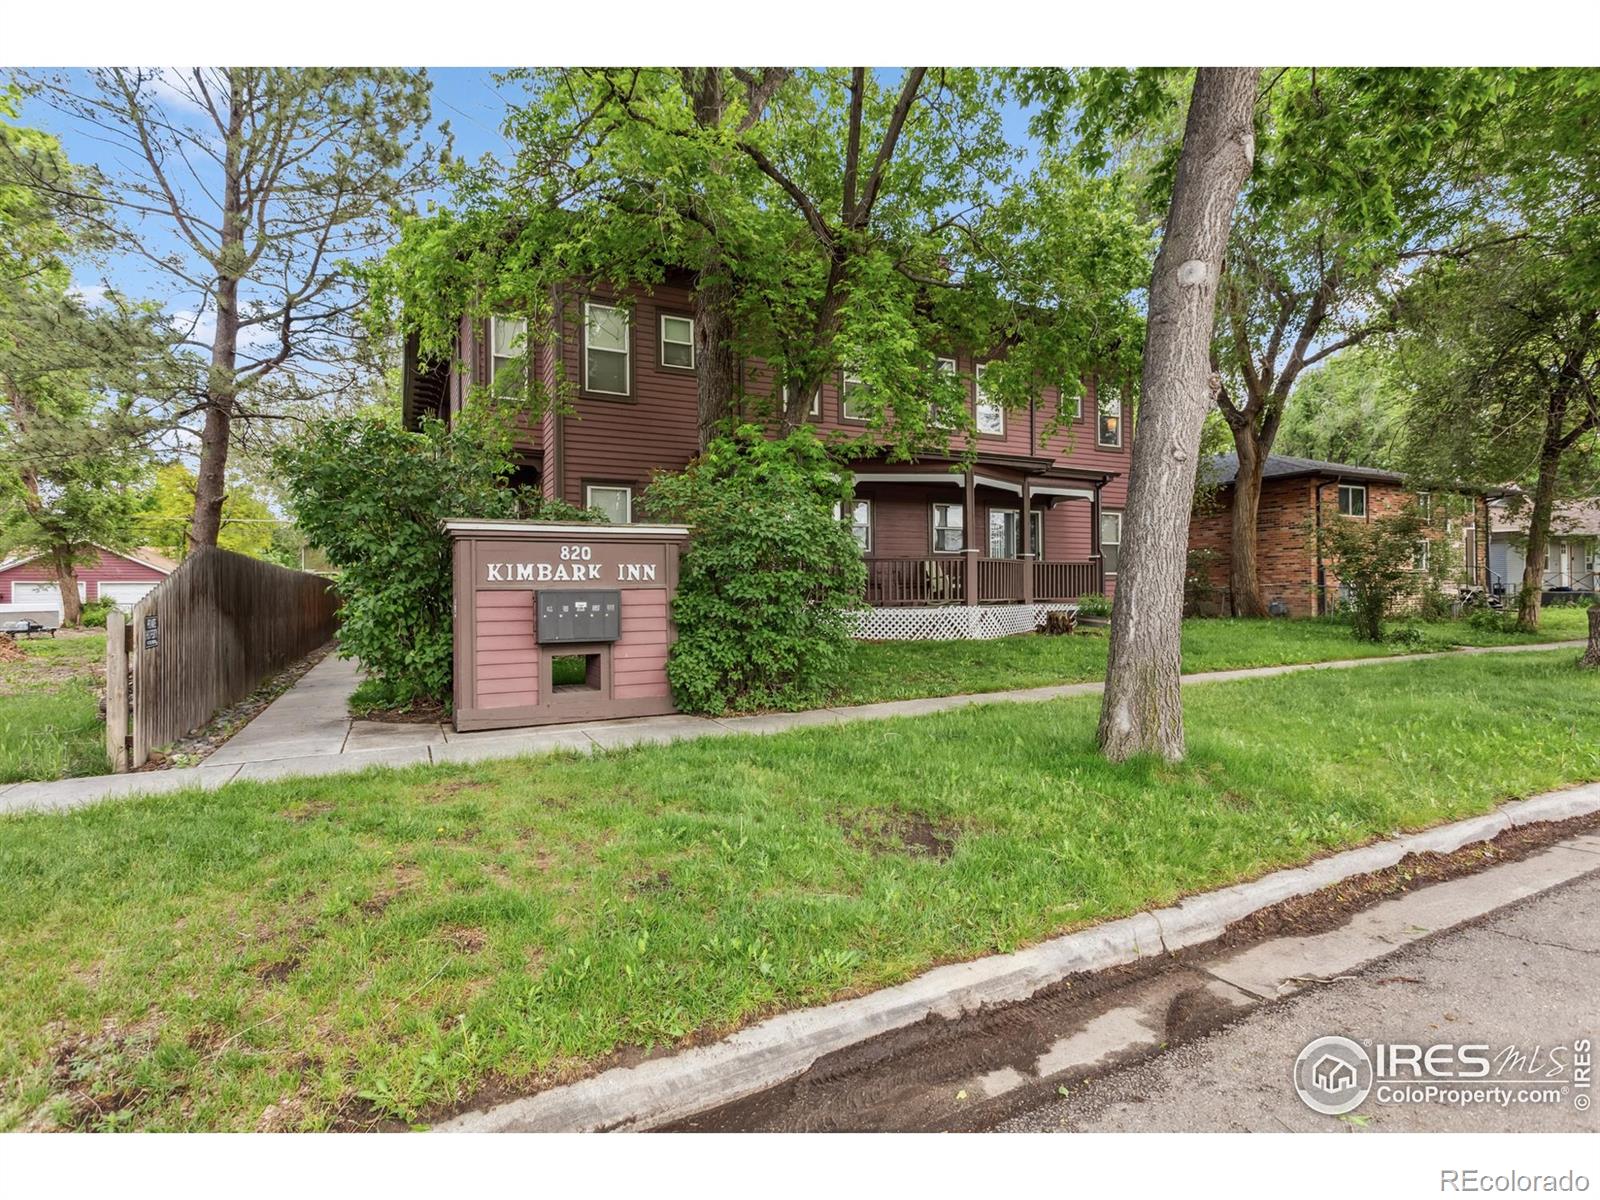
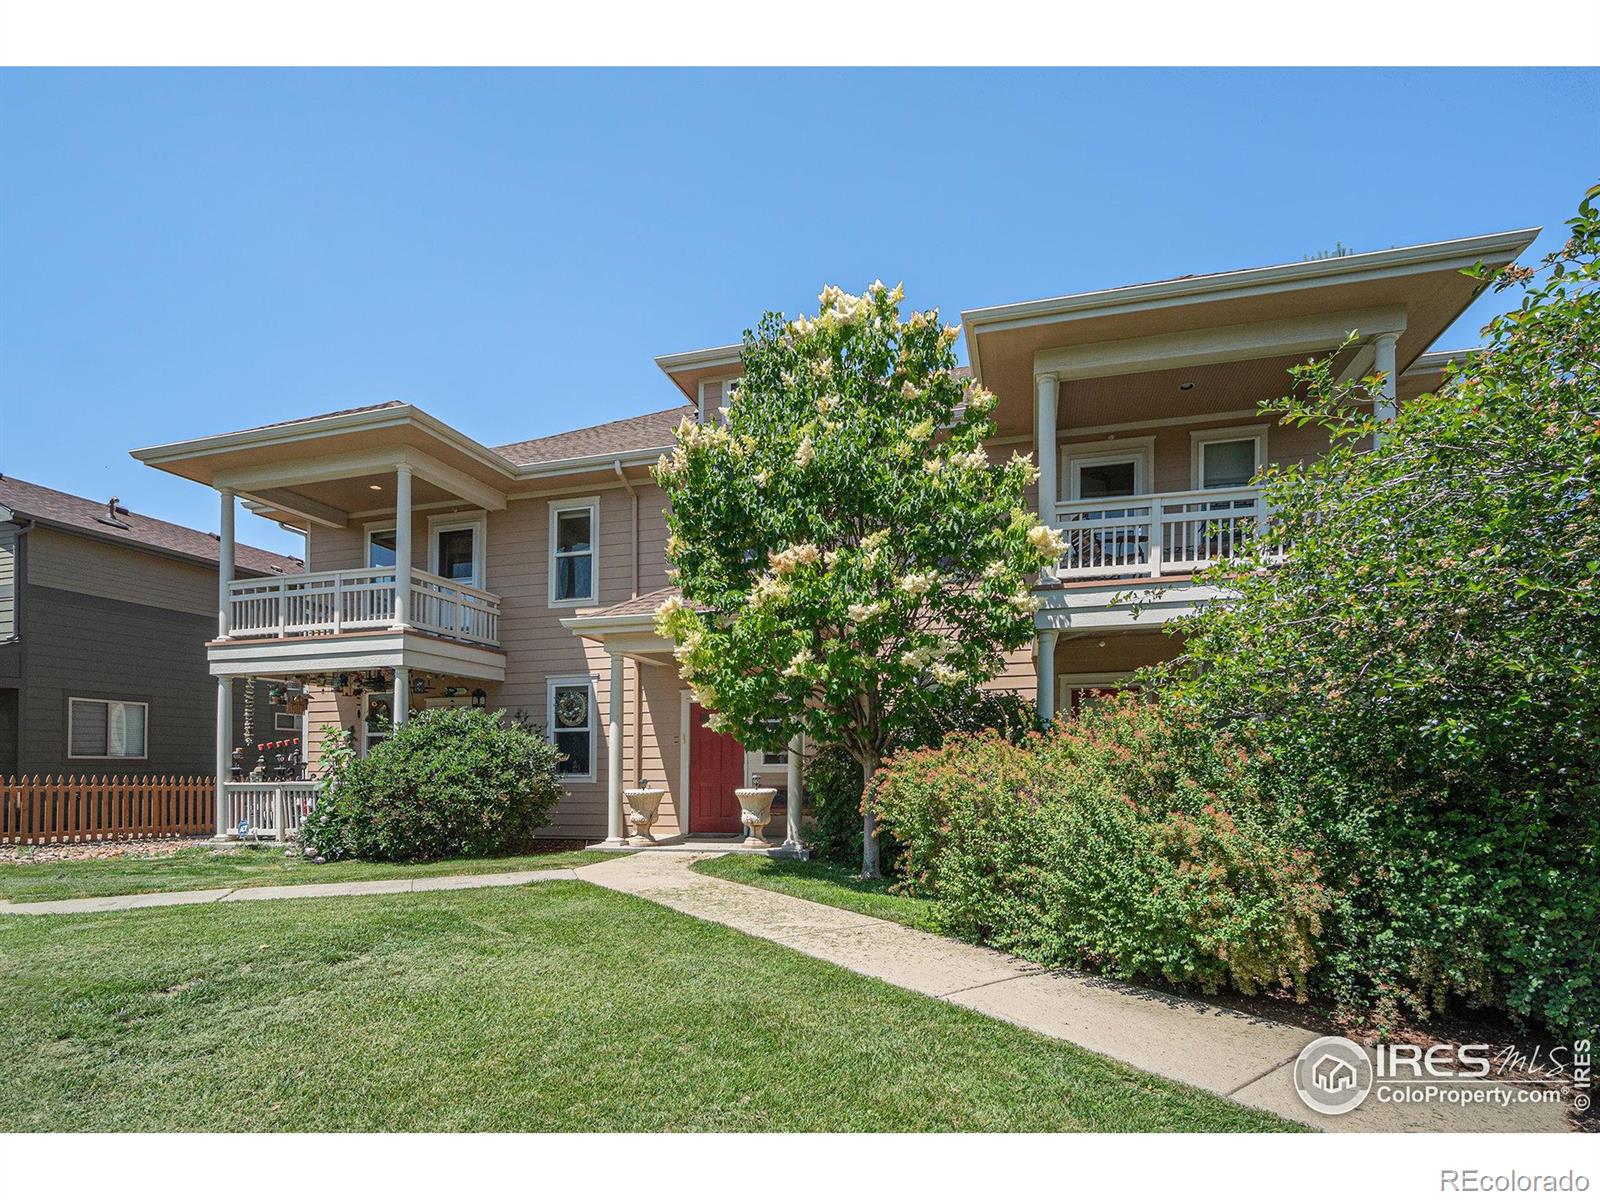
Active
$379,900
2
bds
|
2
ba
|
1,282
sqft
|
built
1999
820 Kimbark St, Longmont, CO 80501
$-662
Cash flow
-9.1%
Cash-on-Cash Return
3.6%
Cap rate
0.6%
Rent to Value Ratio
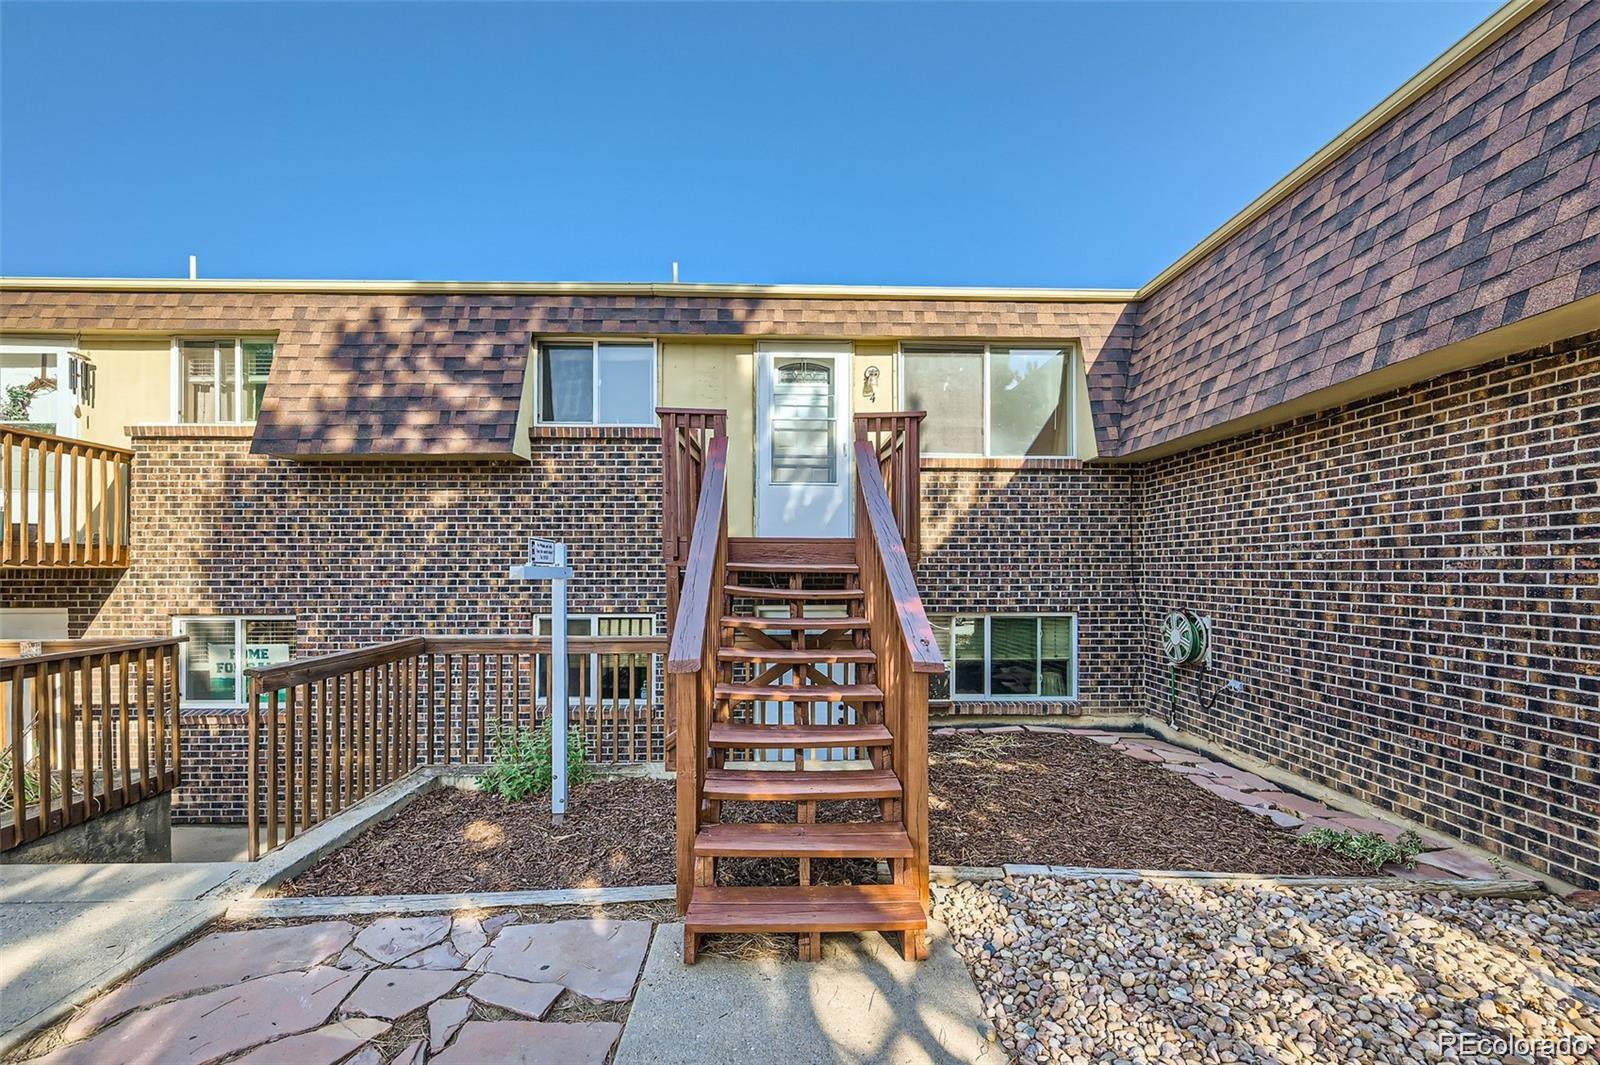
Active
$325,000
2
bds
|
2
ba
|
1,264
sqft
|
built
1983
225 E 8th Ave, Longmont, CO 80504
$-855
Cash flow
-13.7%
Cash-on-Cash Return
2.5%
Cap rate
0.6%
Rent to Value Ratio
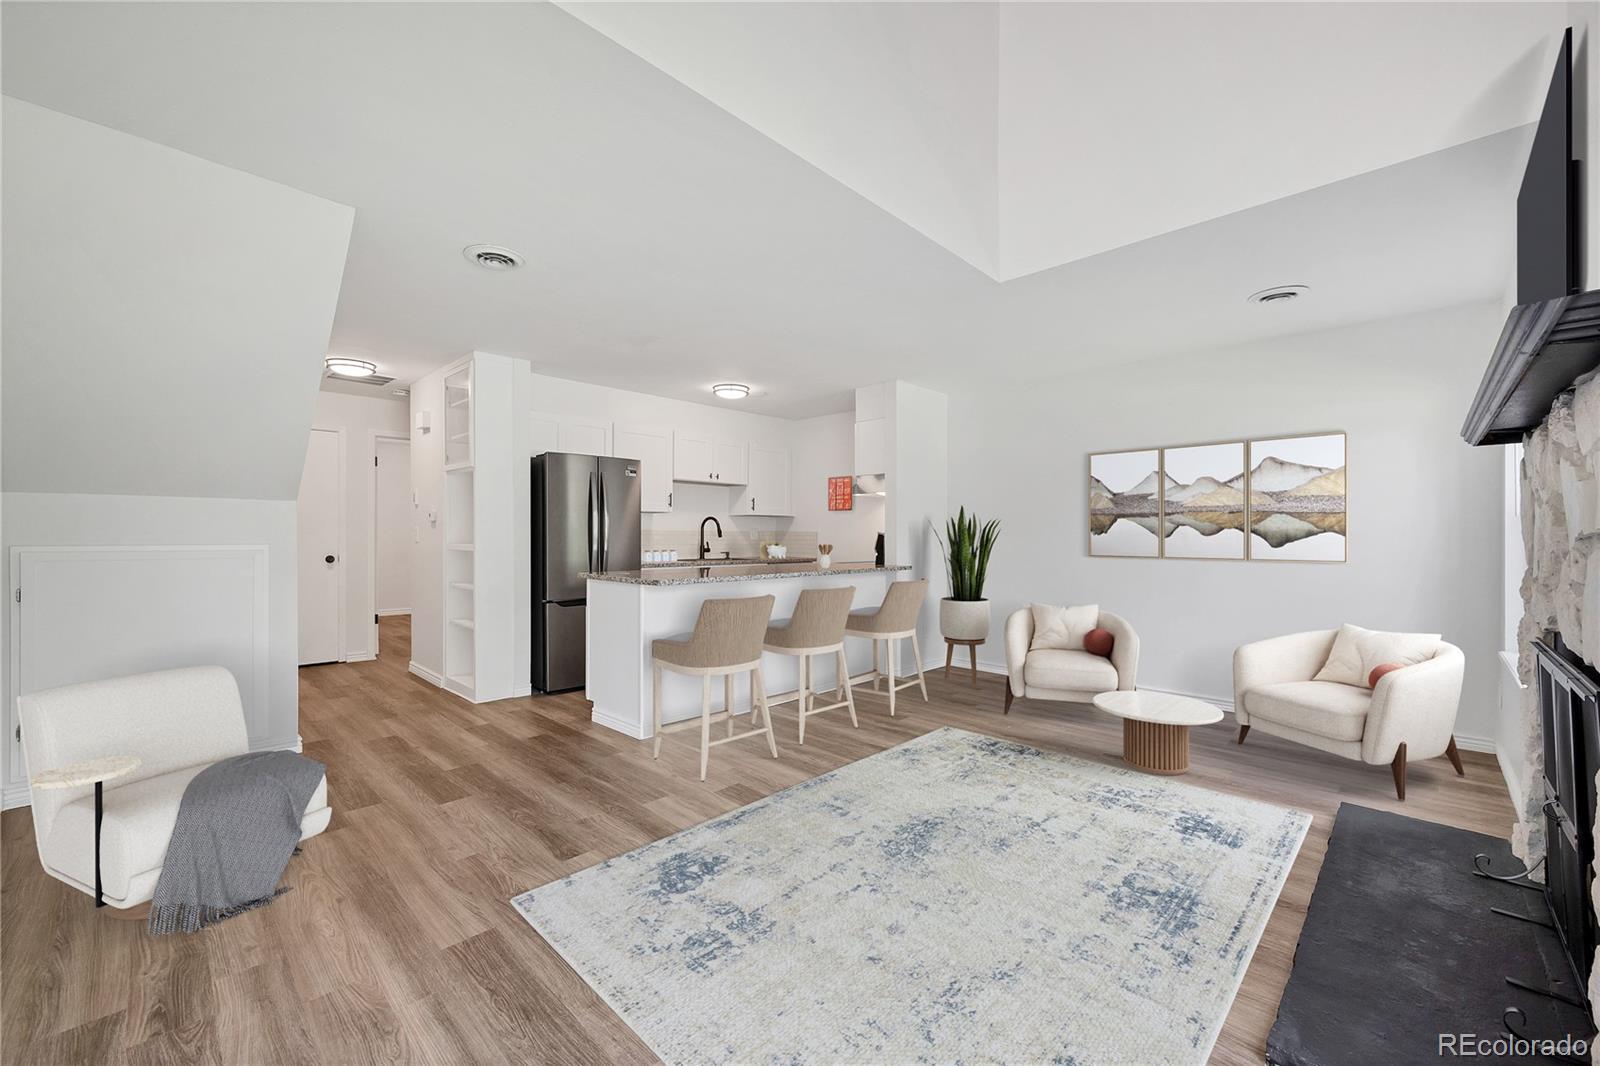
Active
$337,000
2
bds
|
2
ba
|
1,047
sqft
|
built
2009
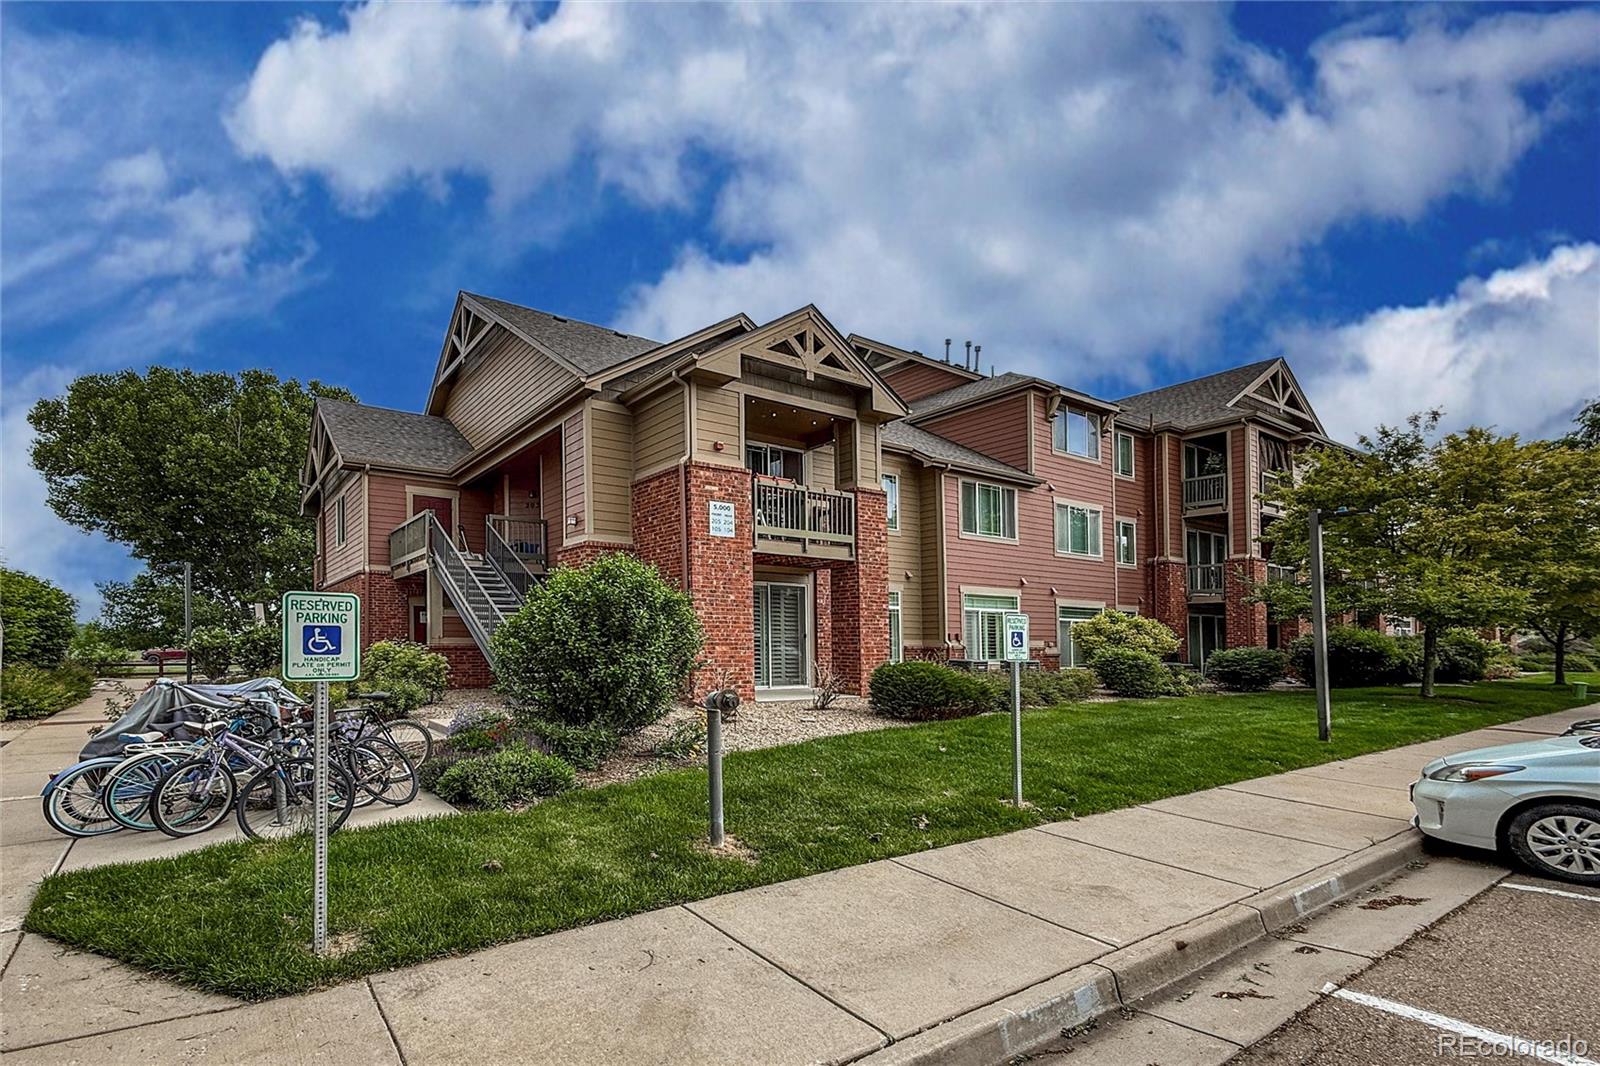
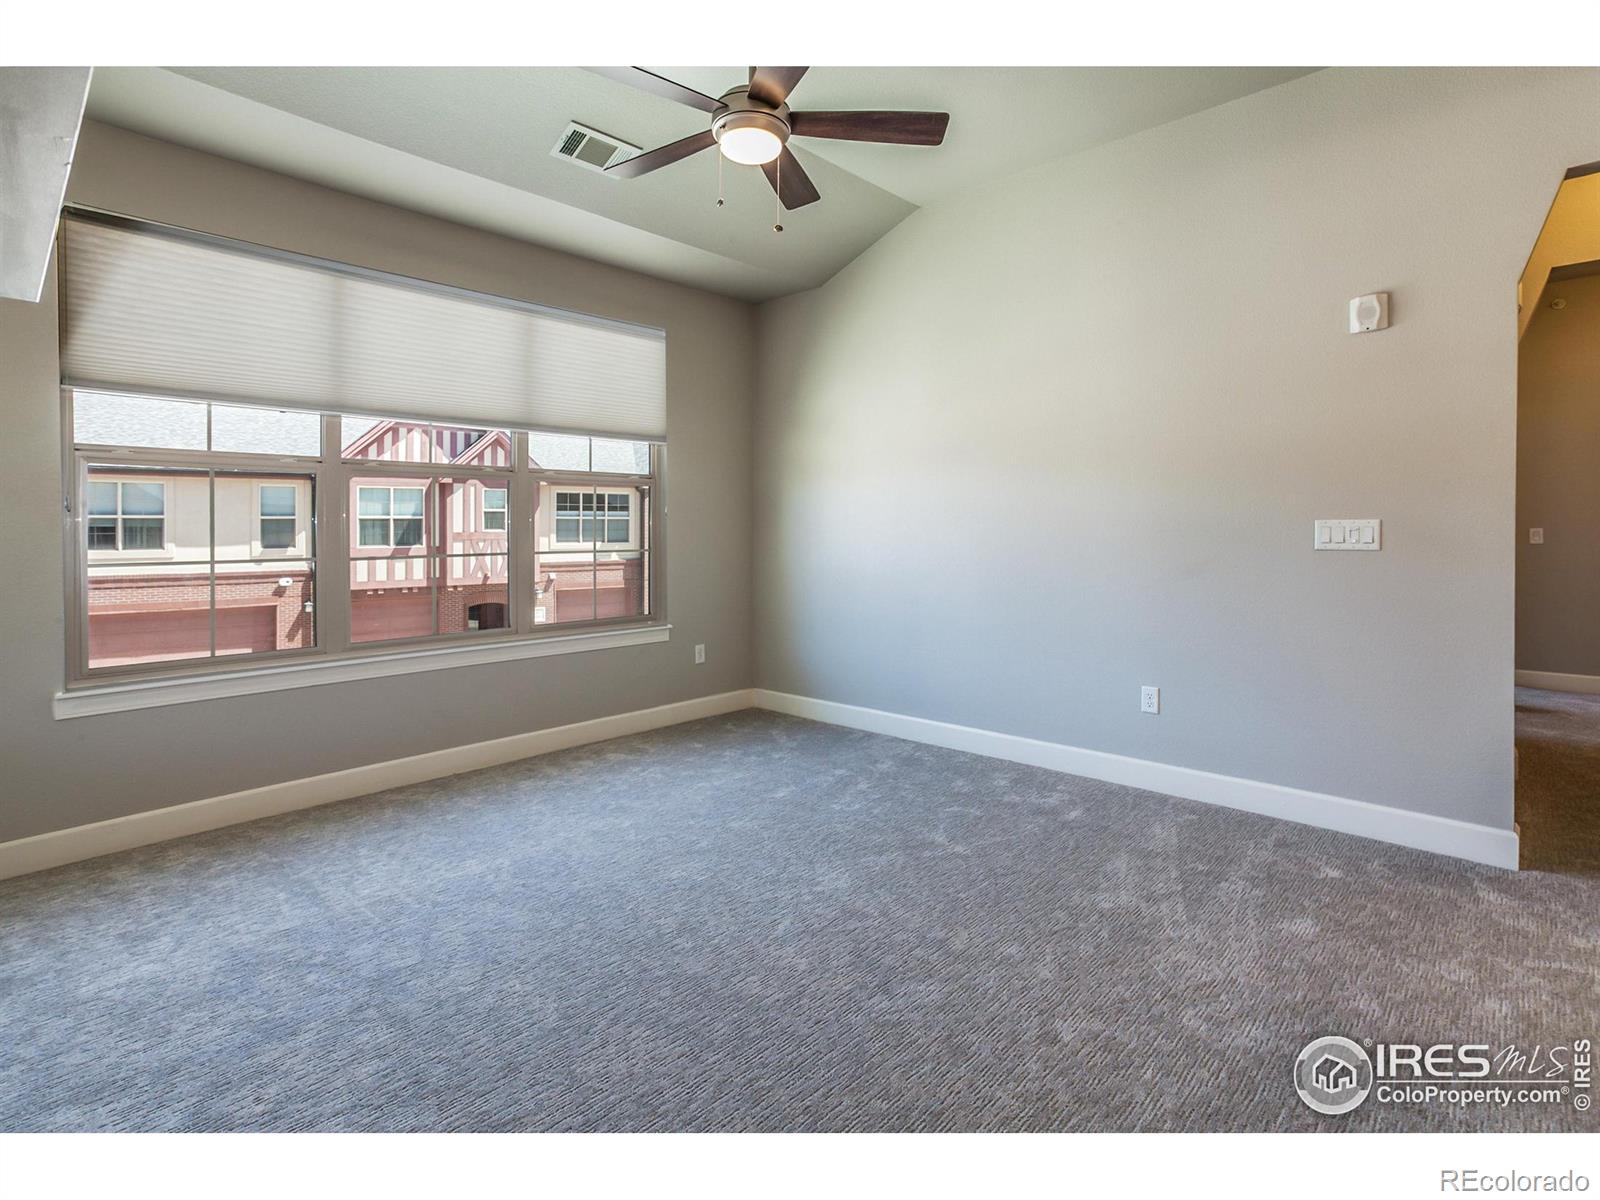
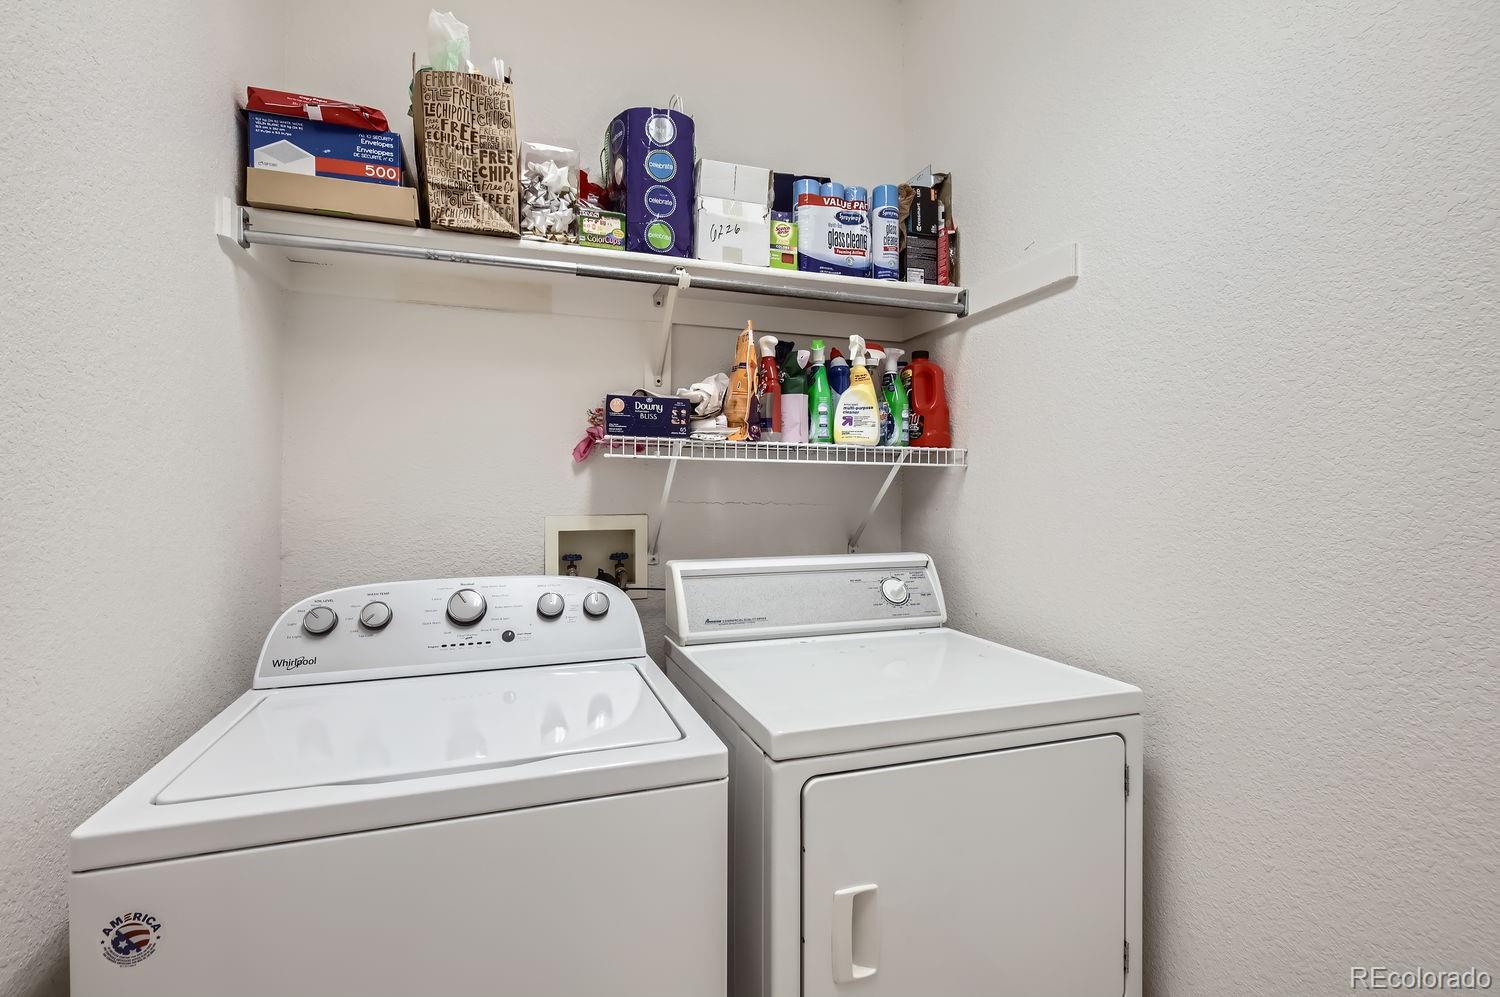
804 Summer Hawk Dr, Longmont, CO 80504
$-621
Cash flow
-9.6%
Cash-on-Cash Return
3.5%
Cap rate
0.7%
Rent to Value Ratio
Active
$512,500
2
bds
|
1
ba
|
1,272
sqft
|
built
2017
1379 Charles Dr, Longmont, CO 80503
$-1,551
Cash flow
-15.8%
Cash-on-Cash Return
2.0%
Cap rate
0.5%
Rent to Value Ratio
Active
$394,900
2
bds
|
2
ba
|
1,282
sqft
|
built
1999
820 Kimbark St, Longmont, CO 80501
$-665
Cash flow
-8.8%
Cash-on-Cash Return
3.7%
Cap rate
0.6%
Rent to Value Ratio
Active
$280,000
3
bds
|
2
ba
|
1,130
sqft
|
built
1973
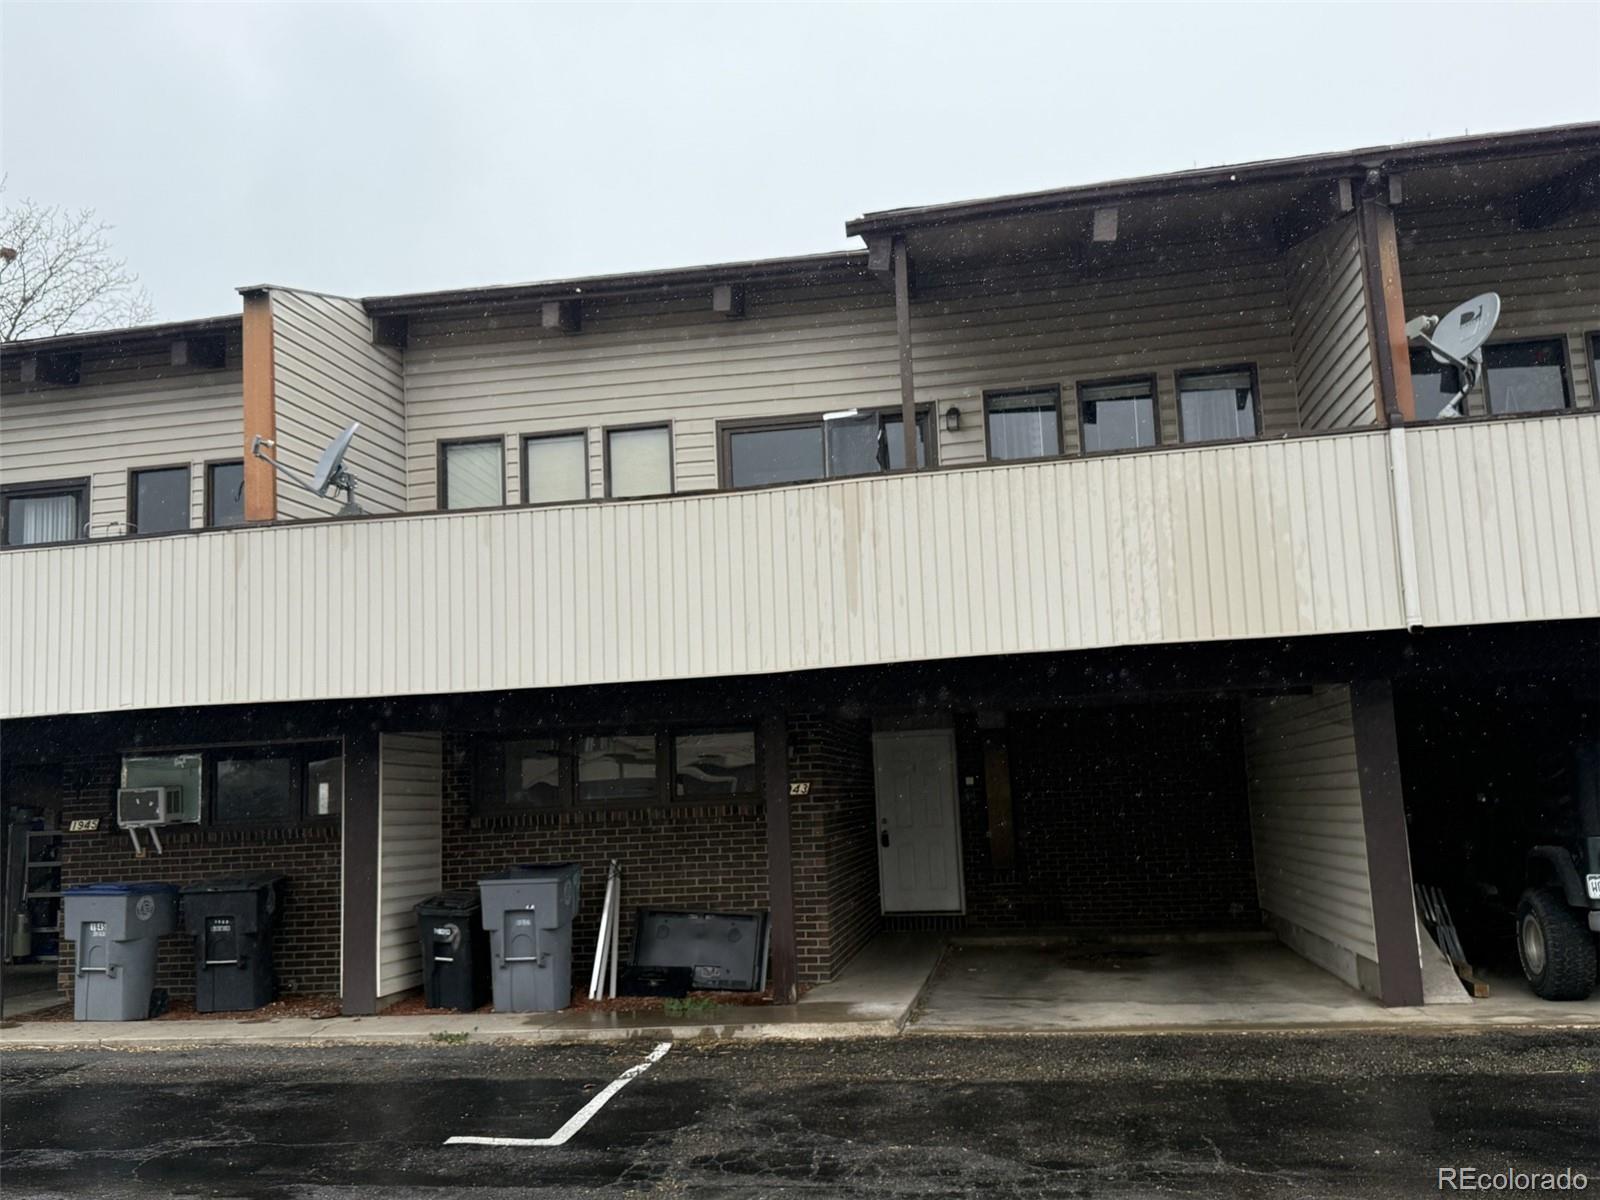
1943 Meadow Dr, Longmont, CO 80501
$-444
Cash flow
-8.3%
Cash-on-Cash Return
3.8%
Cap rate
0.6%
Rent to Value Ratio
Active
$380,000
2
bds
|
3
ba
|
1,218
sqft
|
built
2000
1601 Great Western Dr, Longmont, CO 80501
$-911
Cash flow
-12.5%
Cash-on-Cash Return
2.8%
Cap rate
0.6%
Rent to Value Ratio
Active
$260,000
2
bds
|
2
ba
|
997
sqft
|
built
1997
50 19th Ave, Longmont, CO 80501
$-264
Cash flow
-5.3%
Cash-on-Cash Return
4.5%
Cap rate
0.8%
Rent to Value Ratio
Active
$173,128
2
bds
|
1
ba
|
802
sqft
|
built
2008
237 Cardinal Way, Longmont, CO 80501
$157
Cash flow
4.7%
Cash-on-Cash Return
6.8%
Cap rate
1.0%
Rent to Value Ratio
Active under contract
$250,000
3
bds
|
2
ba
|
975
sqft
|
built
1979
2241 Dexter Dr, Longmont, CO 80501
$-242
Cash flow
-5.1%
Cash-on-Cash Return
4.5%
Cap rate
0.7%
Rent to Value Ratio
Active
$399,000
3
bds
|
3
ba
|
1,321
sqft
|
built
2002
818 S Terry St, Longmont, CO 80501
$-763
Cash flow
-10.0%
Cash-on-Cash Return
3.4%
Cap rate
0.6%
Rent to Value Ratio
Active
$399,999
1
bds
|
1
ba
|
883
sqft
|
built
2005
2018 Ionosphere St, Longmont, CO 80504
$-805
Cash flow
-10.5%
Cash-on-Cash Return
3.3%
Cap rate
0.6%
Rent to Value Ratio
Active
$367,500
1
bds
|
1
ba
|
538
sqft
|
built
2004
801 Confidence Dr, Longmont, CO 80504
$-1,115
Cash flow
-15.8%
Cash-on-Cash Return
2.0%
Cap rate
0.5%
Rent to Value Ratio
Active
$284,900
1
bds
|
1
ba
|
816
sqft
|
built
1981
400 Emery St, Longmont, CO 80501
$-602
Cash flow
-11.0%
Cash-on-Cash Return
3.1%
Cap rate
0.6%
Rent to Value Ratio
Active
$395,000
2
bds
|
1
ba
|
720
sqft
|
built
1910
103 Sunset St, Longmont, CO 80501
$-665
Cash flow
-8.8%
Cash-on-Cash Return
3.7%
Cap rate
0.6%
Rent to Value Ratio
Active
$400,000
2
bds
|
2
ba
|
1,267
sqft
|
built
2005
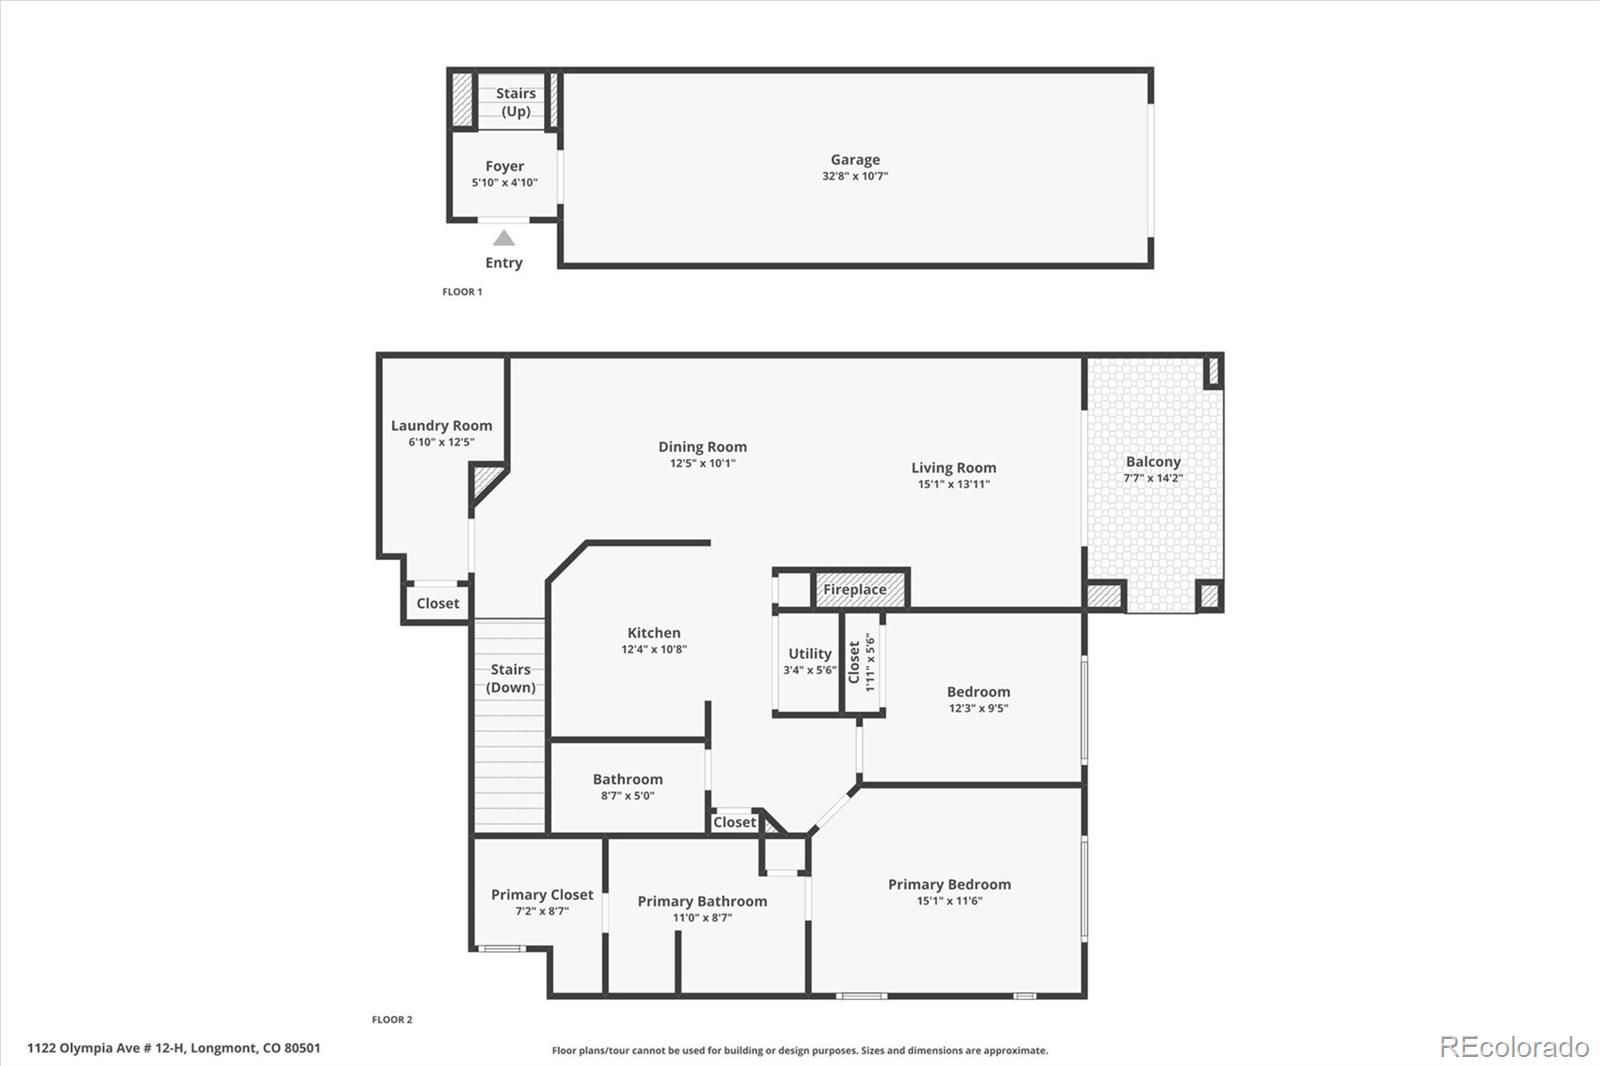
1122 Olympia Ave, Longmont, CO 80504
$-837
Cash flow
-10.9%
Cash-on-Cash Return
3.2%
Cap rate
0.6%
Rent to Value Ratio
Active
$364,000
3
bds
|
2
ba
|
1,300
sqft
|
built
2018
804 Summer Hawk Dr, Longmont, CO 80504
$-786
Cash flow
-11.3%
Cash-on-Cash Return
3.1%
Cap rate
0.6%
Rent to Value Ratio
Active
$299,900
2
bds
|
1
ba
|
939
sqft
|
built
2007
804 Summer Hawk Dr, Longmont, CO 80504
$-575
Cash flow
-10.0%
Cash-on-Cash Return
3.4%
Cap rate
0.7%
Rent to Value Ratio
Active
$479,700
3
bds
|
2
ba
|
1,573
sqft
|
built
2023
350 High Point Dr, Longmont, CO 80504
$-1,060
Cash flow
-11.5%
Cash-on-Cash Return
3.0%
Cap rate
0.5%
Rent to Value Ratio
Active
$230,000
2
bds
|
2
ba
|
1,043
sqft
|
built
1983
50 19th Ave, Longmont, CO 80501
$-308
Cash flow
-7.0%
Cash-on-Cash Return
4.1%
Cap rate
0.8%
Rent to Value Ratio
Active
$524,999
2
bds
|
2
ba
|
1,276
sqft
|
built
2014
2360 Santa Fe Dr, Longmont, CO 80504
$-1,401
Cash flow
-13.9%
Cash-on-Cash Return
2.5%
Cap rate
0.5%
Rent to Value Ratio
Active
$355,900
2
bds
|
2
ba
|
1,007
sqft
|
built
1976
2208 Emery St, Longmont, CO 80501
$-577
Cash flow
-8.5%
Cash-on-Cash Return
3.7%
Cap rate
0.6%
Rent to Value Ratio
Active
$949,900
4
bds
|
3
ba
|
2,636
sqft
|
built
2022
751 W Grange Ct, Longmont, CO 80503
$-3,089
Cash flow
-17.0%
Cash-on-Cash Return
1.8%
Cap rate
0.4%
Rent to Value Ratio
Active
$449,000
3
bds
|
4
ba
|
1,605
sqft
|
built
2016
1320 Kestrel Ln, Longmont, CO 80501
$-919
Cash flow
-10.7%
Cash-on-Cash Return
3.2%
Cap rate
0.6%
Rent to Value Ratio
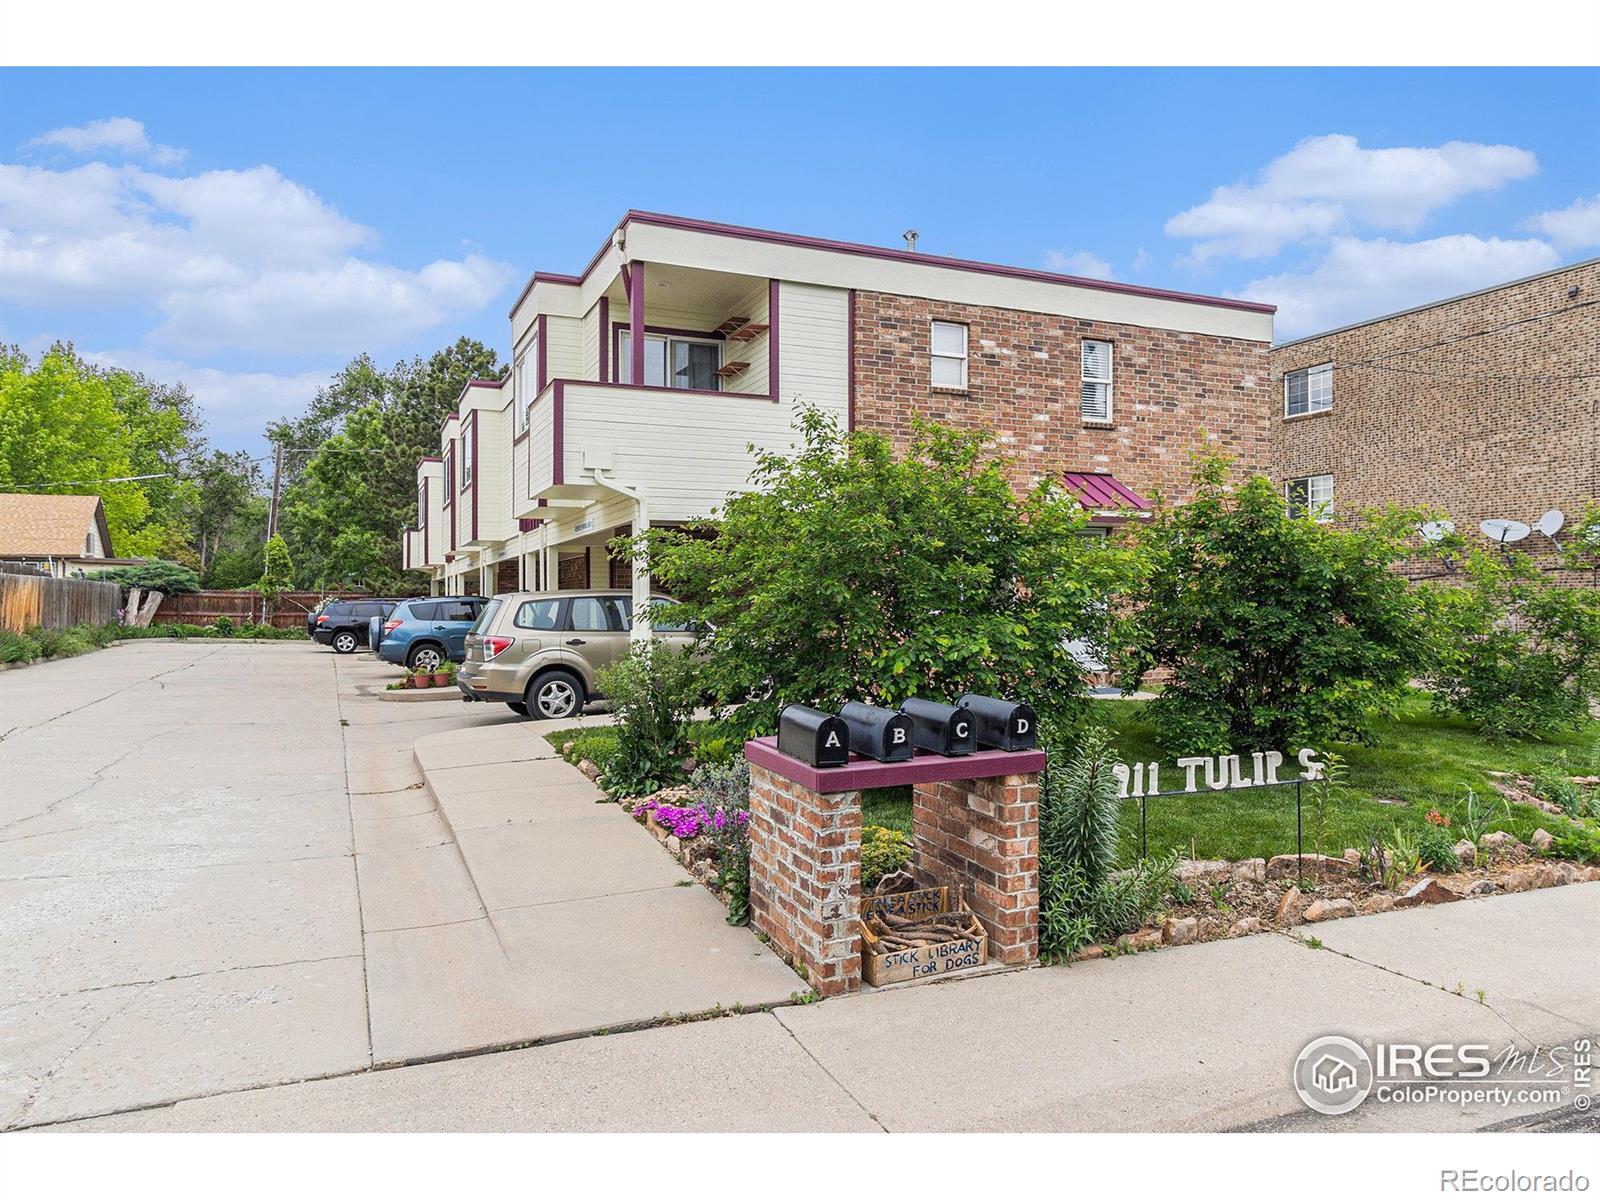
Active
$345,000
2
bds
|
2
ba
|
1,196
sqft
|
built
1998
911 Tulip St, Longmont, CO 80501
$-472
Cash flow
-7.1%
Cash-on-Cash Return
4.0%
Cap rate
0.6%
Rent to Value Ratio
Active
$443,000
3
bds
|
4
ba
|
1,605
sqft
|
built
2019
1240 Wren Ct, Longmont, CO 80501
$-1,038
Cash flow
-12.2%
Cash-on-Cash Return
2.9%
Cap rate
0.5%
Rent to Value Ratio
Active
$460,000
1
bds
|
2
ba
|
1,062
sqft
|
built
2004
801 Confidence Dr, Longmont, CO 80504
$-1,113
Cash flow
-12.6%
Cash-on-Cash Return
2.8%
Cap rate
0.5%
Rent to Value Ratio
Active
$369,000
4
bds
|
3
ba
|
1,492
sqft
|
built
1985
2249 Emery St, Longmont, CO 80501
$-814
Cash flow
-11.5%
Cash-on-Cash Return
3.0%
Cap rate
0.6%
Rent to Value Ratio
Active
$445,000
3
bds
|
4
ba
|
1,675
sqft
|
built
2019
1240 Wren Ct, Longmont, CO 80501
$-898
Cash flow
-10.5%
Cash-on-Cash Return
3.3%
Cap rate
0.6%
Rent to Value Ratio
Active
$419,000
2
bds
|
3
ba
|
1,178
sqft
|
built
2019
1240 Wren Ct, Longmont, CO 80501
$-774
Cash flow
-9.6%
Cash-on-Cash Return
3.5%
Cap rate
0.6%
Rent to Value Ratio
Active
$345,000
3
bds
|
2
ba
|
1,300
sqft
|
built
2018
804 Summer Hawk Dr, Longmont, CO 80504
$-827
Cash flow
-12.5%
Cash-on-Cash Return
2.8%
Cap rate
0.6%
Rent to Value Ratio
Active
$379,900
2
bds
|
2
ba
|
1,414
sqft
|
built
2010
2405 Calais Dr, Longmont, CO 80504
$-752
Cash flow
-10.3%
Cash-on-Cash Return
3.3%
Cap rate
0.6%
Rent to Value Ratio
Active
$359,000
3
bds
|
2
ba
|
1,320
sqft
|
built
2017
804 Summer Hawk Dr, Longmont, CO 80504
$-682
Cash flow
-9.9%
Cash-on-Cash Return
3.4%
Cap rate
0.6%
Rent to Value Ratio
Active
$538,000
2
bds
|
2
ba
|
1,292
sqft
|
built
2005
2018 Ionosphere St, Longmont, CO 80504
$-1,545
Cash flow
-15.0%
Cash-on-Cash Return
2.2%
Cap rate
0.5%
Rent to Value Ratio
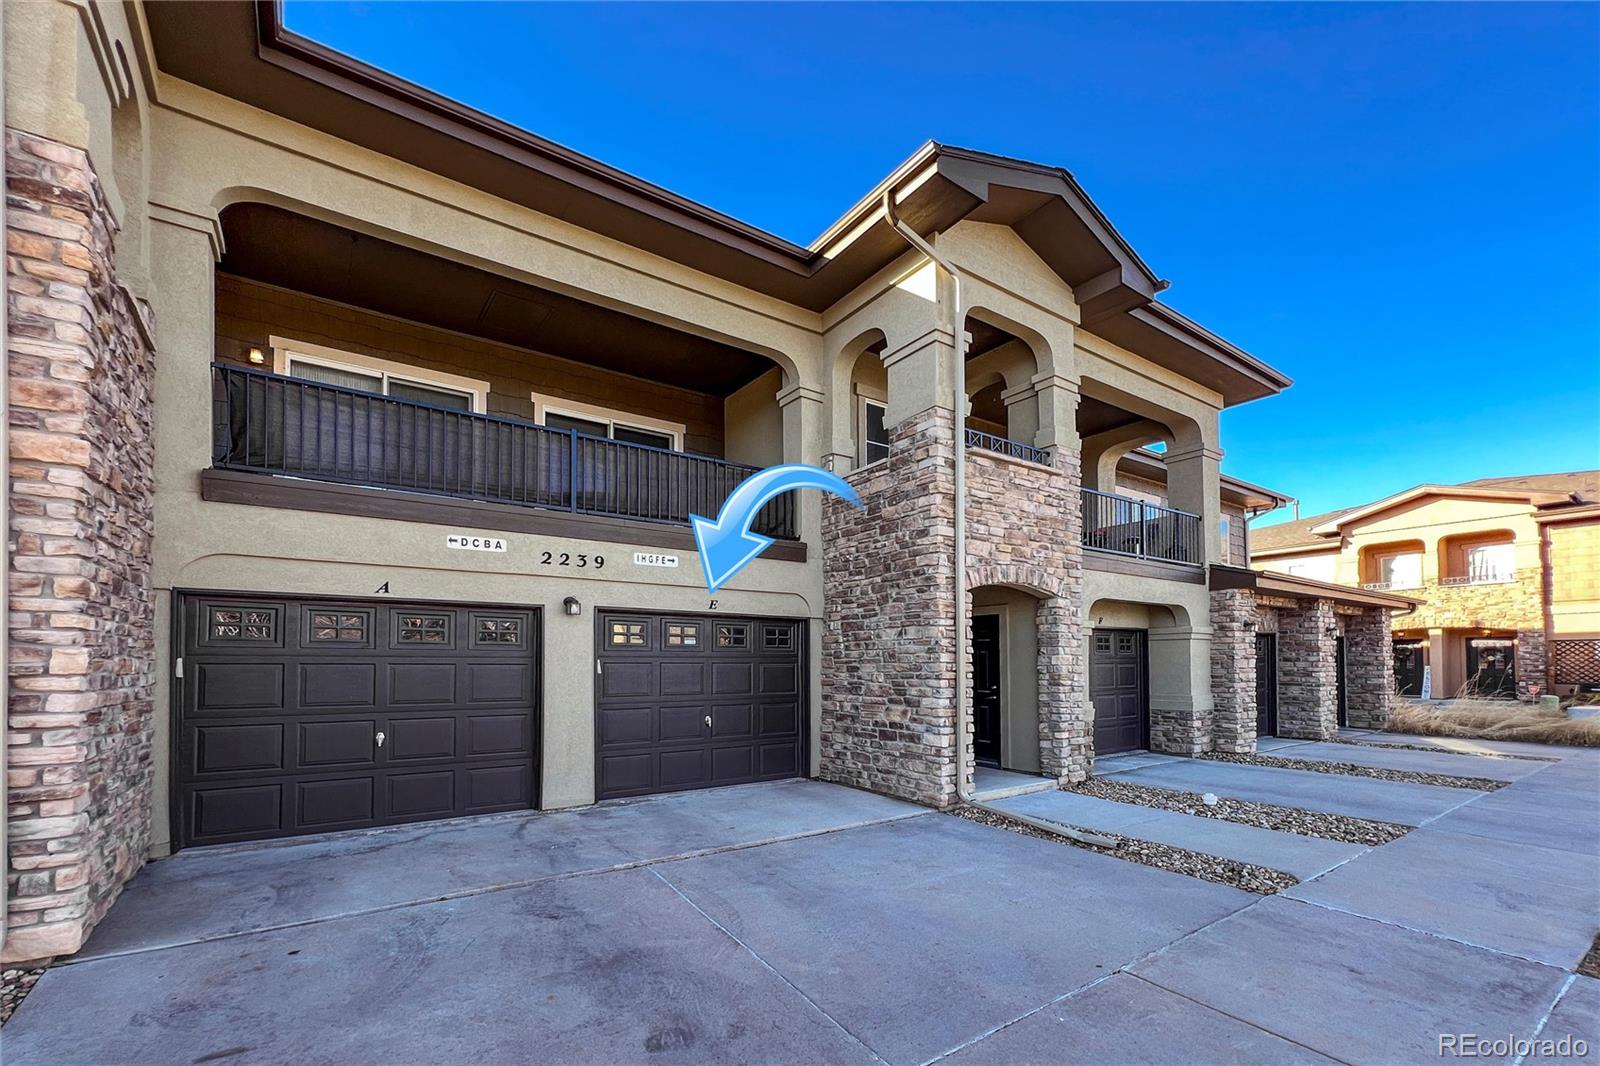
Pending
$405,000
2
bds
|
2
ba
|
1,201
sqft
|
built
2005
2239 Calais Dr, Longmont, CO 80504
$-855
Cash flow
-11.0%
Cash-on-Cash Return
3.1%
Cap rate
0.6%
Rent to Value Ratio
Active
$399,000
3
bds
|
4
ba
|
1,748
sqft
|
built
2000
438 N Parkside Dr, Longmont, CO 80501
$-862
Cash flow
-11.3%
Cash-on-Cash Return
3.1%
Cap rate
0.6%
Rent to Value Ratio
Active
$366,000
2
bds
|
2
ba
|
1,112
sqft
|
built
1995
2213 Emery St, Longmont, CO 80501
$-854
Cash flow
-12.2%
Cash-on-Cash Return
2.9%
Cap rate
0.5%
Rent to Value Ratio