Louisville, CO Investment Properties for Sale
Browse homes for sale and investment properties in Louisville, CO. Refine your search by price, property type, or more.
Best cash flowing properties in Louisville, CO
Active
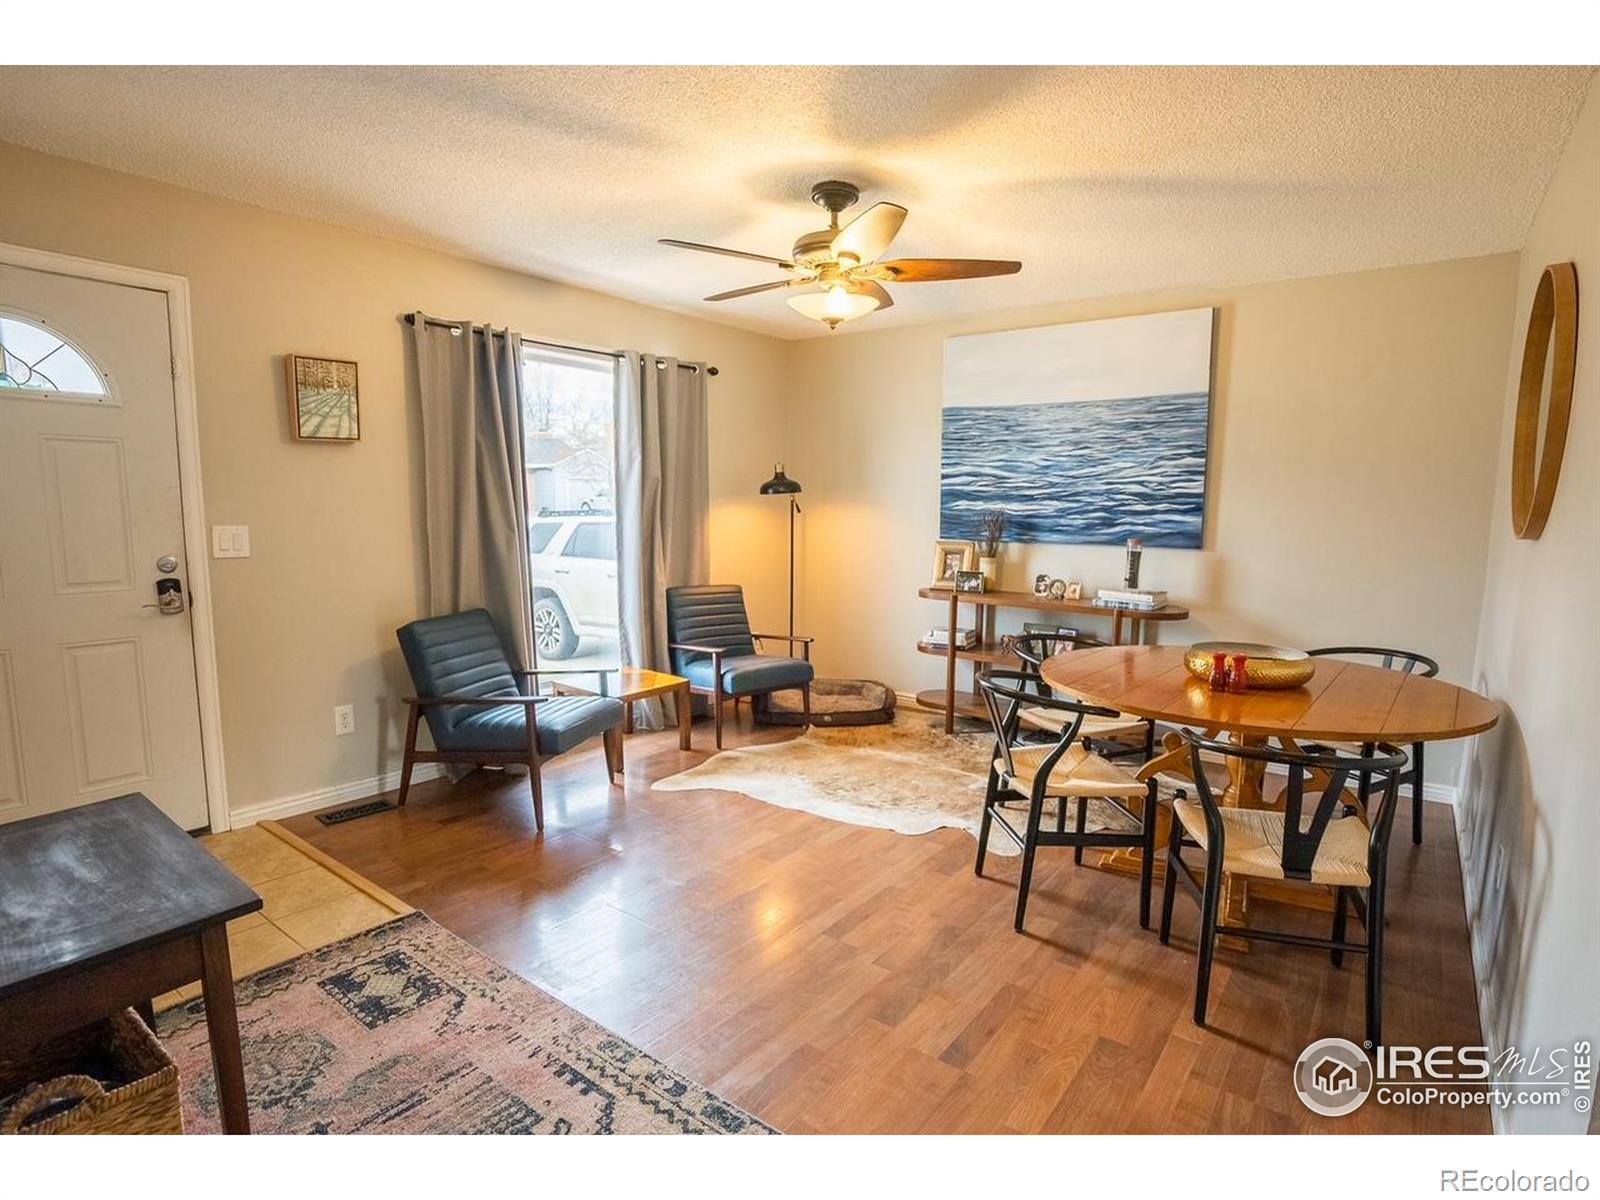
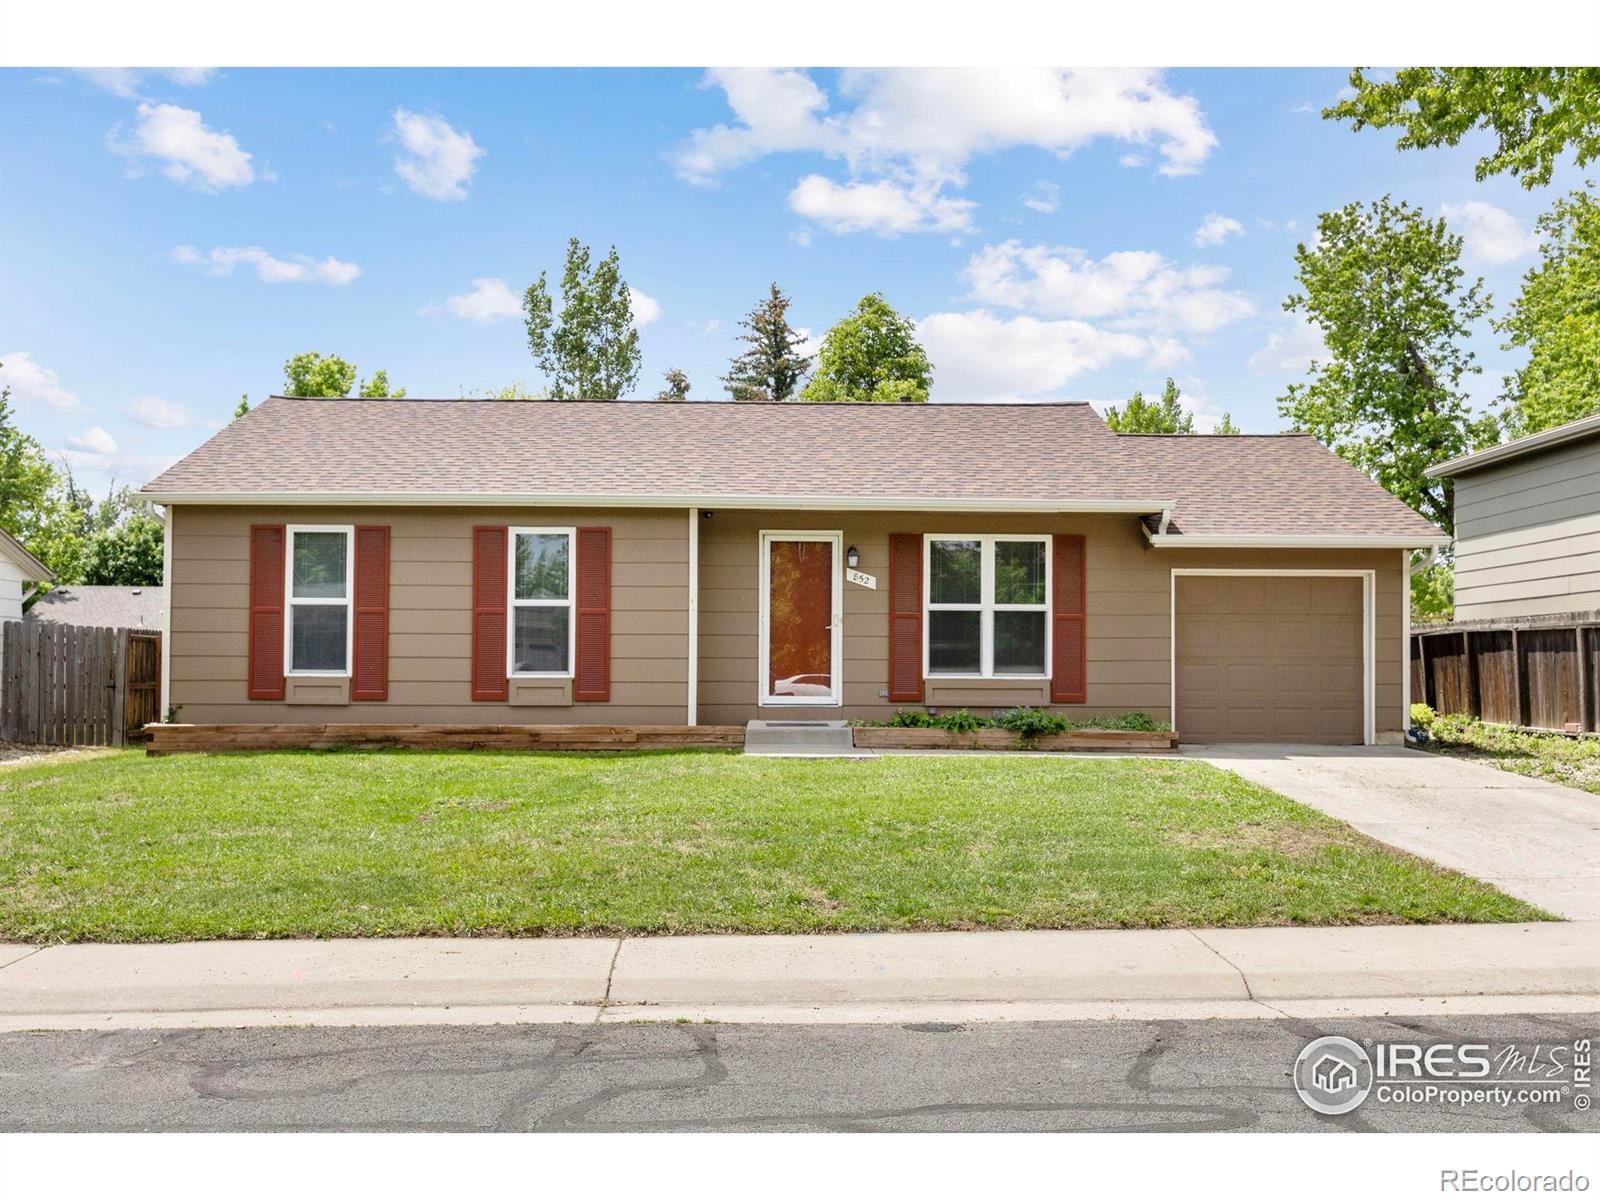
$250,000
2
bds
|
1
ba
|
901
sqft
|
built
1972
1611 Garfield Ave, Louisville, CO 80027
$-409
Cash flow
-8.5%
Cash-on-Cash Return
4.3%
Cap rate
0.8%
Rent to Value Ratio
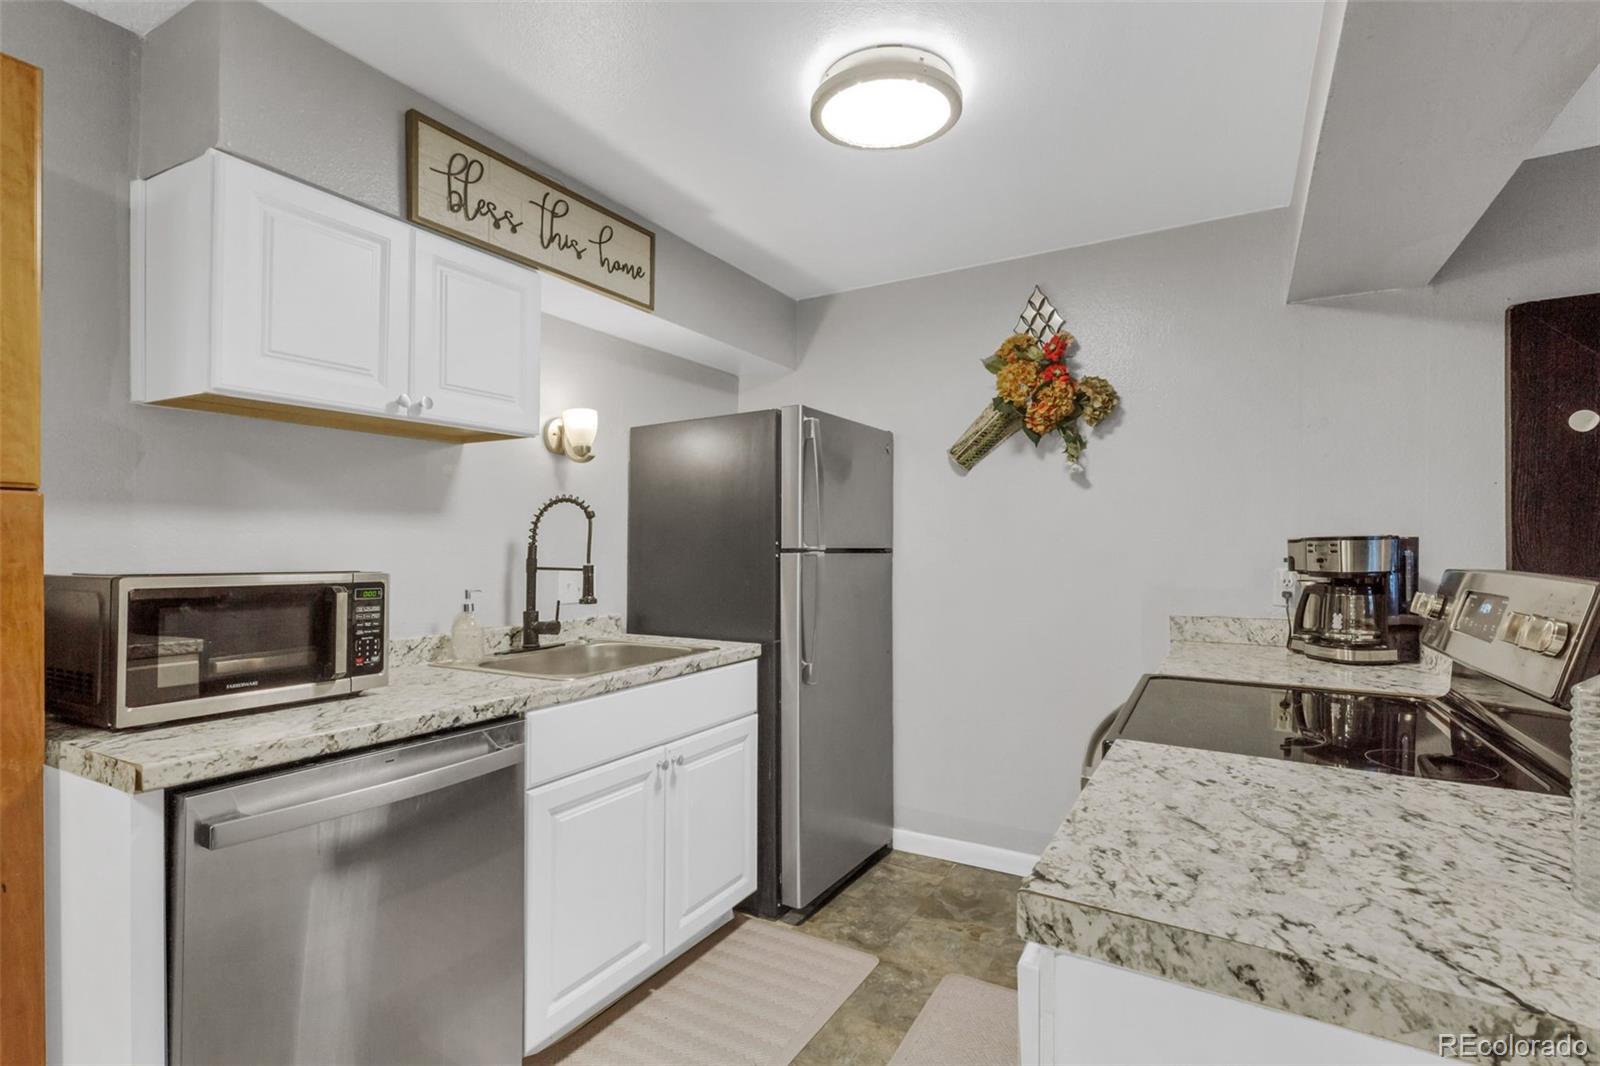
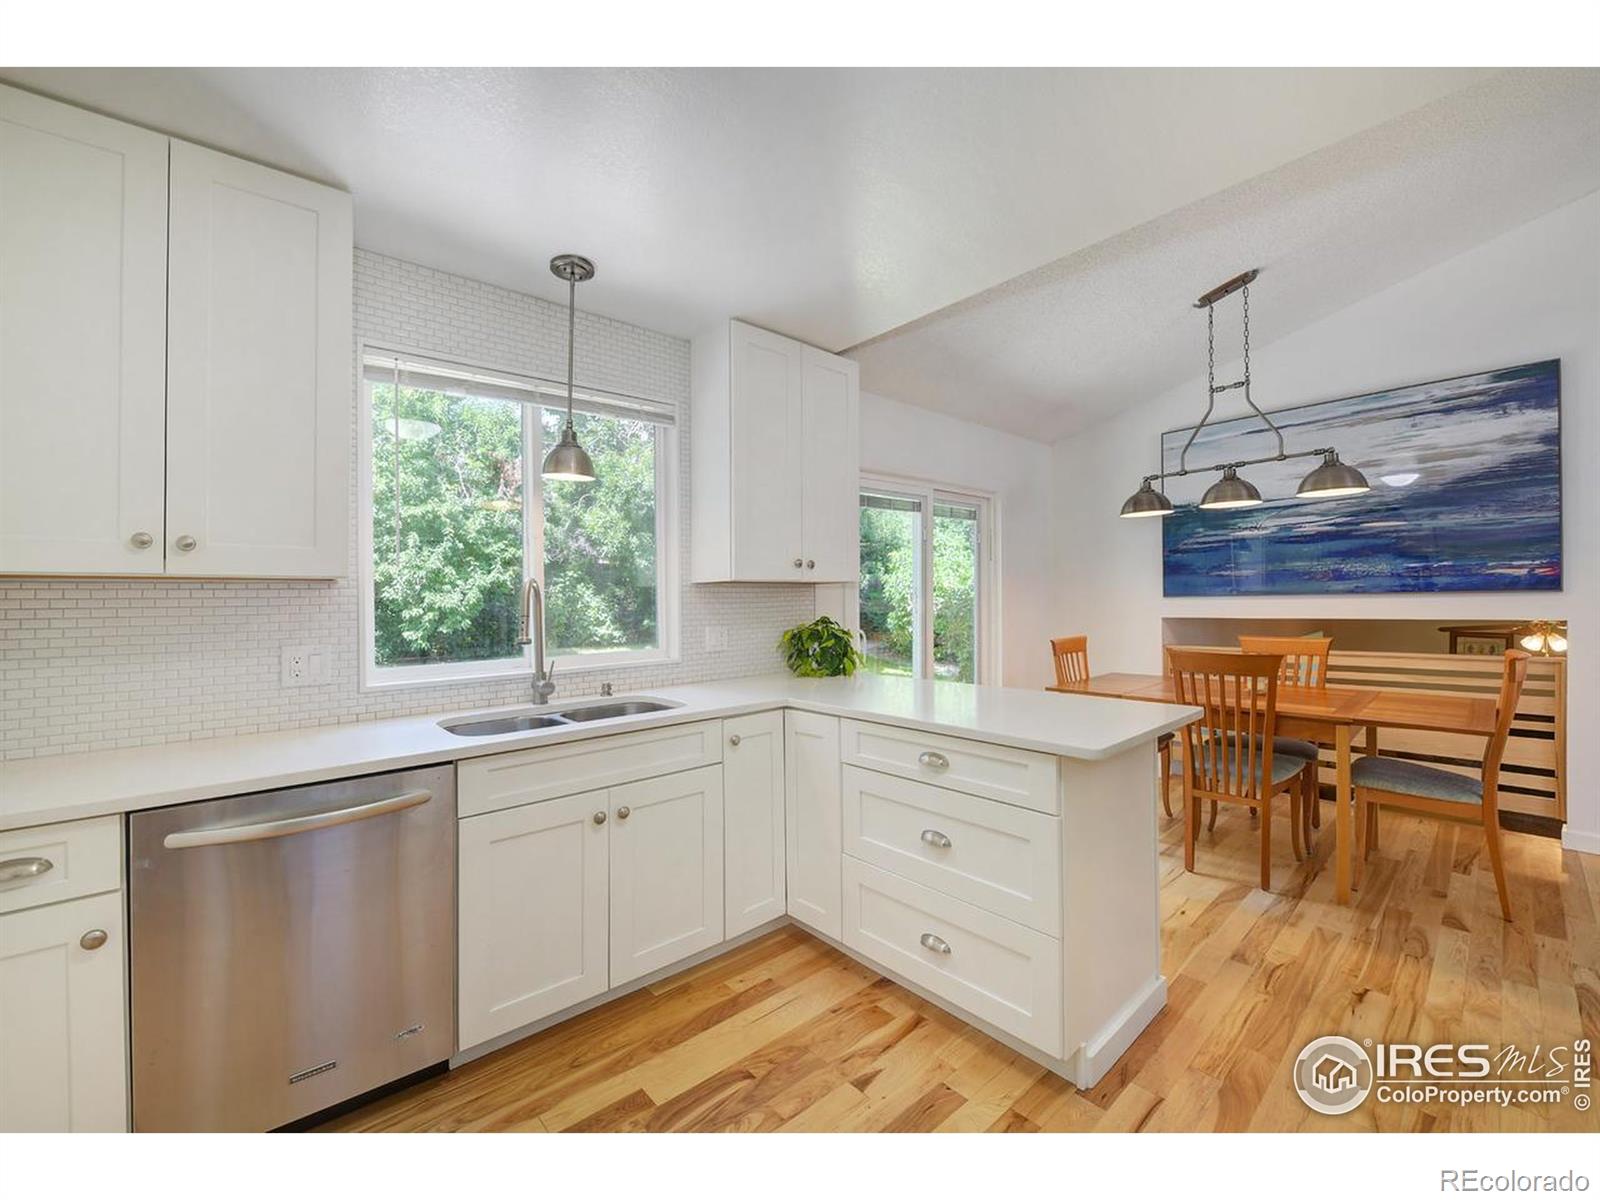
Active
$415,000
3
bds
|
3
ba
|
1,536
sqft
|
built
1985
104 Pheasant Run, Louisville, CO 80027
$-1,024
Cash flow
-12.9%
Cash-on-Cash Return
3.3%
Cap rate
0.6%
Rent to Value Ratio
72 out of 78 properties for sale in Louisville, CO
Limited Results Shown
Create a free account, or log in to reveal all property listings and enjoy the complete experience.

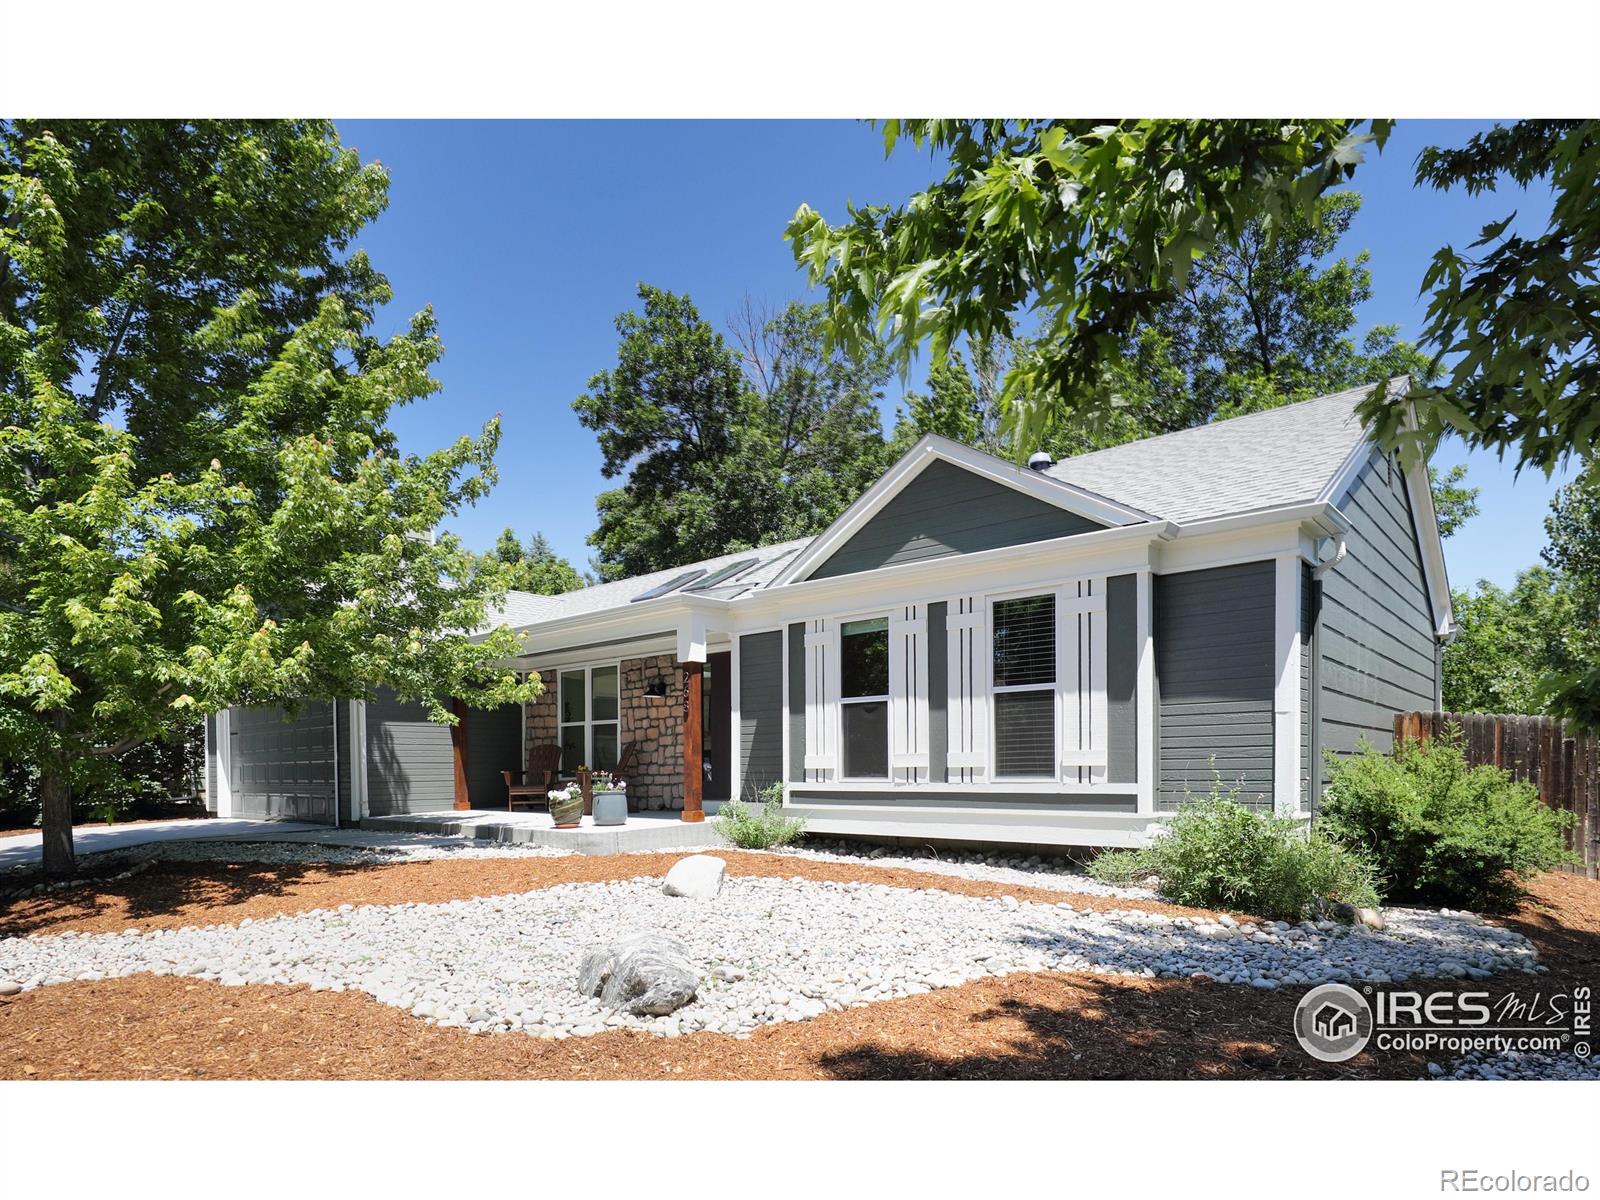
Active
$1,790,000
4
bds
|
5
ba
|
4,418
sqft
|
built
1991
567 N Manorwood Ln, Louisville, CO 80027
$-7,152
Cash flow
-20.8%
Cash-on-Cash Return
1.5%
Cap rate
0.3%
Rent to Value Ratio
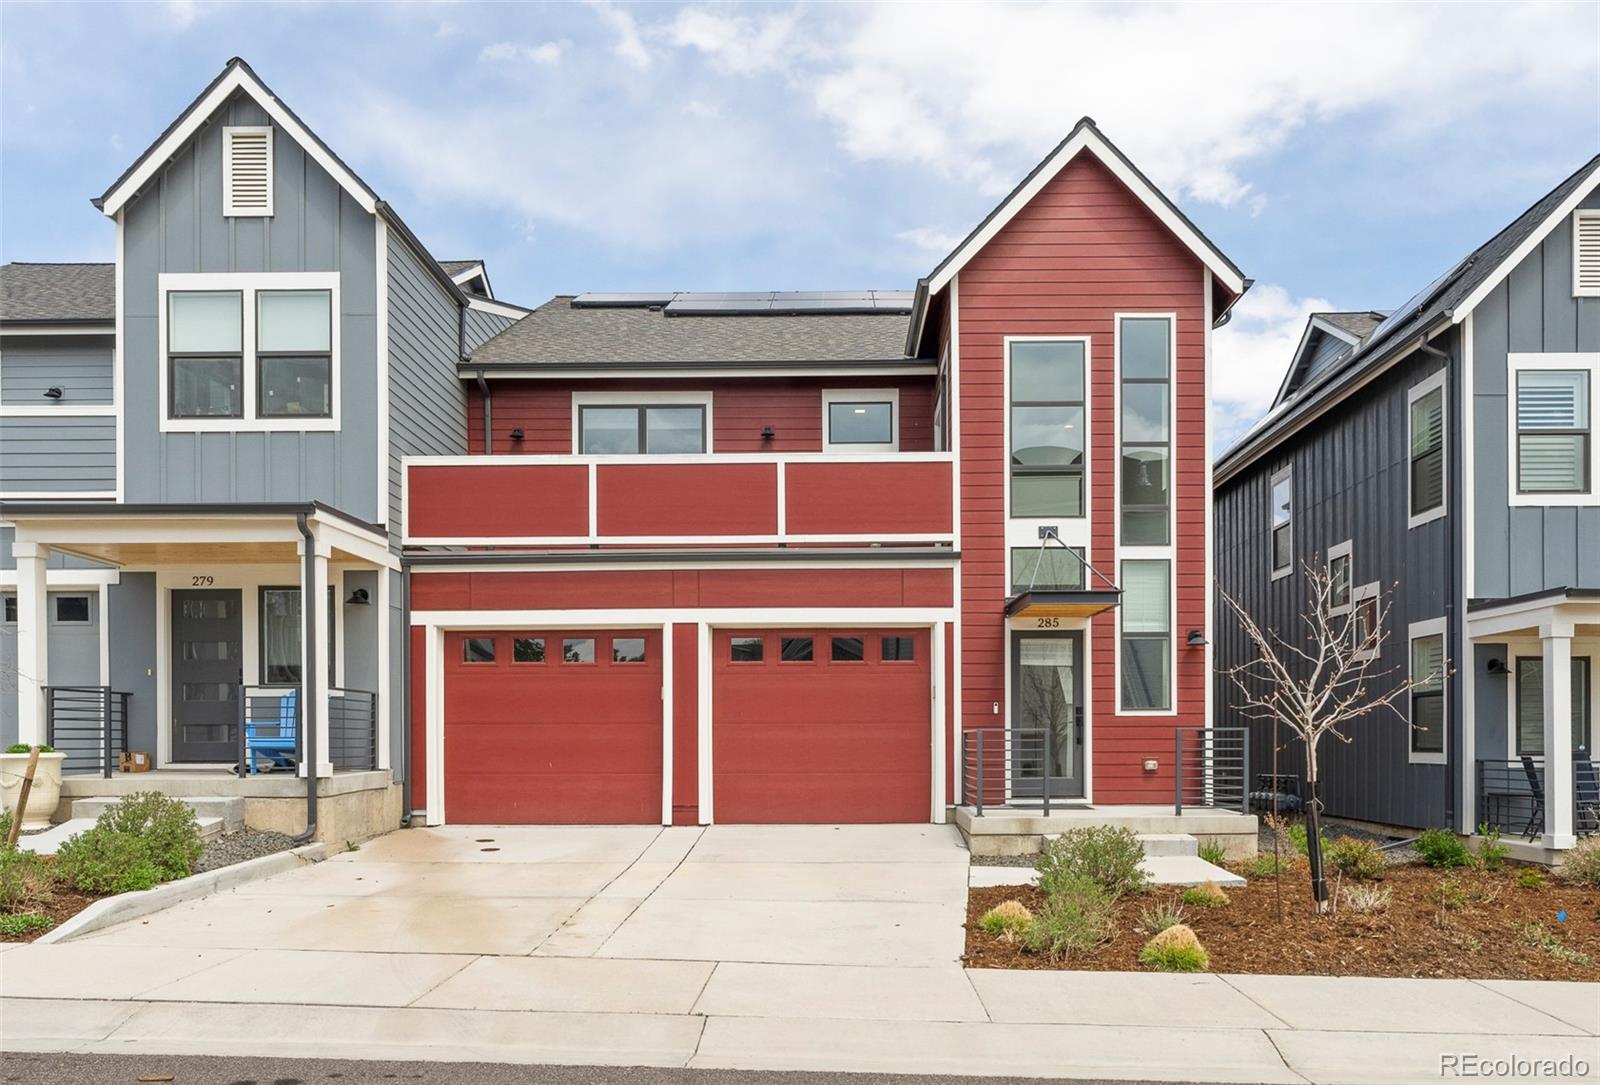
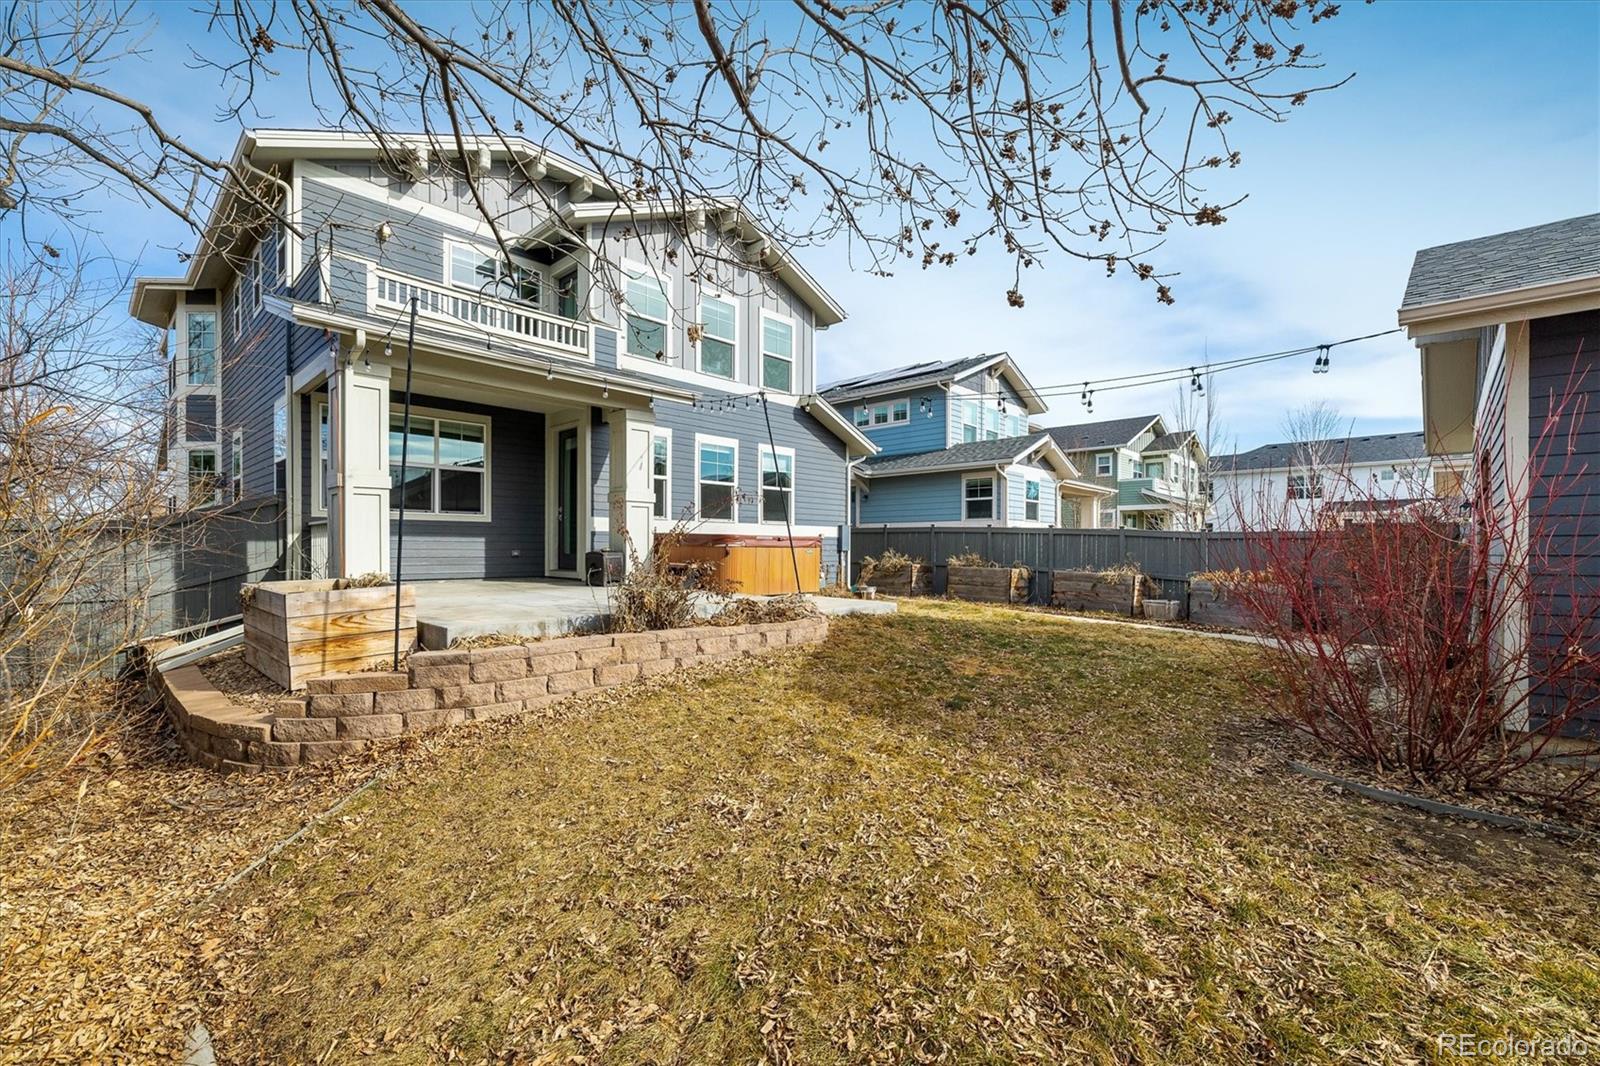
Active
$1,075,000
4
bds
|
5
ba
|
3,353
sqft
|
built
2020
285 Clementina St, Louisville, CO 80027
$-3,159
Cash flow
-15.3%
Cash-on-Cash Return
2.8%
Cap rate
0.5%
Rent to Value Ratio
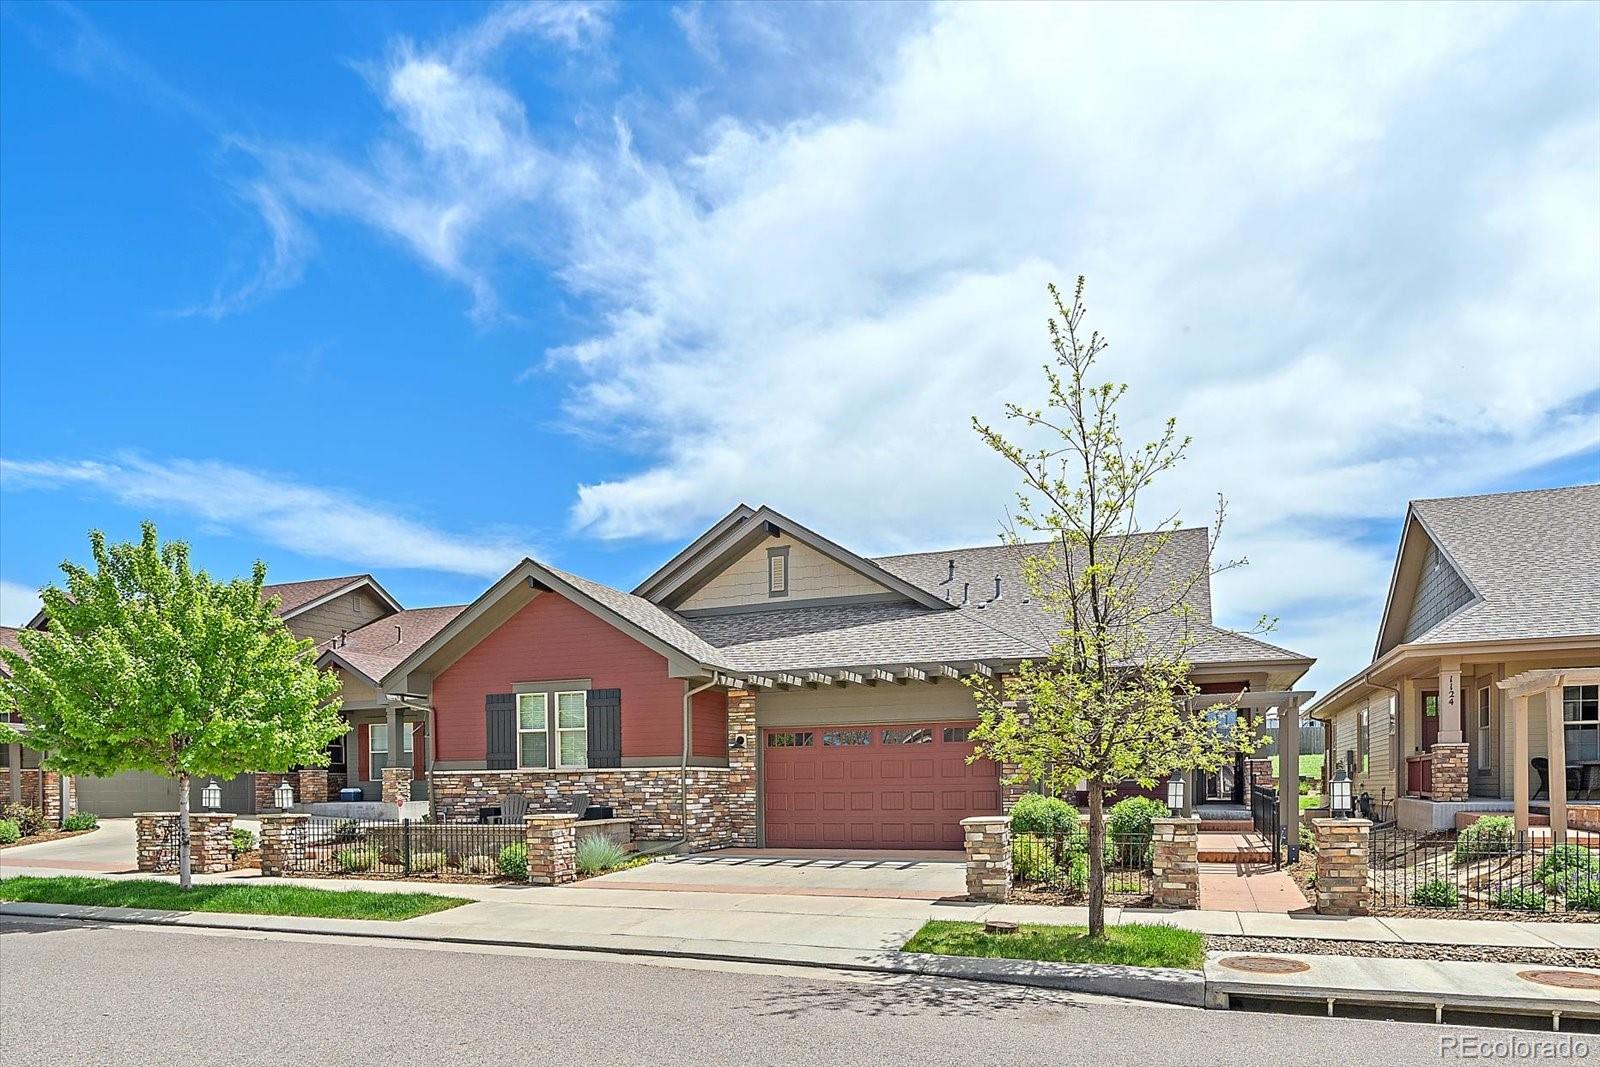
Active under contract
$875,000
3
bds
|
3
ba
|
2,704
sqft
|
built
2016
1130 Summit View Dr, Louisville, CO 80027
$-3,042
Cash flow
-18.1%
Cash-on-Cash Return
2.1%
Cap rate
0.4%
Rent to Value Ratio
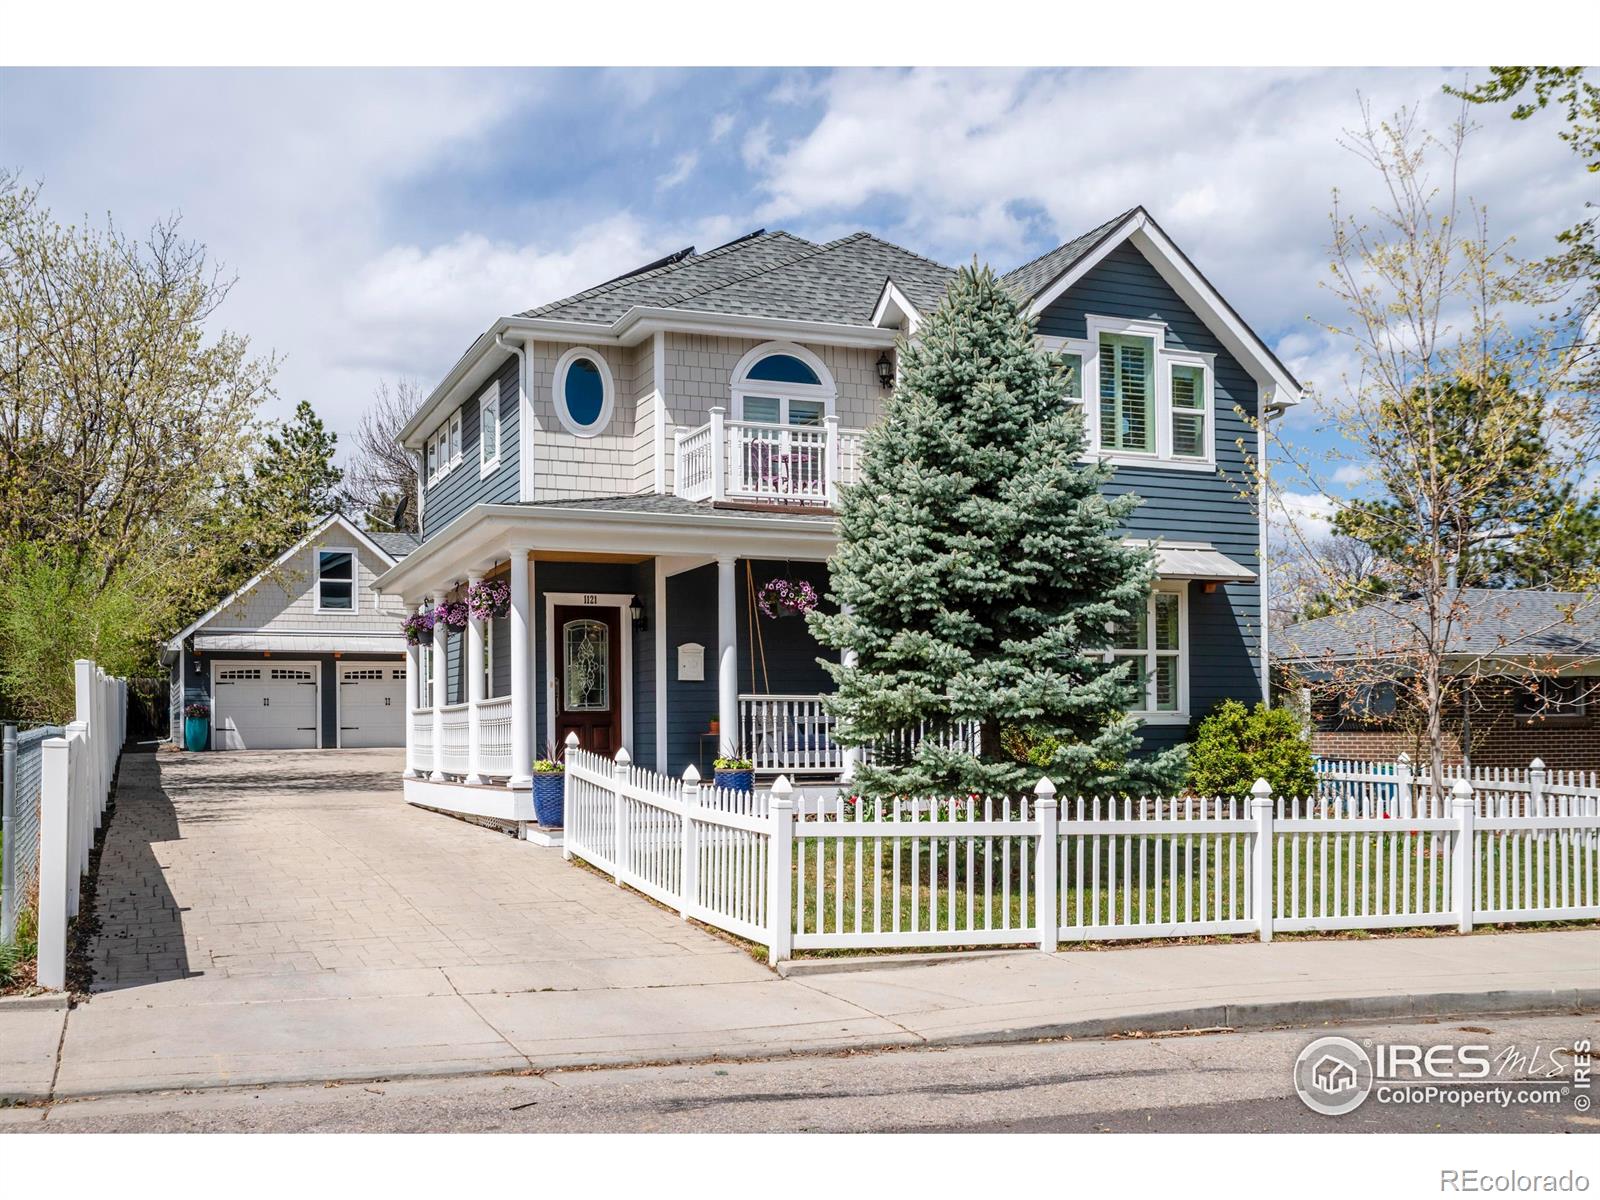
Pending
$1,595,000
4
bds
|
4
ba
|
2,375
sqft
|
built
2011
1121 Lincoln Ave, Louisville, CO 80027
$-6,536
Cash flow
-21.4%
Cash-on-Cash Return
1.4%
Cap rate
0.2%
Rent to Value Ratio
Active
$1,499,000
4
bds
|
4
ba
|
2,338
sqft
|
built
1983
456 W Sycamore Ct, Louisville, CO 80027
$-6,420
Cash flow
-22.3%
Cash-on-Cash Return
1.1%
Cap rate
0.2%
Rent to Value Ratio
Active
$2,075,000
5
bds
|
5
ba
|
4,277
sqft
|
built
2015
722 Hutchinson St, Louisville, CO 80027
$-8,367
Cash flow
-21.0%
Cash-on-Cash Return
1.4%
Cap rate
0.2%
Rent to Value Ratio
Active
$250,000
2
bds
|
1
ba
|
901
sqft
|
built
1972
1611 Garfield Ave, Louisville, CO 80027
$-409
Cash flow
-8.5%
Cash-on-Cash Return
4.3%
Cap rate
0.8%
Rent to Value Ratio
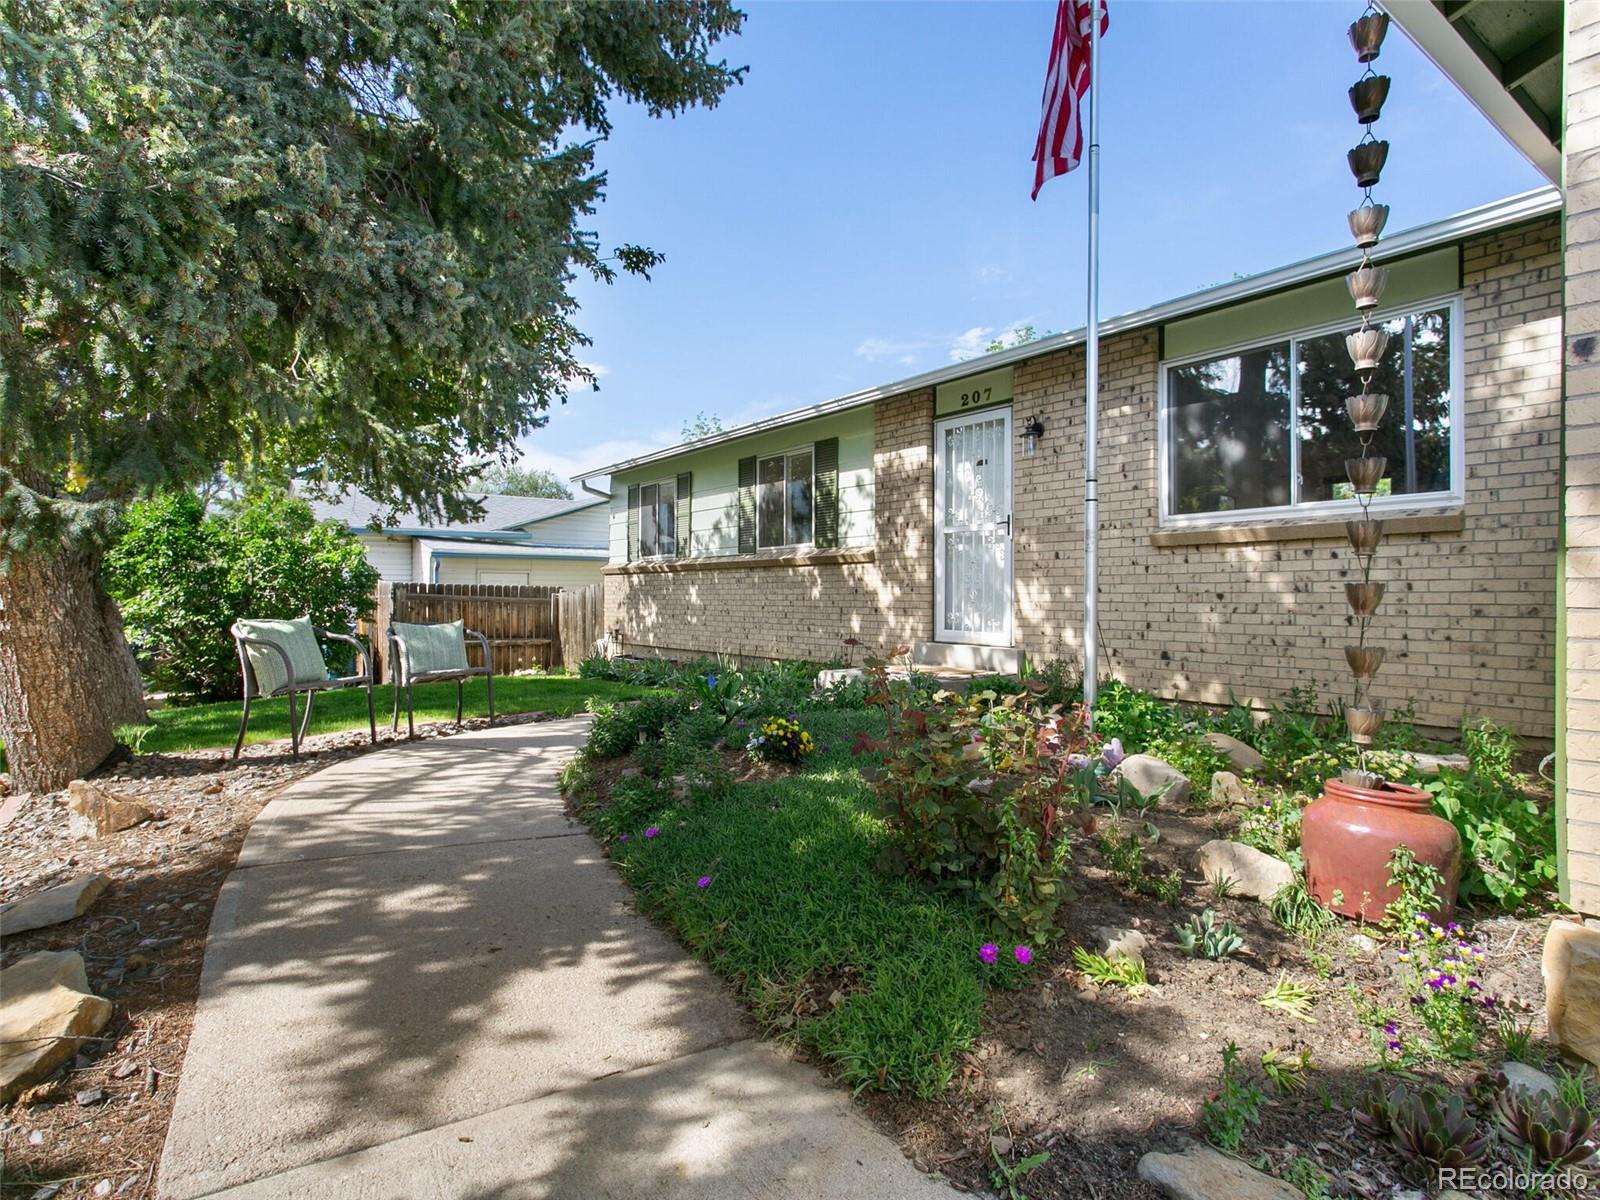
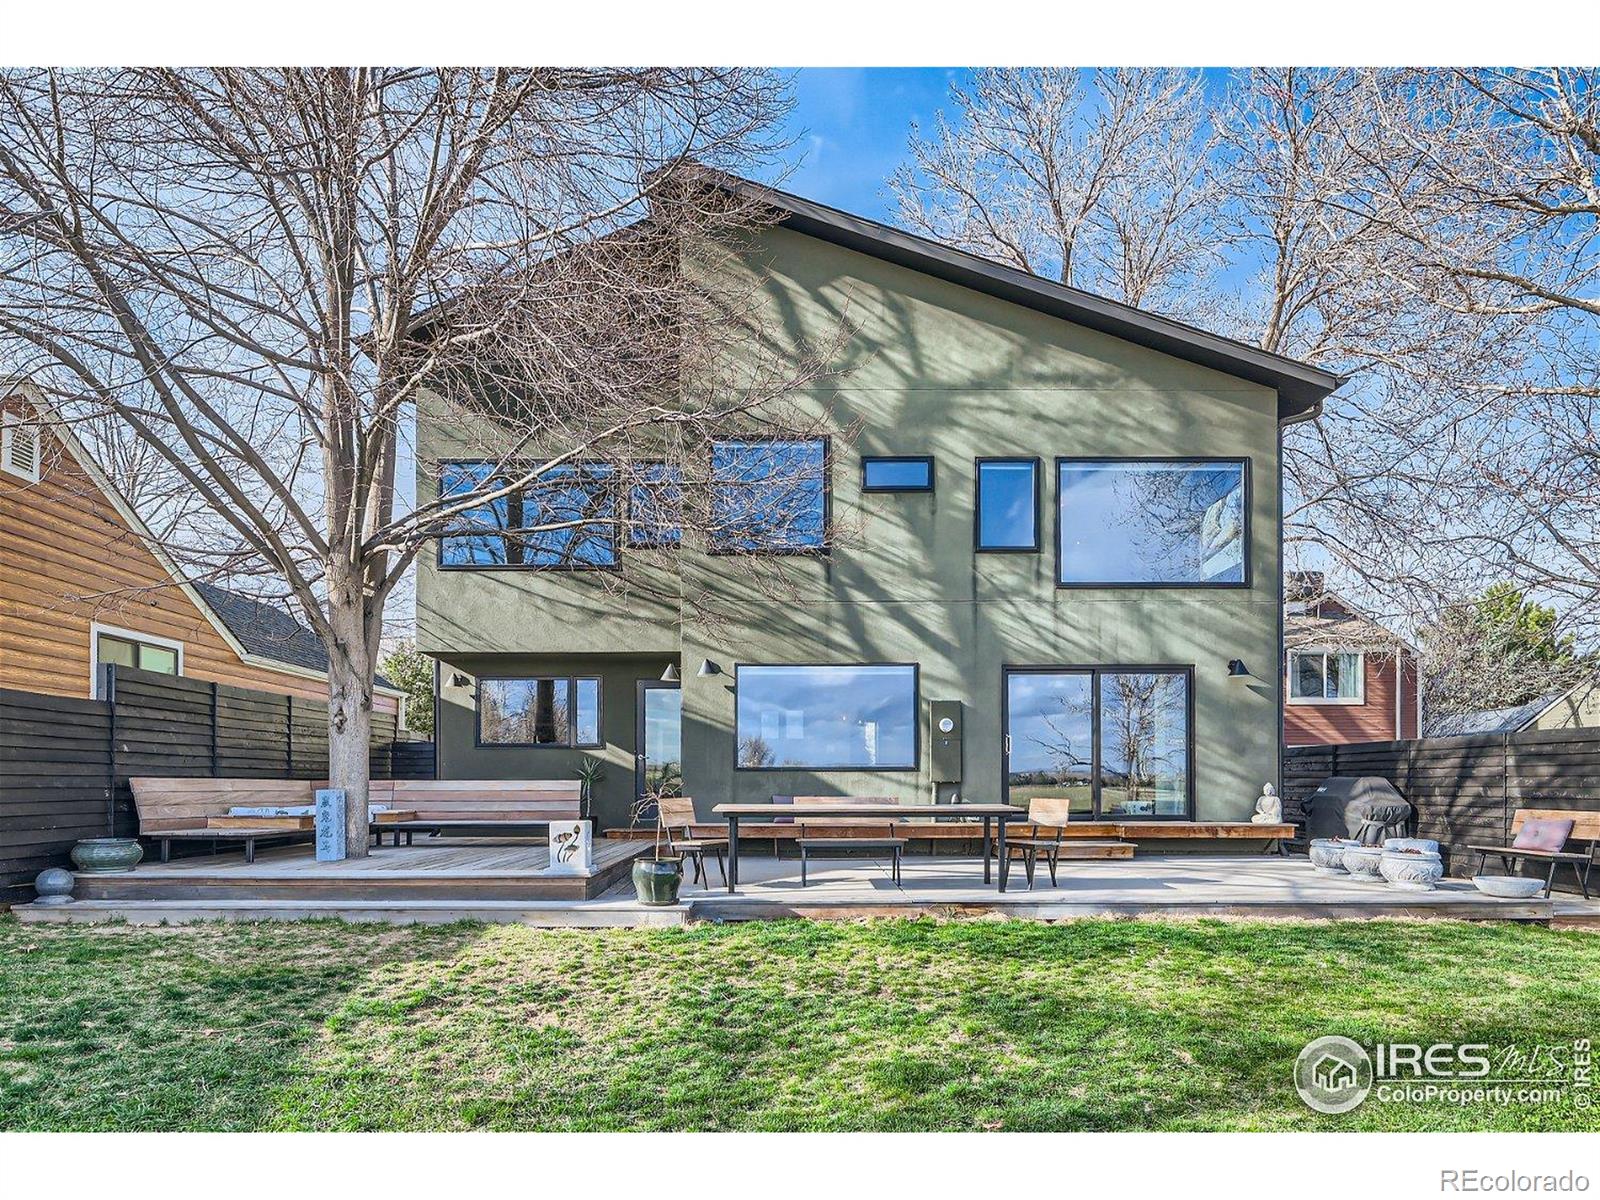
Active
$865,000
4
bds
|
2
ba
|
2,520
sqft
|
built
1974
207 Short Pl, Louisville, CO 80027
$-2,740
Cash flow
-16.5%
Cash-on-Cash Return
2.5%
Cap rate
0.4%
Rent to Value Ratio

Active
$785,000
3
bds
|
3
ba
|
1,732
sqft
|
built
1988
744 Owl Dr, Louisville, CO 80027
$-2,339
Cash flow
-15.5%
Cash-on-Cash Return
2.7%
Cap rate
0.4%
Rent to Value Ratio
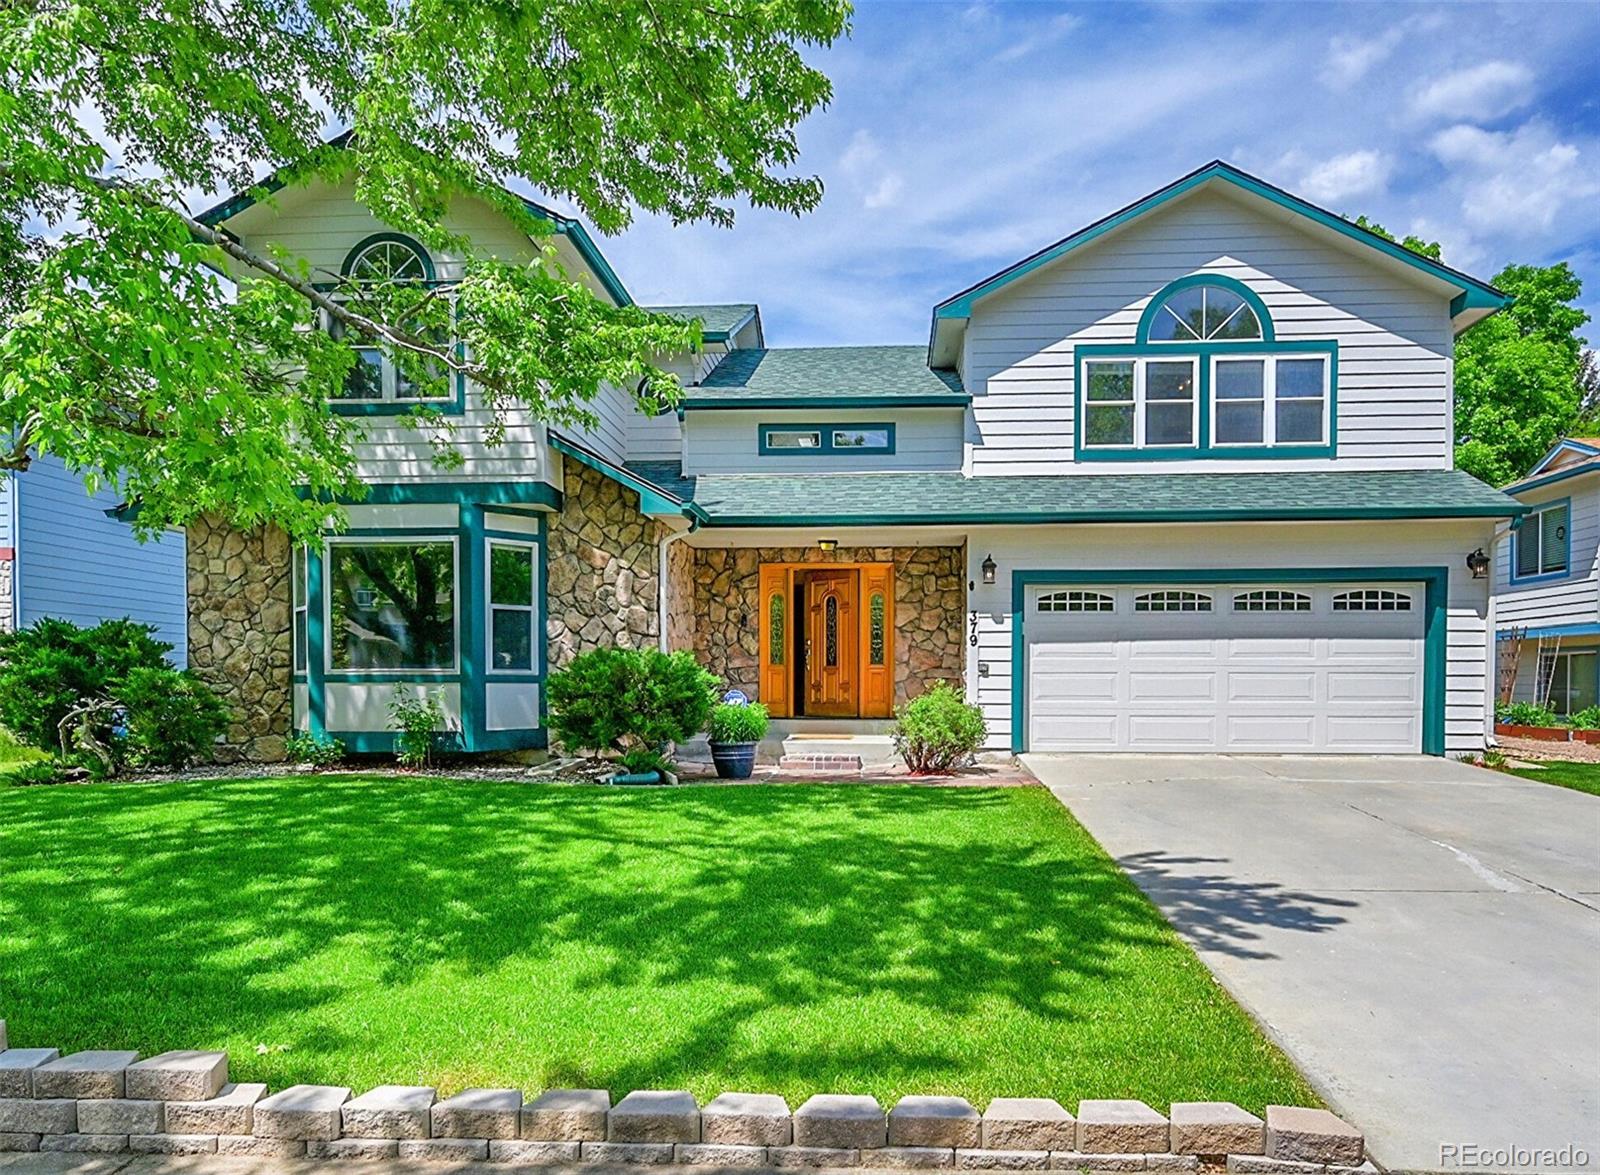
Active
$1,385,000
6
bds
|
5
ba
|
3,798
sqft
|
built
1990
379 Lincoln Ct, Louisville, CO 80027
$-4,737
Cash flow
-17.8%
Cash-on-Cash Return
2.2%
Cap rate
0.3%
Rent to Value Ratio
Active under contract
$1,349,000
4
bds
|
3
ba
|
3,152
sqft
|
built
1985
916 W Alder St, Louisville, CO 80027
$-5,161
Cash flow
-20.0%
Cash-on-Cash Return
1.7%
Cap rate
0.3%
Rent to Value Ratio

Active
$999,500
3
bds
|
4
ba
|
2,330
sqft
|
built
2021
397 East St, Louisville, CO 80027
$-3,002
Cash flow
-15.7%
Cash-on-Cash Return
2.7%
Cap rate
0.5%
Rent to Value Ratio

Active
$2,250,000
4
bds
|
4
ba
|
4,200
sqft
|
built
2022
501 Lois Dr, Louisville, CO 80027
$-10,067
Cash flow
-23.3%
Cash-on-Cash Return
0.9%
Cap rate
0.1%
Rent to Value Ratio
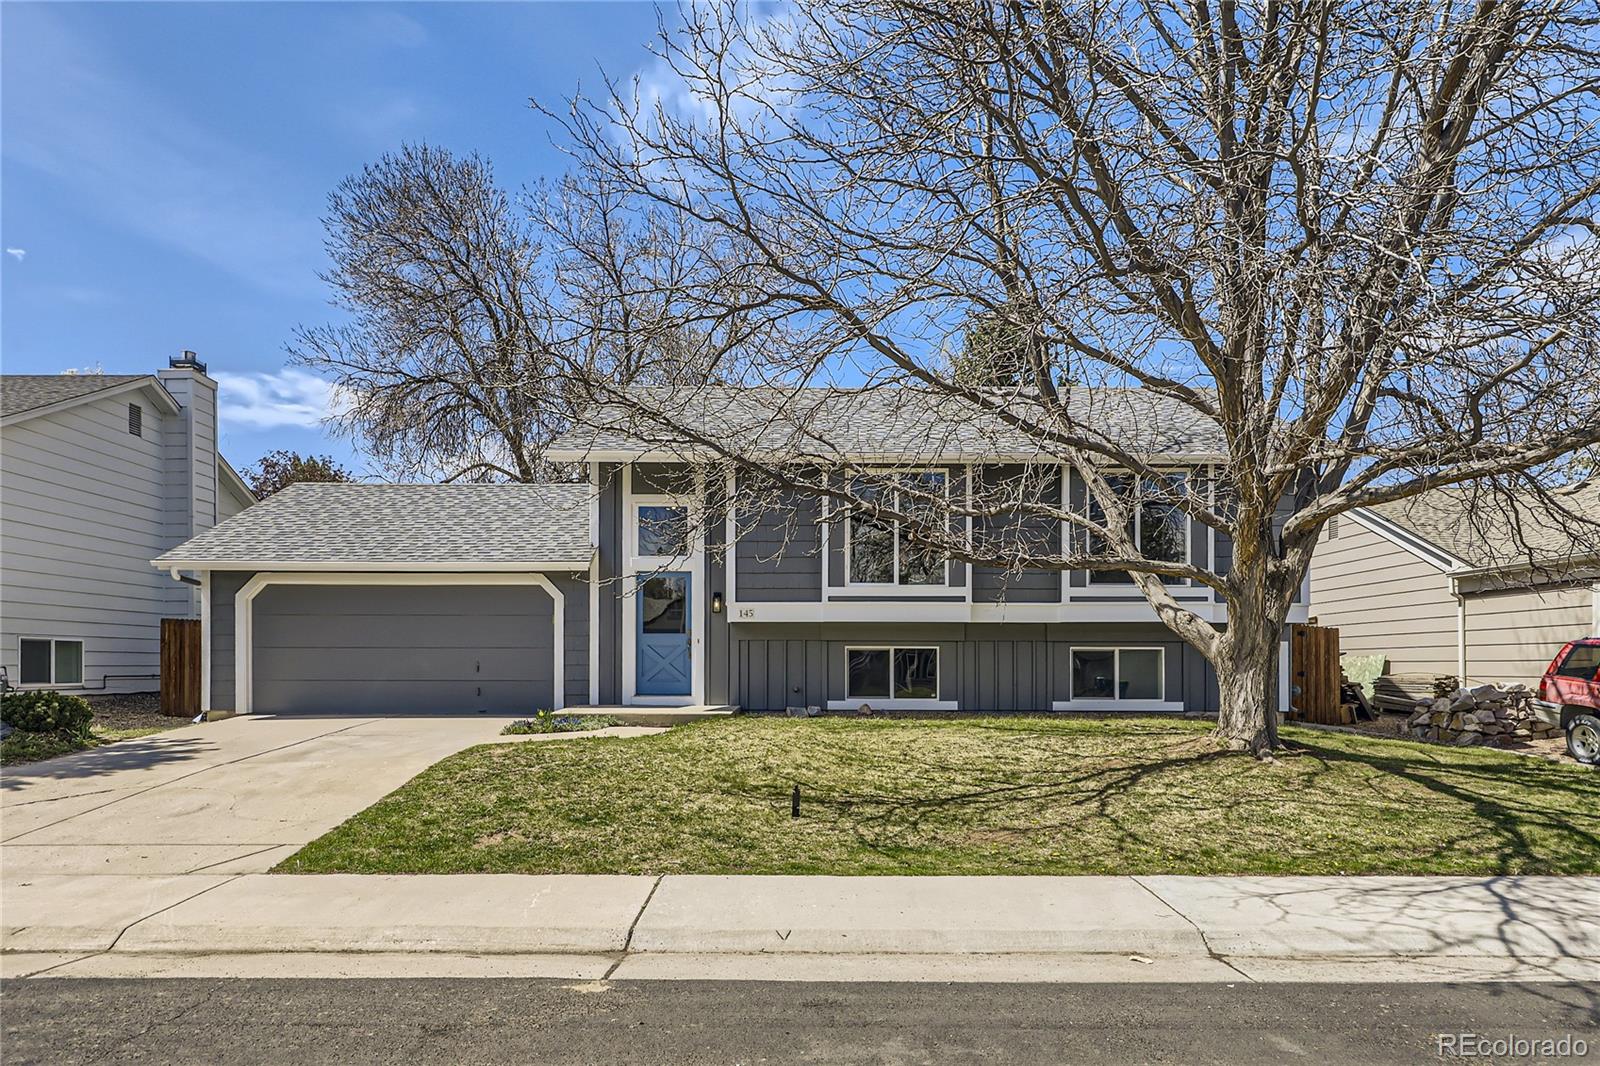
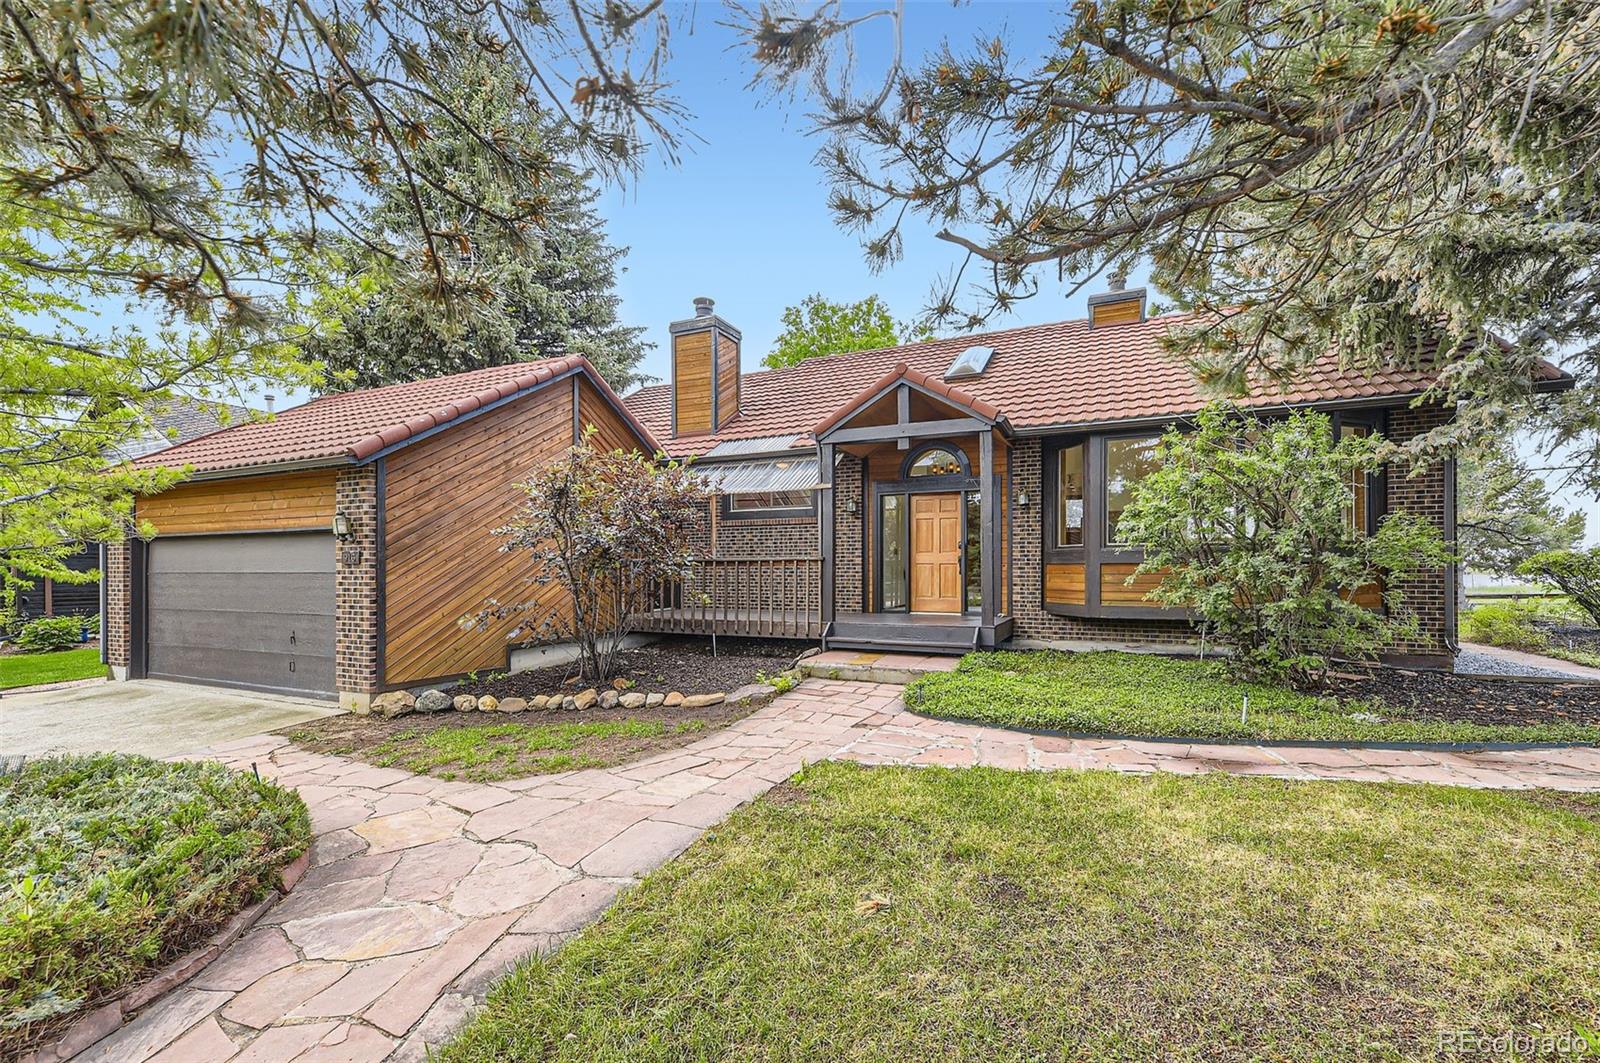
Active
$750,000
4
bds
|
2
ba
|
1,872
sqft
|
built
1983
145 S Buchanan Ave, Louisville, CO 80027
$-1,961
Cash flow
-13.6%
Cash-on-Cash Return
3.1%
Cap rate
0.5%
Rent to Value Ratio
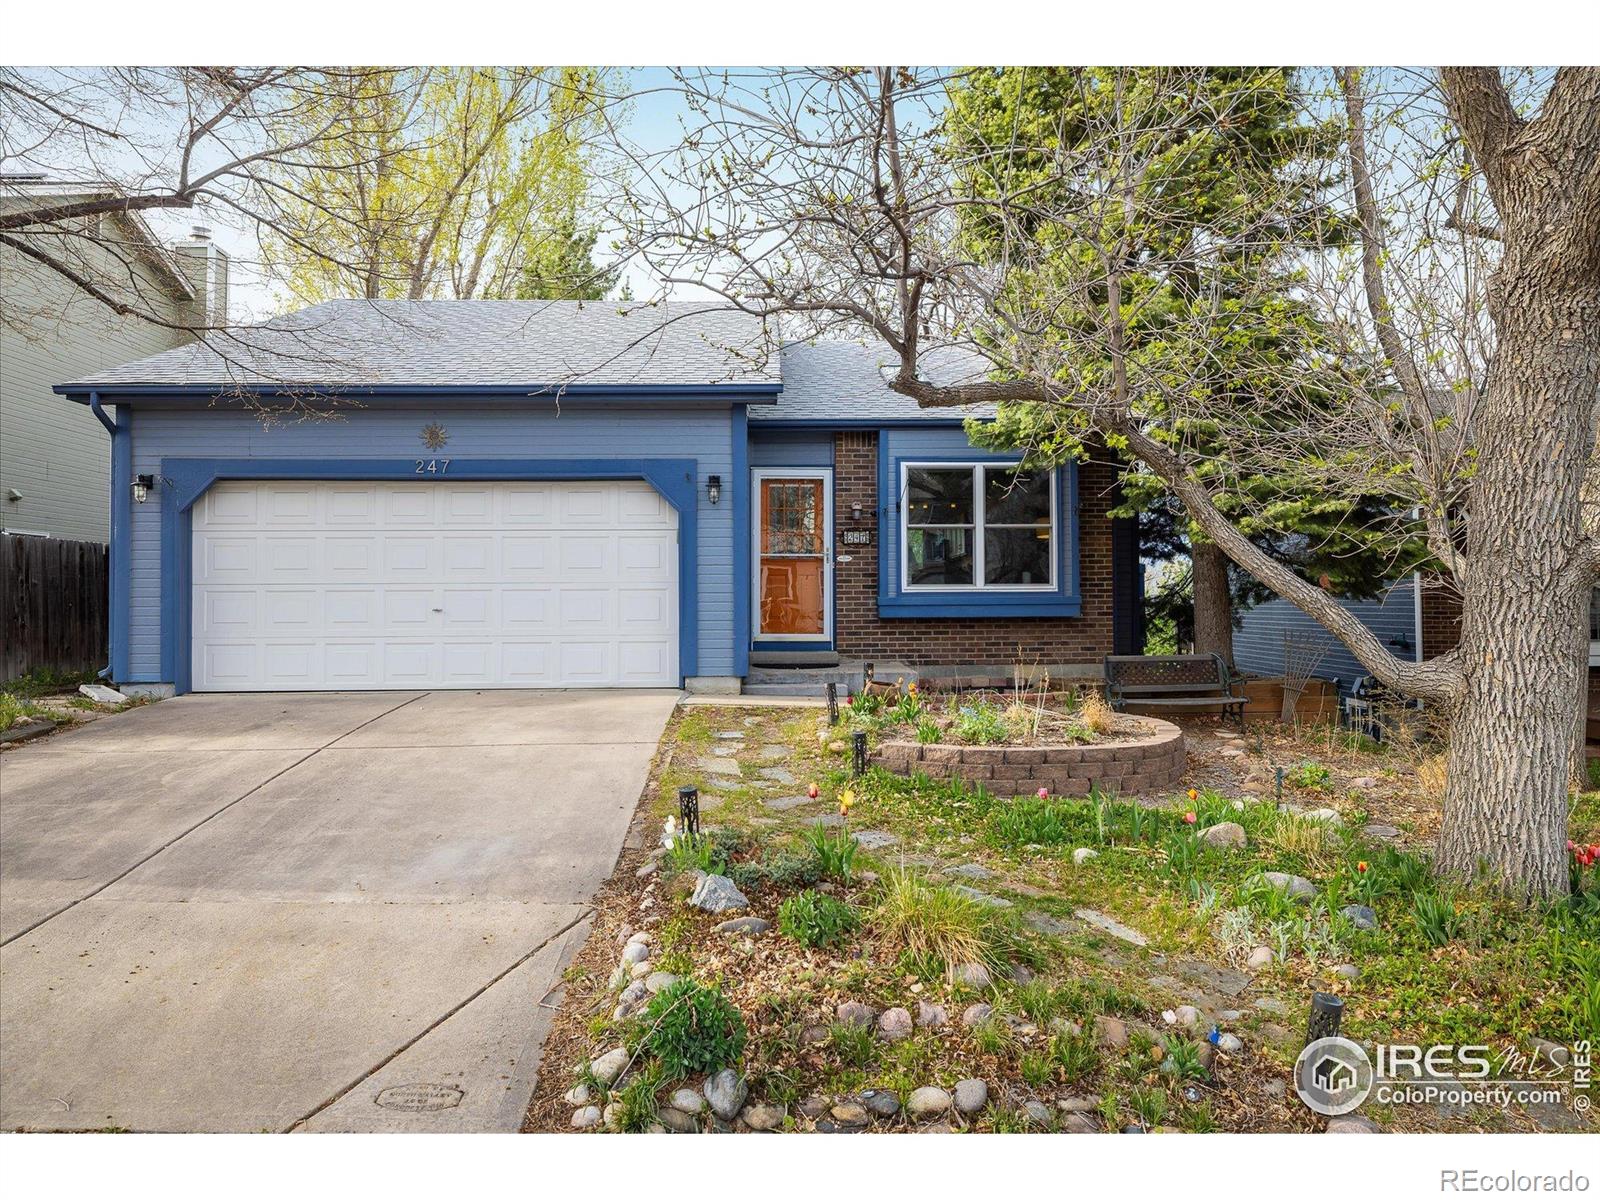
Active
$685,000
4
bds
|
2
ba
|
1,724
sqft
|
built
1985
247 Regal St, Louisville, CO 80027
$-1,679
Cash flow
-12.8%
Cash-on-Cash Return
3.3%
Cap rate
0.5%
Rent to Value Ratio
Active
$479,000
2
bds
|
2
ba
|
1,133
sqft
|
built
2024
1304 Snowberry Ln, Louisville, CO 80027
$-1,246
Cash flow
-13.6%
Cash-on-Cash Return
3.2%
Cap rate
0.6%
Rent to Value Ratio
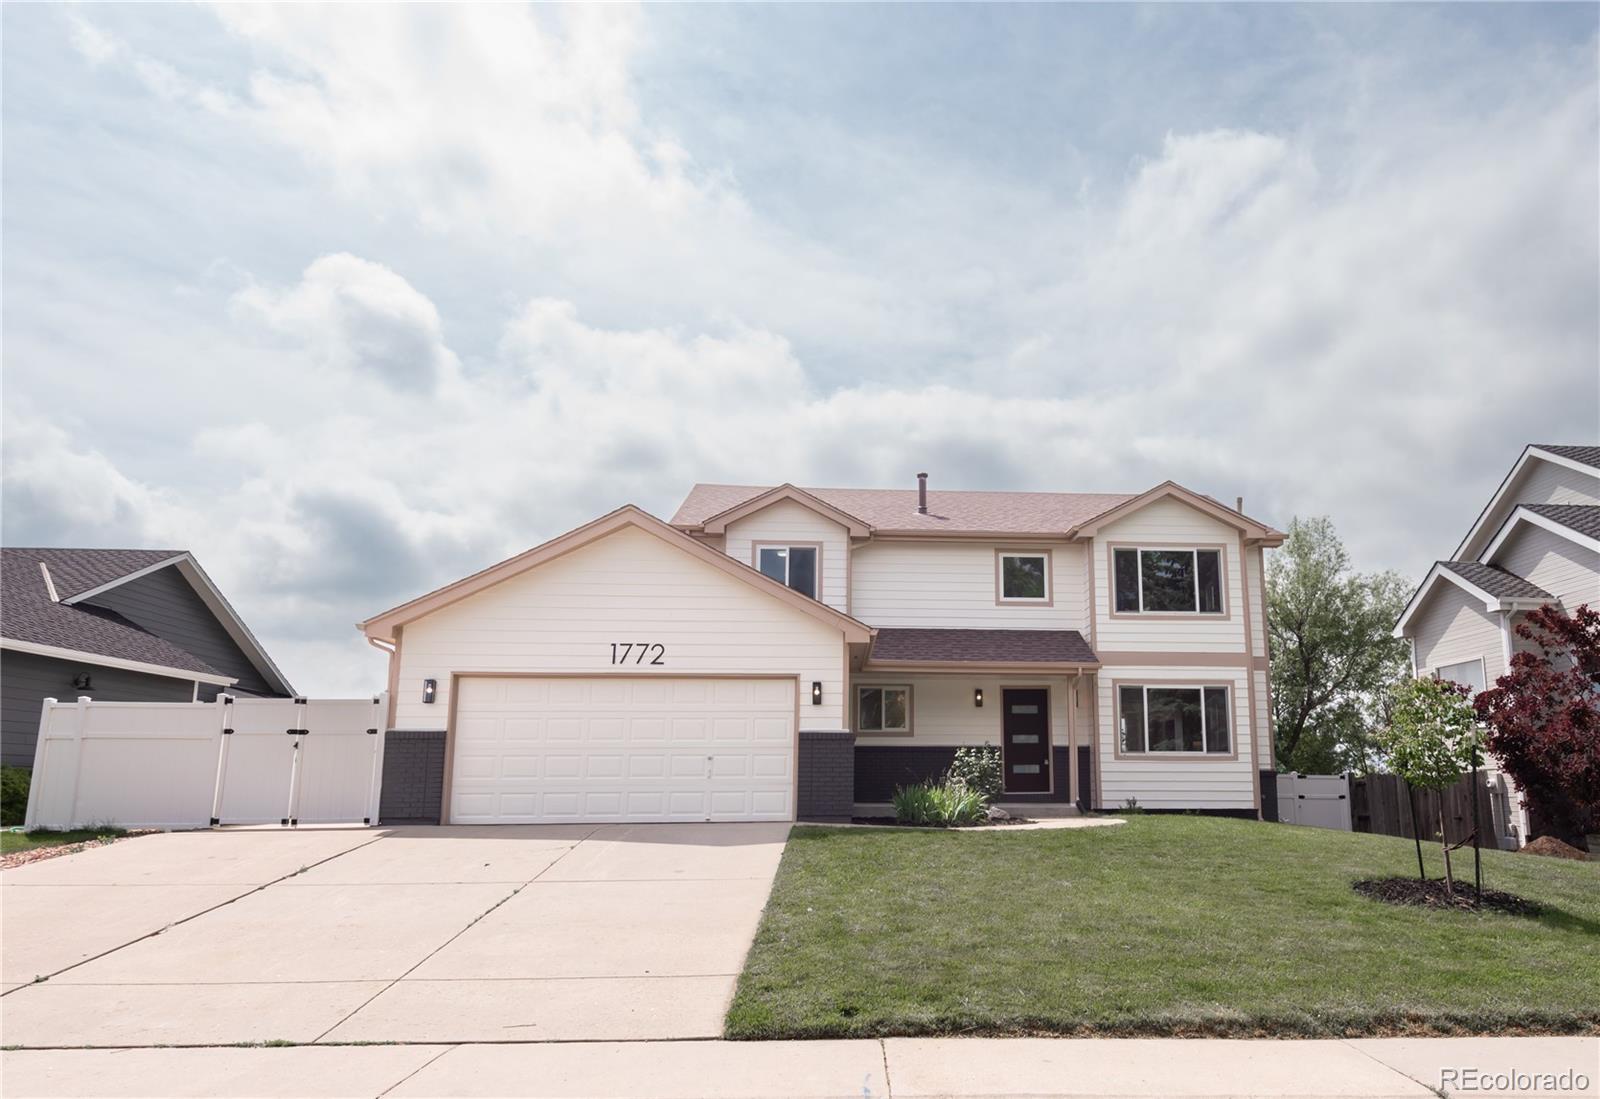
Active
$1,150,000
4
bds
|
4
ba
|
2,758
sqft
|
built
1994
1772 Eisenhower Dr, Louisville, CO 80027
$-3,723
Cash flow
-16.9%
Cash-on-Cash Return
2.4%
Cap rate
0.3%
Rent to Value Ratio
Active
$885,000
4
bds
|
3
ba
|
1,832
sqft
|
built
1976
116 Monarch St, Louisville, CO 80027
$-2,139
Cash flow
-12.6%
Cash-on-Cash Return
3.4%
Cap rate
0.5%
Rent to Value Ratio
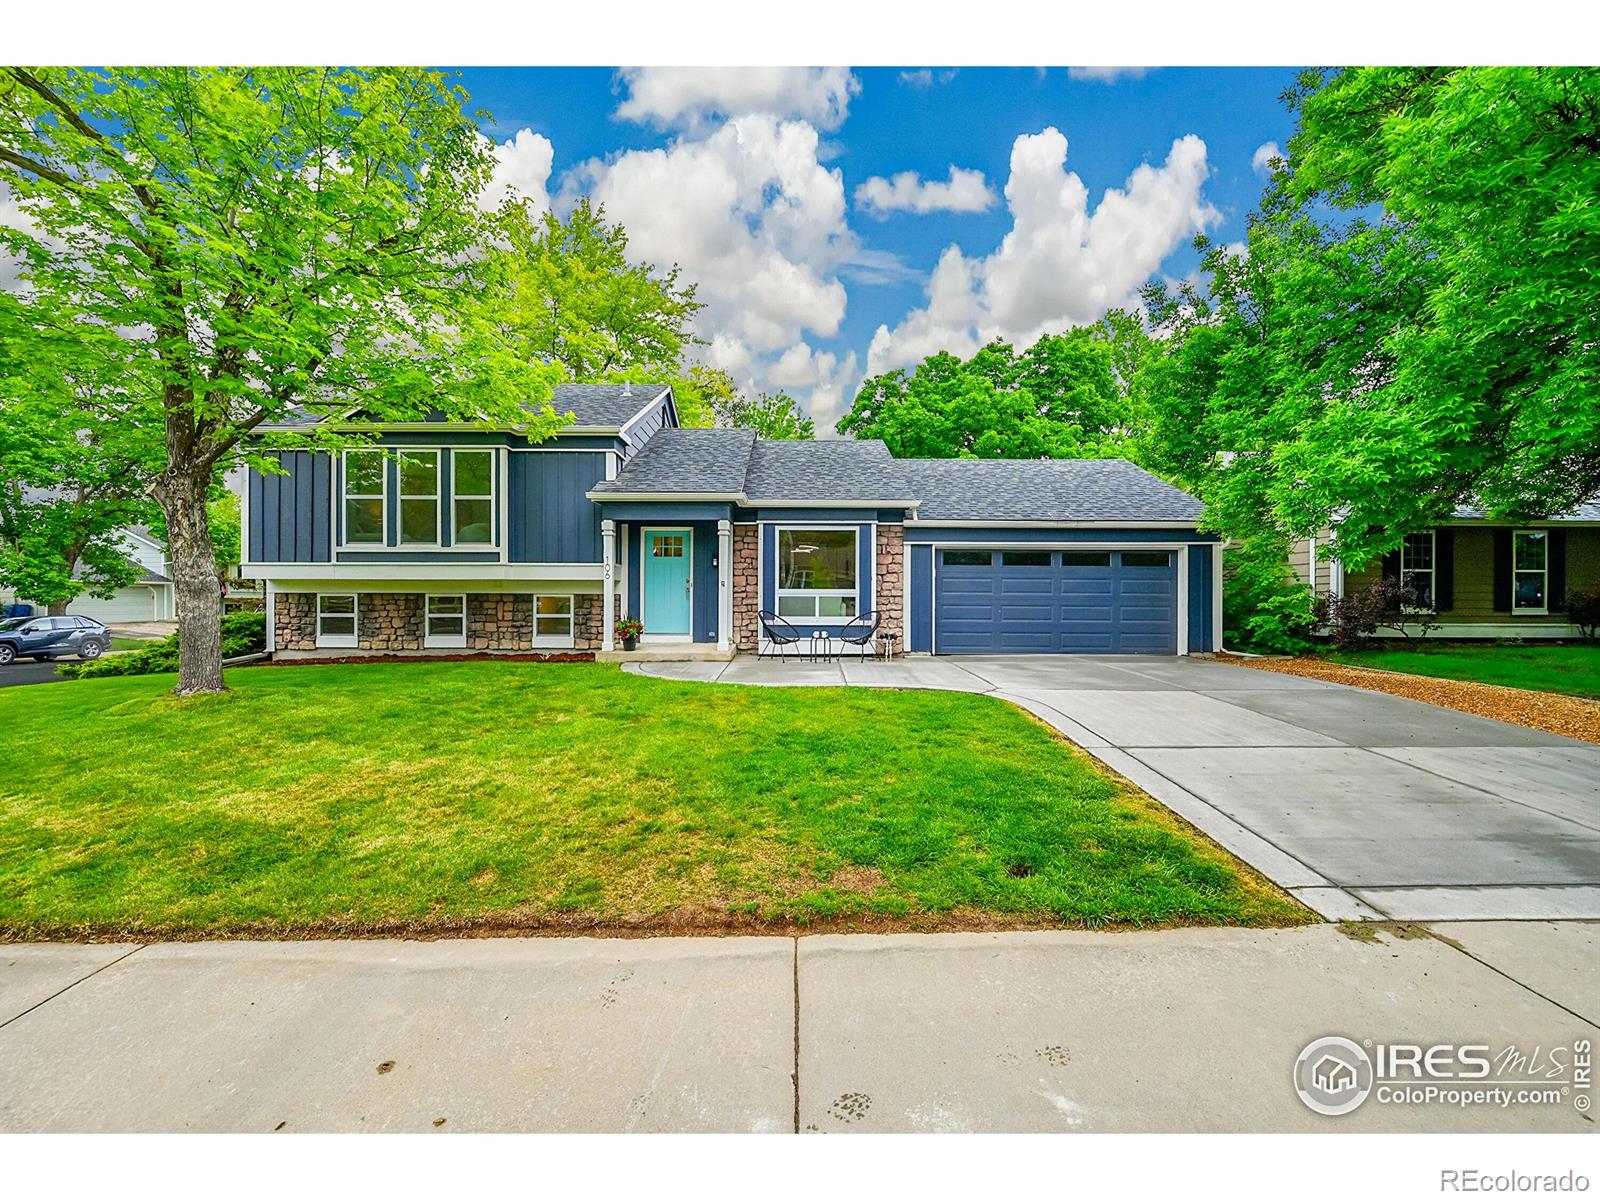
Active
$939,000
4
bds
|
2
ba
|
1,760
sqft
|
built
1983
106 S Madison Ave, Louisville, CO 80027
$-3,259
Cash flow
-18.1%
Cash-on-Cash Return
2.1%
Cap rate
0.3%
Rent to Value Ratio
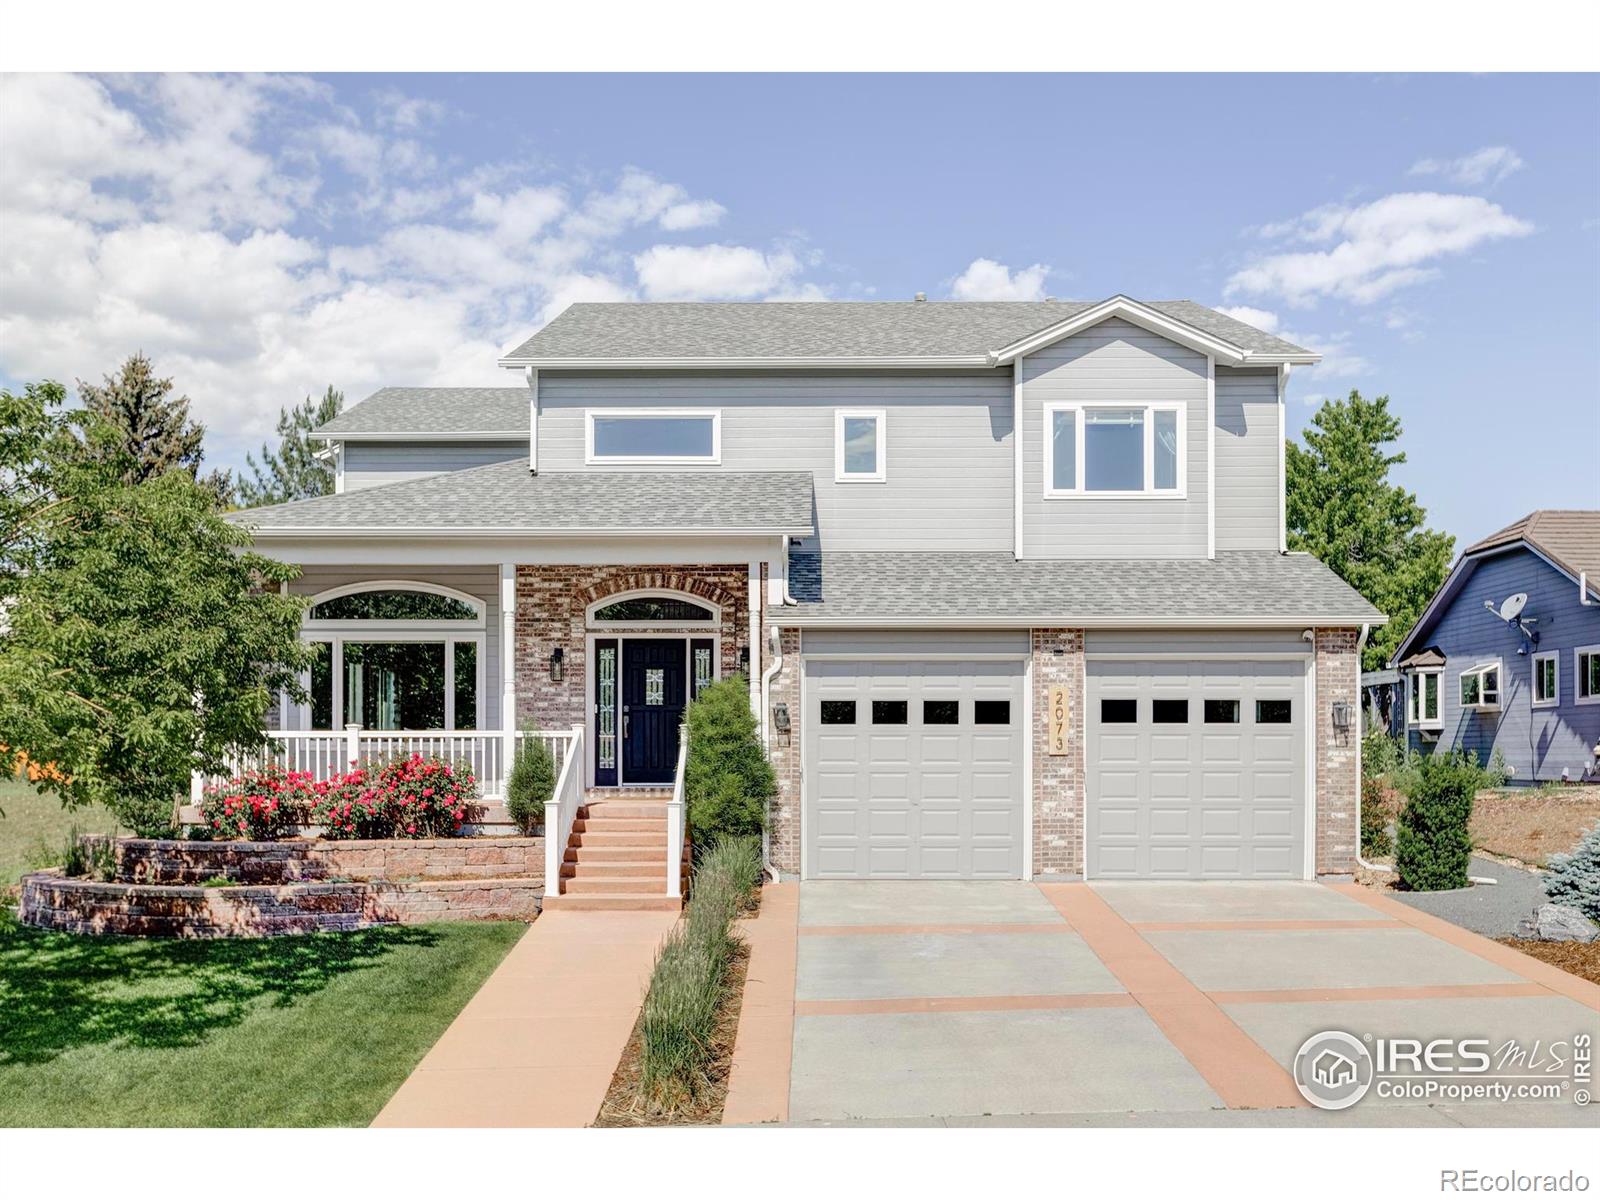
Active
$1,395,000
4
bds
|
5
ba
|
5,022
sqft
|
built
2004
2073 Eisenhower Dr, Louisville, CO 80027
$-4,523
Cash flow
-16.9%
Cash-on-Cash Return
2.4%
Cap rate
0.4%
Rent to Value Ratio
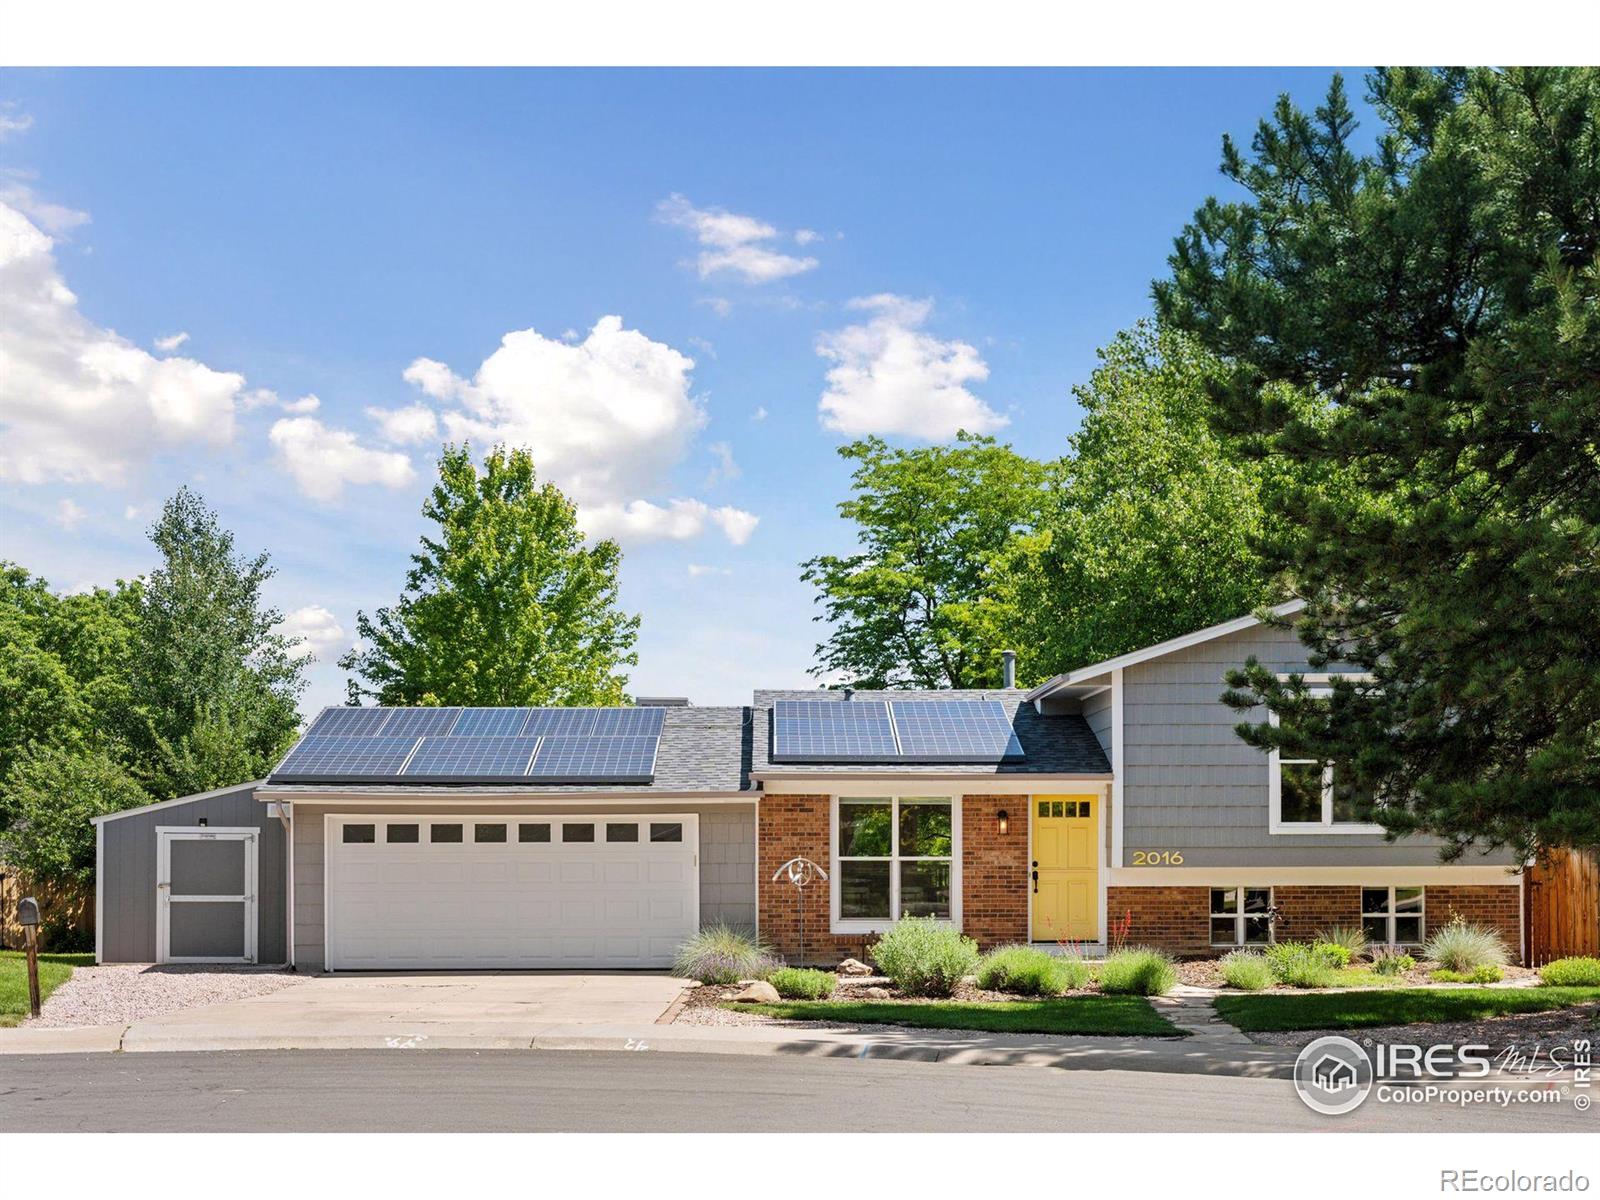
Active under contract
$779,000
3
bds
|
2
ba
|
1,478
sqft
|
built
1975
2016 Strathmore St, Louisville, CO 80027
$-2,270
Cash flow
-15.2%
Cash-on-Cash Return
2.8%
Cap rate
0.4%
Rent to Value Ratio

Active
$450,000
2
bds
|
2
ba
|
1,232
sqft
|
built
2005
1057 W Century Dr, Louisville, CO 80027
$-1,553
Cash flow
-18.0%
Cash-on-Cash Return
2.1%
Cap rate
0.6%
Rent to Value Ratio
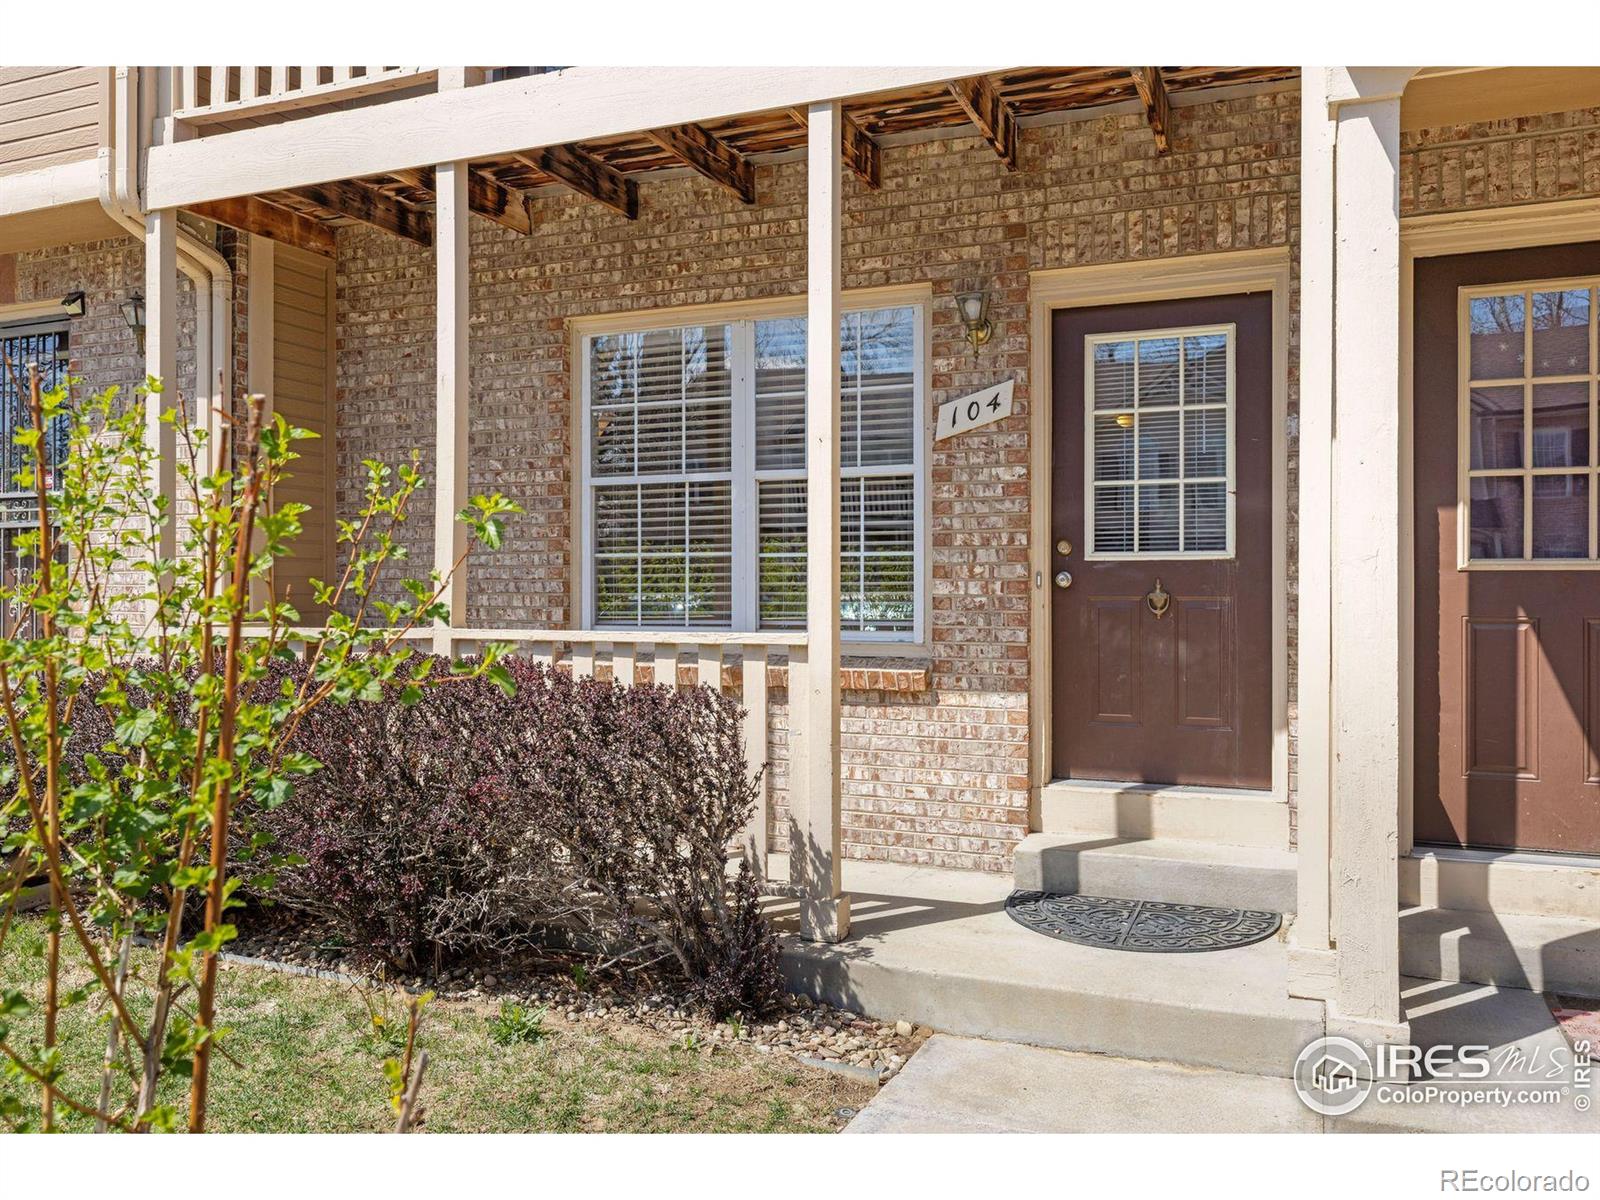
Active
$415,000
3
bds
|
3
ba
|
1,536
sqft
|
built
1985
104 Pheasant Run, Louisville, CO 80027
$-1,024
Cash flow
-12.9%
Cash-on-Cash Return
3.3%
Cap rate
0.6%
Rent to Value Ratio

Active
$495,000
2
bds
|
2
ba
|
1,071
sqft
|
built
1996
546 Ridgeview Dr, Louisville, CO 80027
$-1,471
Cash flow
-15.5%
Cash-on-Cash Return
2.7%
Cap rate
0.5%
Rent to Value Ratio
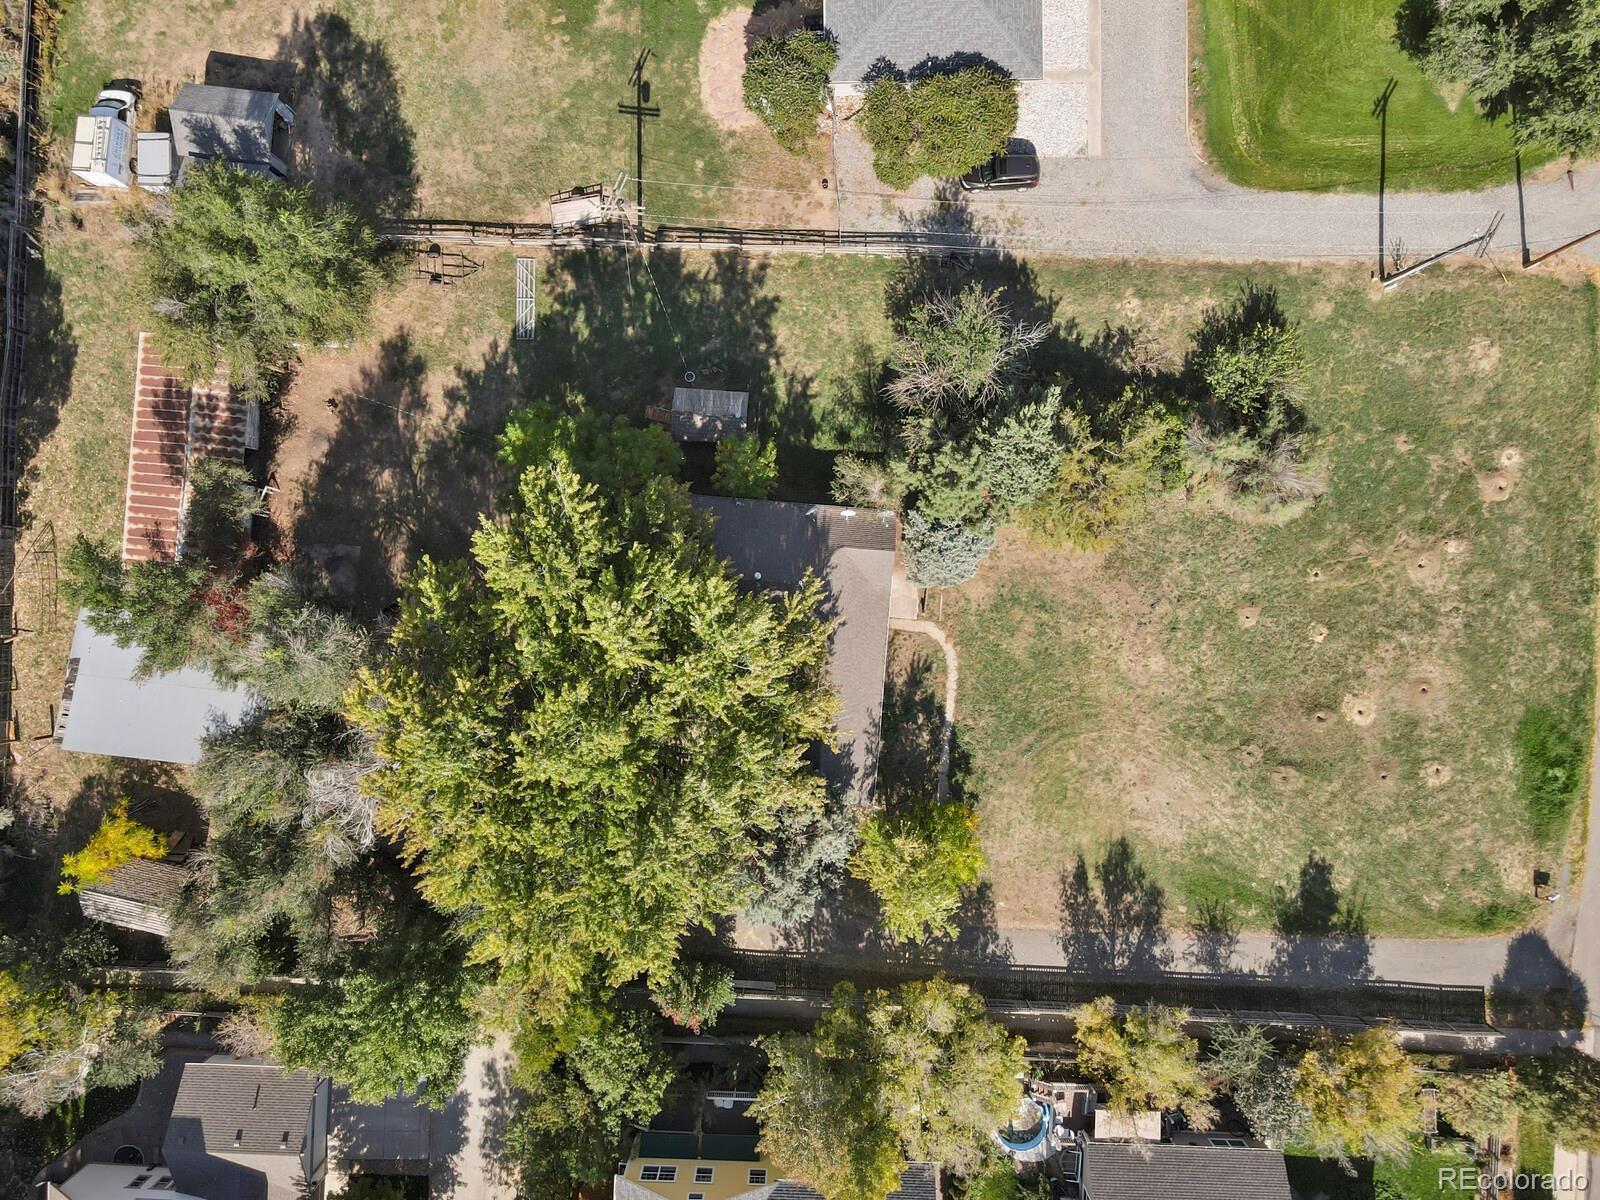
Pending
$785,000
3
bds
|
1
ba
|
1,508
sqft
|
built
1940
577 N 96th St, Louisville, CO 80027
$-2,217
Cash flow
-14.7%
Cash-on-Cash Return
2.9%
Cap rate
0.4%
Rent to Value Ratio
Active
$2,250,000
4
bds
|
4
ba
|
3,709
sqft
|
built
1992
426 W Spruce Ln, Louisville, CO 80027
$-9,589
Cash flow
-22.2%
Cash-on-Cash Return
1.2%
Cap rate
0.2%
Rent to Value Ratio
Active
$2,595,000
5
bds
|
4
ba
|
3,994
sqft
|
built
2000
474 W Spruce St, Louisville, CO 80027
$-11,114
Cash flow
-22.3%
Cash-on-Cash Return
1.1%
Cap rate
0.2%
Rent to Value Ratio
Active
$500,000
3
bds
|
2
ba
|
1,238
sqft
|
built
1984
494 Owl Dr, Louisville, CO 80027
$-1,601
Cash flow
-16.7%
Cash-on-Cash Return
2.4%
Cap rate
0.5%
Rent to Value Ratio
Active
$712,500
3
bds
|
2
ba
|
1,192
sqft
|
built
1982
284 S Lincoln Ave, Louisville, CO 80027
$-2,042
Cash flow
-15.0%
Cash-on-Cash Return
2.8%
Cap rate
0.4%
Rent to Value Ratio
Active
$789,000
4
bds
|
3
ba
|
1,944
sqft
|
built
1984
182 Lois Cir, Louisville, CO 80027
$-2,447
Cash flow
-16.2%
Cash-on-Cash Return
2.6%
Cap rate
0.4%
Rent to Value Ratio
Active
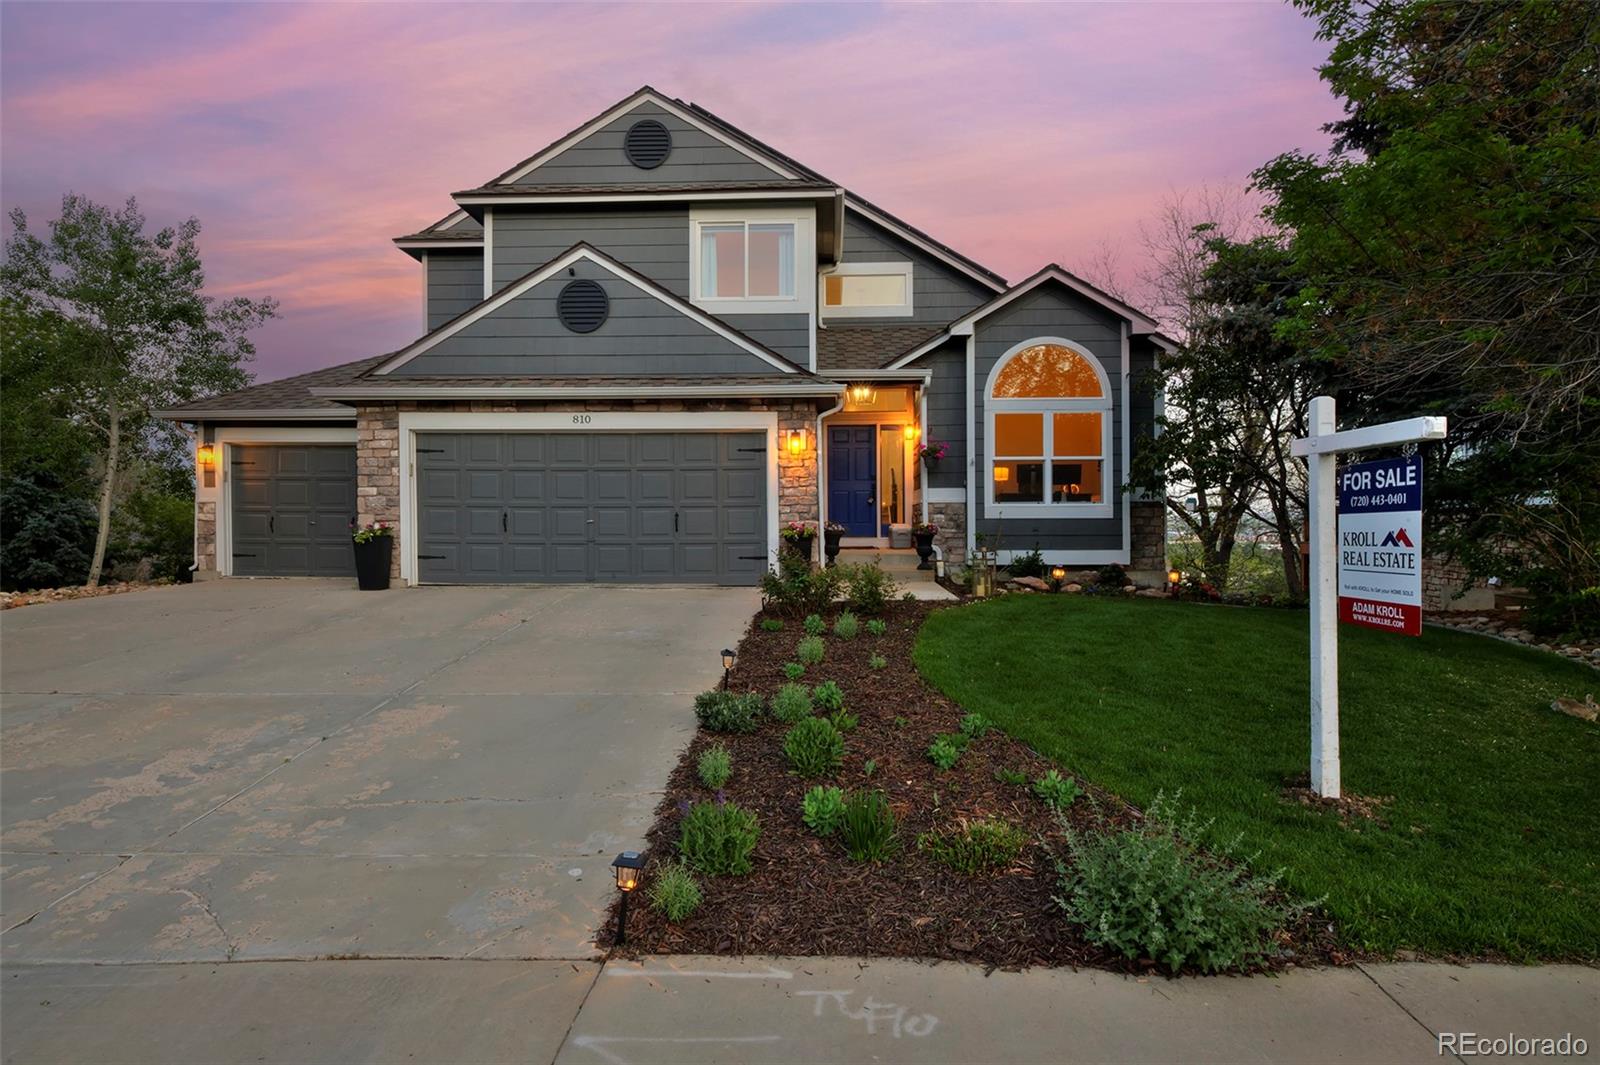
$1,500,000
5
bds
|
4
ba
|
3,640
sqft
|
built
1993
810 Trail Ridge Dr, Louisville, CO 80027
$-5,824
Cash flow
-20.3%
Cash-on-Cash Return
1.6%
Cap rate
0.3%
Rent to Value Ratio

Active
$1,749,000
5
bds
|
4
ba
|
3,902
sqft
|
built
1996
501 W Linden St, Louisville, CO 80027
$-5,534
Cash flow
-16.5%
Cash-on-Cash Return
2.5%
Cap rate
0.4%
Rent to Value Ratio
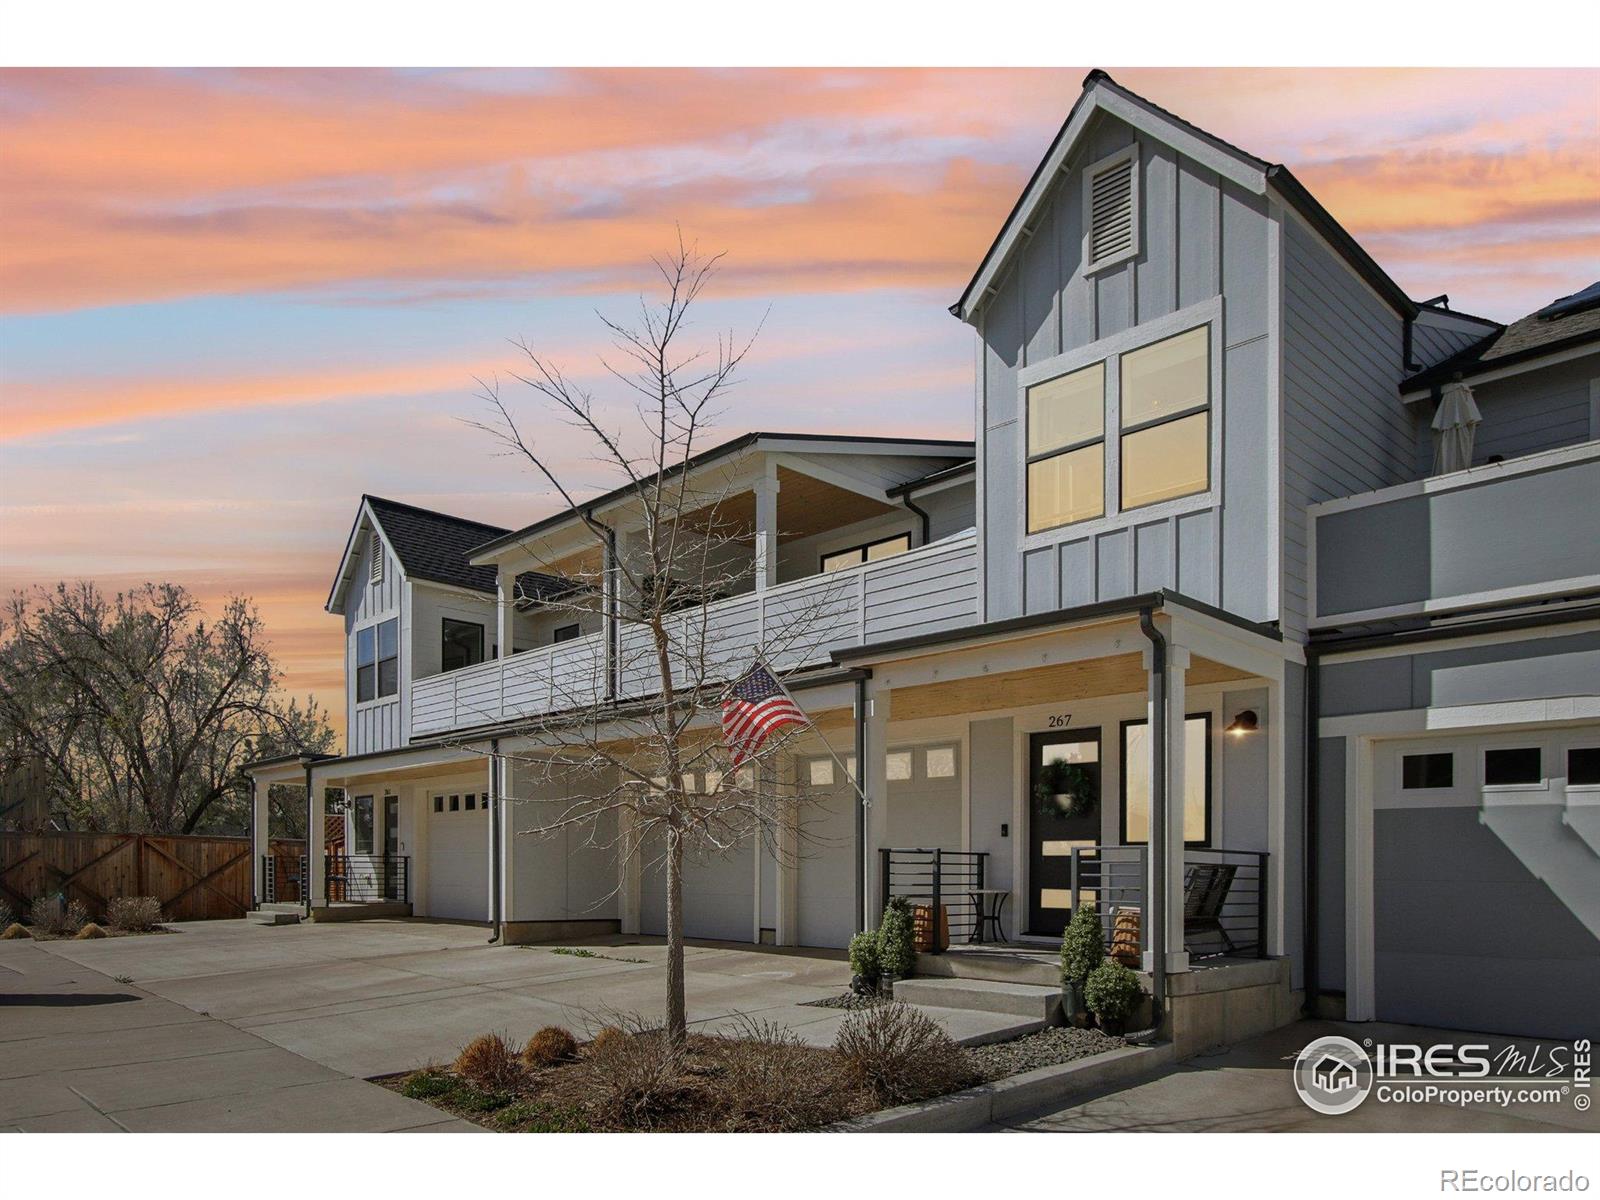
Active
$1,099,000
4
bds
|
5
ba
|
3,710
sqft
|
built
2020
267 Clementina St, Louisville, CO 80027
$-3,260
Cash flow
-15.5%
Cash-on-Cash Return
2.7%
Cap rate
0.4%
Rent to Value Ratio
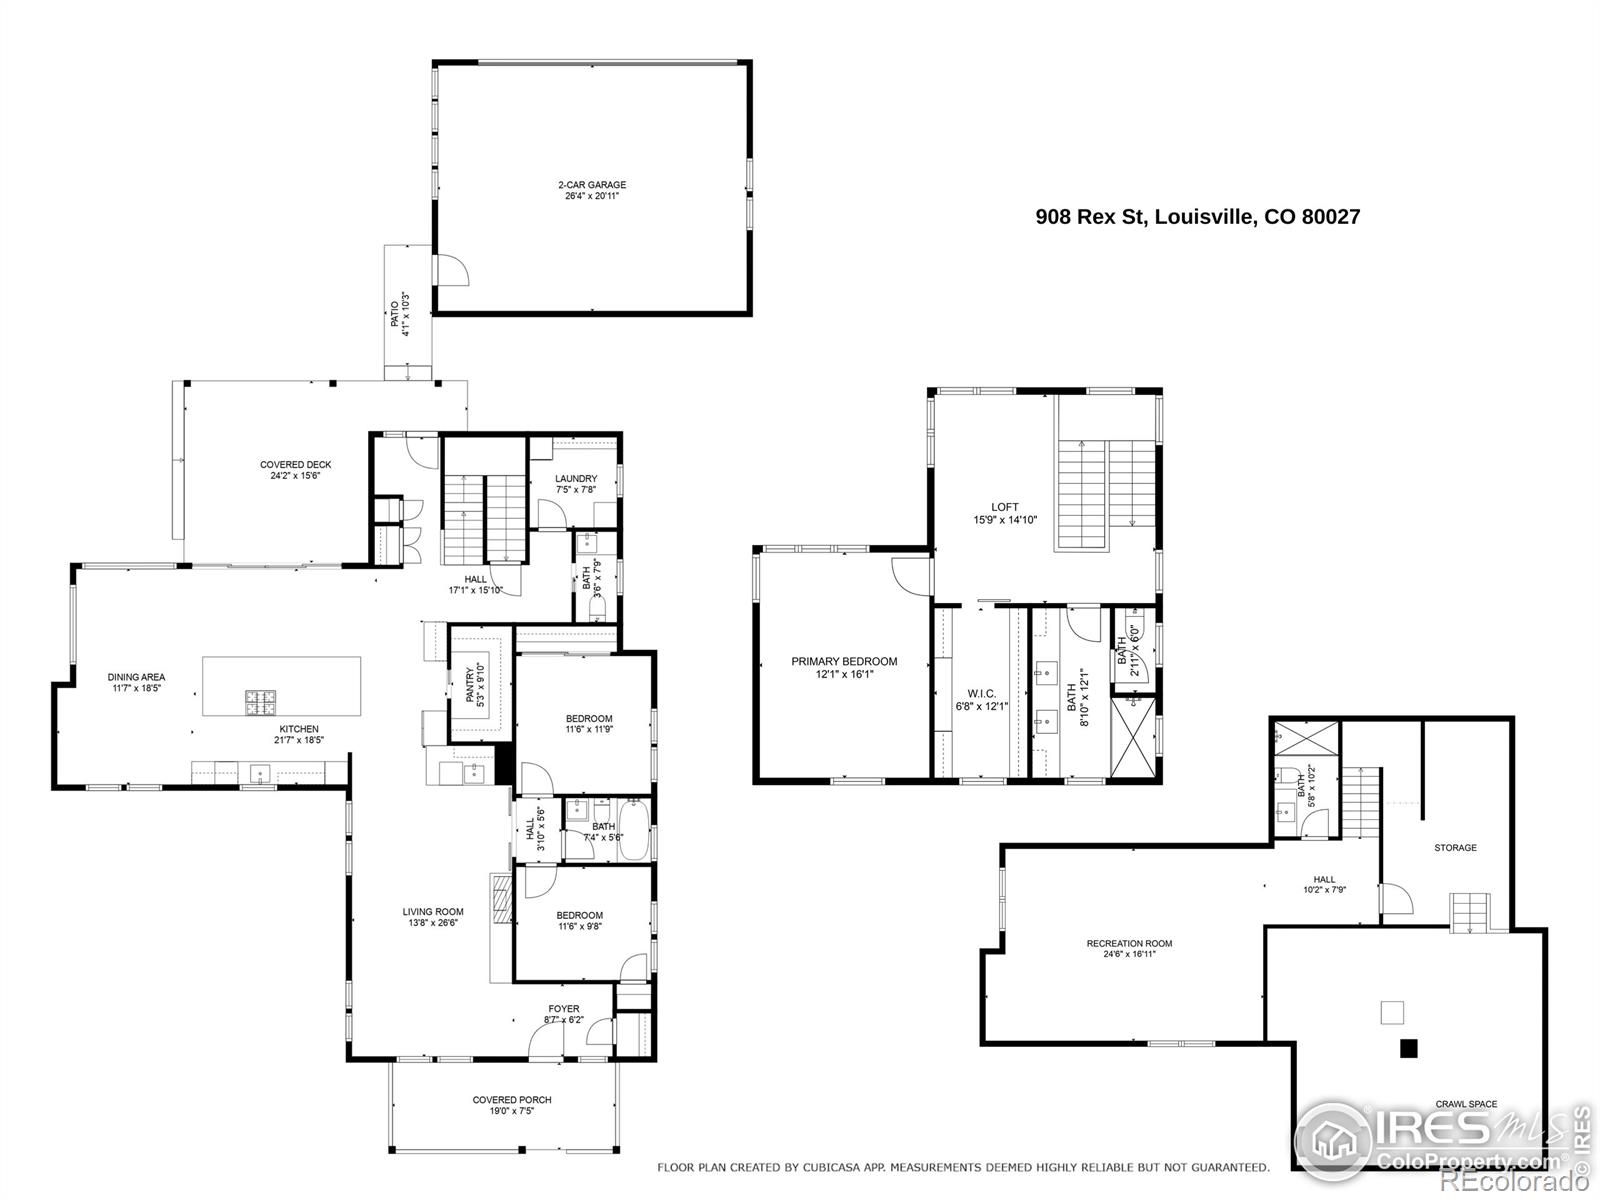
Active
$2,198,000
3
bds
|
4
ba
|
2,978
sqft
|
built
1924
908 Rex St, Louisville, CO 80027
$-9,695
Cash flow
-23.0%
Cash-on-Cash Return
1.0%
Cap rate
0.2%
Rent to Value Ratio
Active
$899,900
4
bds
|
4
ba
|
2,782
sqft
|
built
1978
357 W Harper St, Louisville, CO 80027
$-2,702
Cash flow
-15.7%
Cash-on-Cash Return
2.7%
Cap rate
0.4%
Rent to Value Ratio

Active
$1,130,000
4
bds
|
2
ba
|
2,190
sqft
|
built
1962
503 Lois Dr, Louisville, CO 80027
$-3,842
Cash flow
-17.7%
Cash-on-Cash Return
2.2%
Cap rate
0.3%
Rent to Value Ratio
Active
$725,000
4
bds
|
2
ba
|
2,120
sqft
|
built
1978
1504 Washington Ave, Louisville, CO 80027
$-2,159
Cash flow
-15.5%
Cash-on-Cash Return
2.7%
Cap rate
0.4%
Rent to Value Ratio
Active
$695,000
3
bds
|
1
ba
|
1,216
sqft
|
built
1978
852 W Linden St, Louisville, CO 80027
$-2,181
Cash flow
-16.4%
Cash-on-Cash Return
2.5%
Cap rate
0.4%
Rent to Value Ratio
Active under contract
$735,000
4
bds
|
2
ba
|
1,744
sqft
|
built
1982
137 S Polk Ave, Louisville, CO 80027
$-1,807
Cash flow
-12.8%
Cash-on-Cash Return
3.3%
Cap rate
0.5%
Rent to Value Ratio
Active under contract
$1,150,000
5
bds
|
3
ba
|
2,205
sqft
|
built
1983
268 S Buchanan Cir, Louisville, CO 80027
$-4,210
Cash flow
-19.1%
Cash-on-Cash Return
1.9%
Cap rate
0.3%
Rent to Value Ratio