Louisville, CO Investment Properties for Sale
Browse homes for sale and investment properties in Louisville, CO. Refine your search by price, property type, or more.
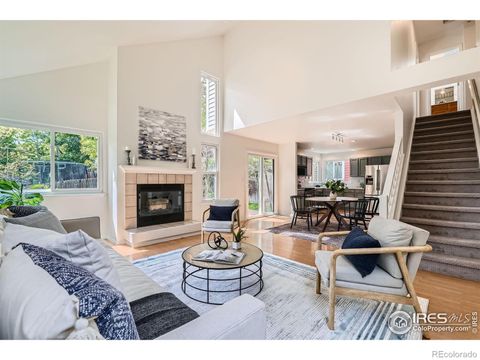
Best cash flowing properties in Louisville, CO
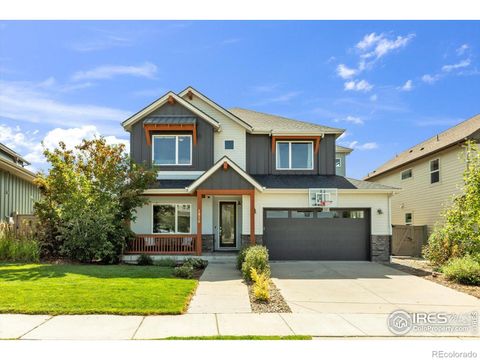
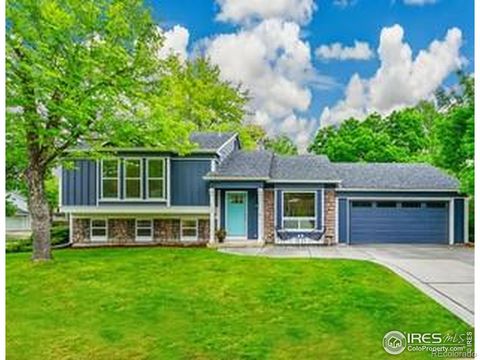
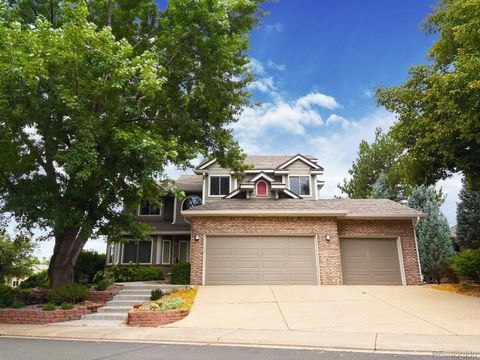
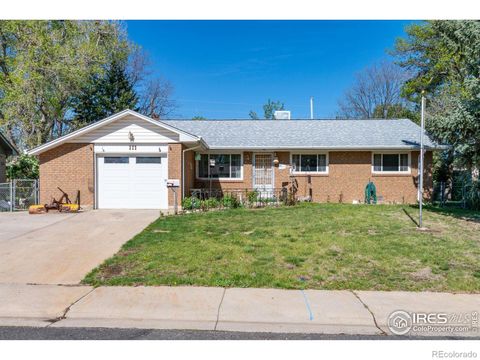
Active
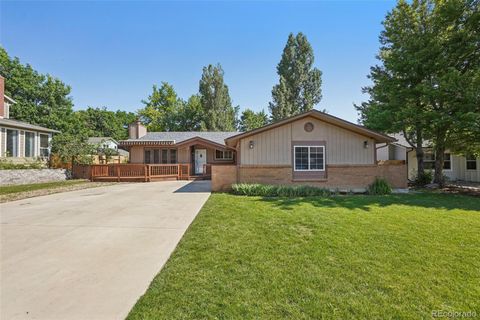
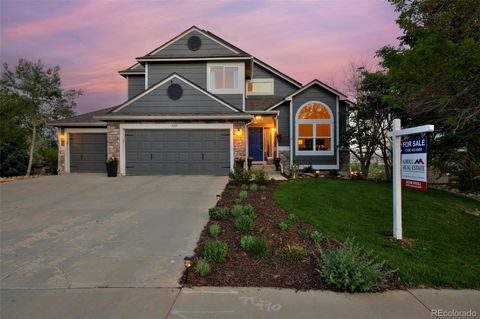
$275,000
2
bds
|
1
ba
|
901
sqft
|
built
1972
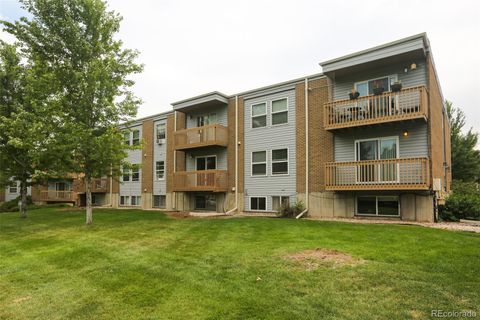
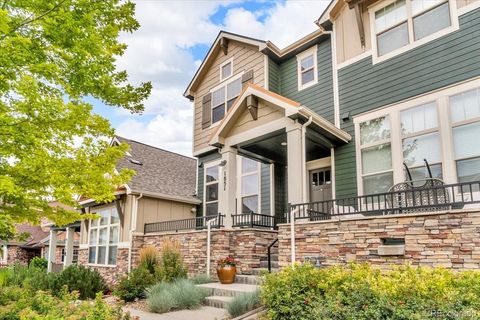
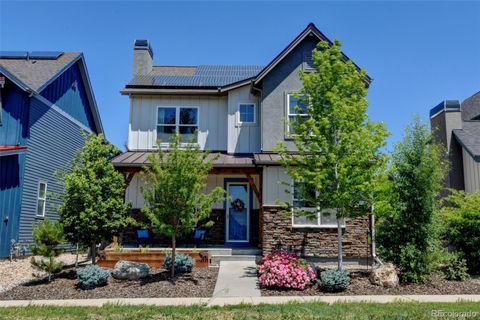
1608 Cottonwood Dr, Louisville, CO 80027
$-333
Cash flow
-6.3%
Cash-on-Cash Return
4.2%
Cap rate
0.7%
Rent to Value Ratio
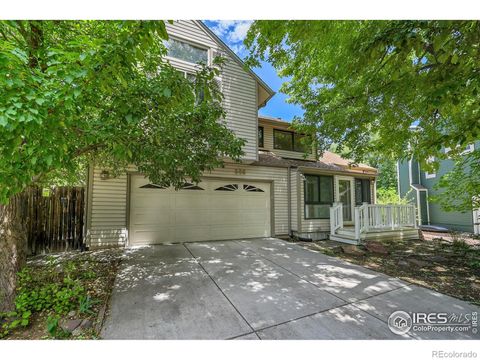
Active
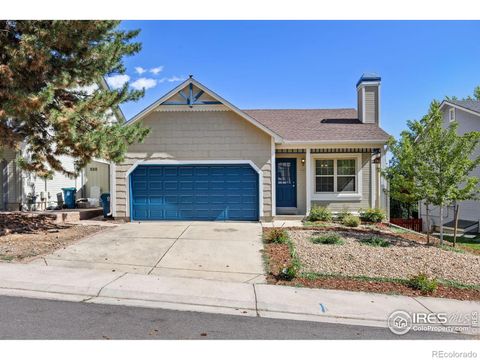
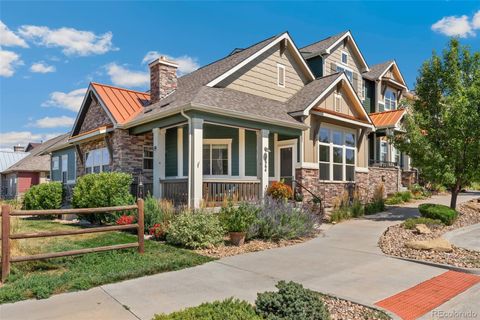
$350,000
1
bds
|
1
ba
|
729
sqft
|
built
1994
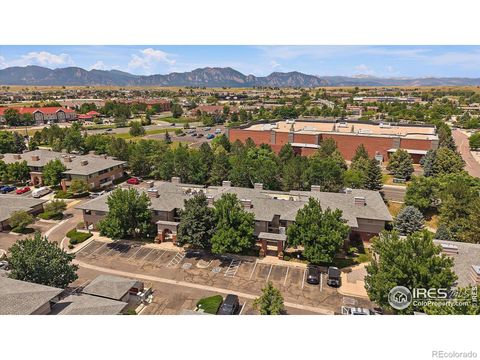
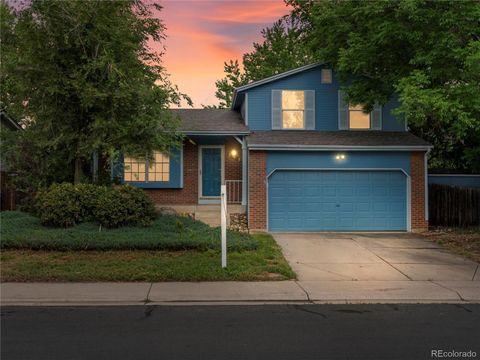
730 Copper Ln, Louisville, CO 80027
$-841
Cash flow
-12.5%
Cash-on-Cash Return
2.8%
Cap rate
0.5%
Rent to Value Ratio
36 out of 41 properties for sale in Louisville, CO
Limited Results Shown
Create a free account, or log in to reveal all property listings and enjoy the complete experience.
Active
$1,750,000
4
bds
|
5
ba
|
4,418
sqft
|
built
1991
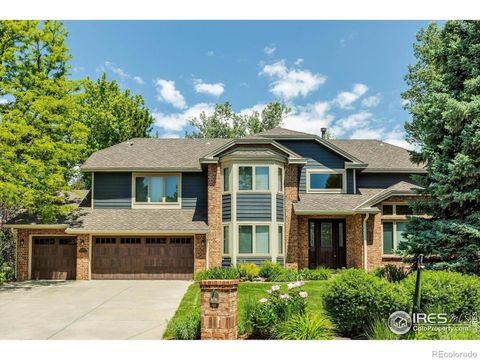
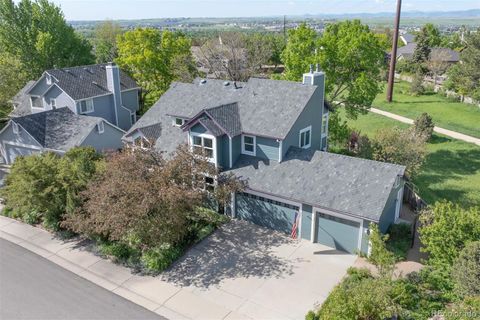
567 N Manorwood Ln, Louisville, CO 80027
$-6,060
Cash flow
-18.1%
Cash-on-Cash Return
1.5%
Cap rate
0.3%
Rent to Value Ratio
Active
$1,000,000
5
bds
|
4
ba
|
3,712
sqft
|
built
1984
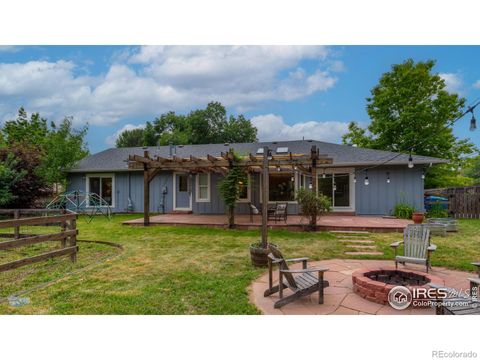
419 Centennial Dr, Louisville, CO 80027
$-2,576
Cash flow
-13.4%
Cash-on-Cash Return
2.6%
Cap rate
0.4%
Rent to Value Ratio
Active
$1,450,000
4
bds
|
4
ba
|
3,440
sqft
|
built
2013
1836 Lakespur Ln, Louisville, CO 80027
$-4,713
Cash flow
-17.0%
Cash-on-Cash Return
1.8%
Cap rate
0.3%
Rent to Value Ratio
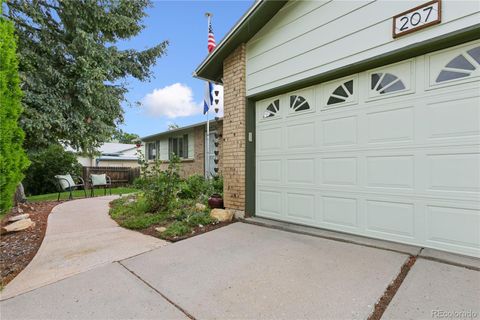
Active
$850,000
4
bds
|
2
ba
|
2,520
sqft
|
built
1974
207 Short Pl, Louisville, CO 80027
$-2,232
Cash flow
-13.7%
Cash-on-Cash Return
2.5%
Cap rate
0.4%
Rent to Value Ratio
Active
$750,000
4
bds
|
3
ba
|
1,732
sqft
|
built
1988
744 Owl Dr, Louisville, CO 80027
$-1,777
Cash flow
-12.4%
Cash-on-Cash Return
2.8%
Cap rate
0.4%
Rent to Value Ratio
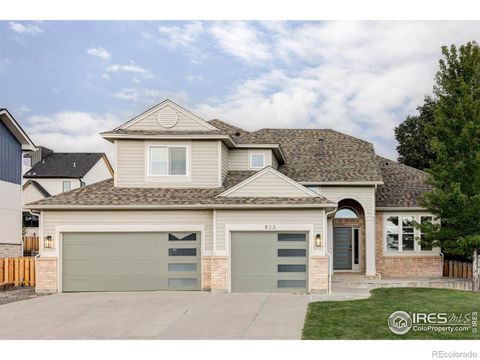
Active
$1,325,000
6
bds
|
5
ba
|
4,034
sqft
|
built
1992
823 Trail Ridge Dr, Louisville, CO 80027
$-3,889
Cash flow
-15.3%
Cash-on-Cash Return
2.2%
Cap rate
0.3%
Rent to Value Ratio
Active
$930,000
5
bds
|
3
ba
|
2,784
sqft
|
built
1977
215 Sunland St, Louisville, CO 80027
$-2,399
Cash flow
-13.5%
Cash-on-Cash Return
2.6%
Cap rate
0.4%
Rent to Value Ratio
Active
$695,000
3
bds
|
2
ba
|
1,642
sqft
|
built
1985
253 W Cedar Way, Louisville, CO 80027
$-1,699
Cash flow
-12.8%
Cash-on-Cash Return
2.7%
Cap rate
0.4%
Rent to Value Ratio
Active
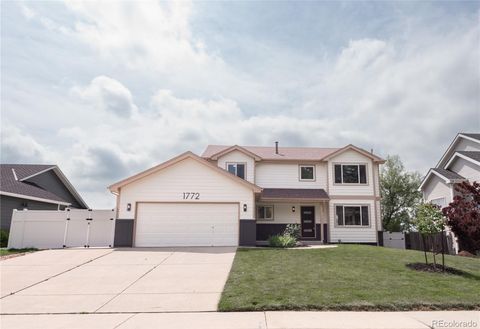
$1,039,000
4
bds
|
4
ba
|
2,758
sqft
|
built
1994
1772 Eisenhower Dr, Louisville, CO 80027
$-2,618
Cash flow
-13.1%
Cash-on-Cash Return
2.7%
Cap rate
0.4%
Rent to Value Ratio
Active
$2,200,000
5
bds
|
5
ba
|
4,404
sqft
|
built
2007
1108 Grant Ave, Louisville, CO 80027
$-6,051
Cash flow
-14.4%
Cash-on-Cash Return
2.4%
Cap rate
0.4%
Rent to Value Ratio
Active
$899,000
4
bds
|
2
ba
|
1,760
sqft
|
built
1983
106 S Madison Ave, Louisville, CO 80027
$-2,596
Cash flow
-15.1%
Cash-on-Cash Return
2.2%
Cap rate
0.3%
Rent to Value Ratio
Active
$500,000
3
bds
|
3
ba
|
1,550
sqft
|
built
1996
572 Ridgeview Dr, Louisville, CO 80027
$-1,144
Cash flow
-11.9%
Cash-on-Cash Return
2.9%
Cap rate
0.5%
Rent to Value Ratio
Active
$495,000
2
bds
|
2
ba
|
1,071
sqft
|
built
1996
546 Ridgeview Dr, Louisville, CO 80027
$-1,221
Cash flow
-12.9%
Cash-on-Cash Return
2.7%
Cap rate
0.5%
Rent to Value Ratio
Active
$469,000
3
bds
|
2
ba
|
1,238
sqft
|
built
1984
494 Owl Dr, Louisville, CO 80027
$-1,202
Cash flow
-13.4%
Cash-on-Cash Return
2.6%
Cap rate
0.5%
Rent to Value Ratio
Active
$737,999
3
bds
|
3
ba
|
2,385
sqft
|
built
2013
1851 Gallagher Ln, Louisville, CO 80027
$-2,262
Cash flow
-16.0%
Cash-on-Cash Return
2.0%
Cap rate
0.4%
Rent to Value Ratio
Active
$639,900
3
bds
|
2
ba
|
1,192
sqft
|
built
1982
298 S Hoover Ave, Louisville, CO 80027
$-1,388
Cash flow
-11.3%
Cash-on-Cash Return
3.1%
Cap rate
0.4%
Rent to Value Ratio
Active
$1,190,000
5
bds
|
3
ba
|
2,356
sqft
|
built
1990
902 Grove Dr, Louisville, CO 80027
$-2,767
Cash flow
-12.1%
Cash-on-Cash Return
2.9%
Cap rate
0.4%
Rent to Value Ratio
Active
$950,000
4
bds
|
4
ba
|
2,573
sqft
|
built
2018
1376 Snowberry Ln, Louisville, CO 80027
$-2,286
Cash flow
-12.6%
Cash-on-Cash Return
2.8%
Cap rate
0.4%
Rent to Value Ratio
Active
$1,199,900
5
bds
|
4
ba
|
3,661
sqft
|
built
2009
1362 Golden Eagle Way, Louisville, CO 80027
$-2,901
Cash flow
-12.6%
Cash-on-Cash Return
2.8%
Cap rate
0.4%
Rent to Value Ratio
Active
$750,000
3
bds
|
2
ba
|
1,590
sqft
|
built
1983
291 W Sycamore Ln, Louisville, CO 80027
$-1,910
Cash flow
-13.3%
Cash-on-Cash Return
2.6%
Cap rate
0.4%
Rent to Value Ratio
Active
$675,000
3
bds
|
1
ba
|
1,028
sqft
|
built
1979
946 W Willow St, Louisville, CO 80027
$-1,507
Cash flow
-11.6%
Cash-on-Cash Return
3.0%
Cap rate
0.4%
Rent to Value Ratio
Active
$1,325,000
4
bds
|
4
ba
|
3,936
sqft
|
built
1989
590 N Manorwood Ln, Louisville, CO 80027
$-4,193
Cash flow
-16.5%
Cash-on-Cash Return
1.9%
Cap rate
0.3%
Rent to Value Ratio
Active
$1,297,000
5
bds
|
3
ba
|
2,789
sqft
|
built
1990
539 Coal Creek Ln, Louisville, CO 80027
$-4,033
Cash flow
-16.2%
Cash-on-Cash Return
1.9%
Cap rate
0.3%
Rent to Value Ratio
Active
$899,900
3
bds
|
3
ba
|
2,253
sqft
|
built
1986
988 Cleveland Ct, Louisville, CO 80027
$-2,171
Cash flow
-12.6%
Cash-on-Cash Return
2.8%
Cap rate
0.4%
Rent to Value Ratio
Active
$875,000
4
bds
|
4
ba
|
2,782
sqft
|
built
1978
357 W Harper St, Louisville, CO 80027
$-2,130
Cash flow
-12.7%
Cash-on-Cash Return
2.8%
Cap rate
0.4%
Rent to Value Ratio
Active
$1,119,500
4
bds
|
2
ba
|
2,190
sqft
|
built
1962
503 Lois Dr, Louisville, CO 80027
$-3,222
Cash flow
-15.0%
Cash-on-Cash Return
2.2%
Cap rate
0.3%
Rent to Value Ratio
Active
$1,500,000
5
bds
|
4
ba
|
3,640
sqft
|
built
1993
810 Trail Ridge Dr, Louisville, CO 80027
$-5,067
Cash flow
-17.6%
Cash-on-Cash Return
1.6%
Cap rate
0.3%
Rent to Value Ratio
Active
$825,000
3
bds
|
3
ba
|
2,608
sqft
|
built
2014
1964 Steel St, Louisville, CO 80027
$-2,785
Cash flow
-17.6%
Cash-on-Cash Return
1.6%
Cap rate
0.4%
Rent to Value Ratio
Active
$1,575,000
5
bds
|
5
ba
|
4,007
sqft
|
built
2024
900 Eldorado Ln, Louisville, CO 80027
$-4,913
Cash flow
-16.3%
Cash-on-Cash Return
1.9%
Cap rate
0.2%
Rent to Value Ratio
Active
$699,000
3
bds
|
1
ba
|
1,080
sqft
|
built
1908
529 Main St, Louisville, CO 80027
$-1,713
Cash flow
-12.8%
Cash-on-Cash Return
2.7%
Cap rate
0.4%
Rent to Value Ratio
Active
$675,000
3
bds
|
2
ba
|
1,275
sqft
|
built
1971
111 Barbara St, Louisville, CO 80027
$-1,296
Cash flow
-10.0%
Cash-on-Cash Return
3.4%
Cap rate
0.5%
Rent to Value Ratio
Active
$875,000
3
bds
|
4
ba
|
2,486
sqft
|
built
2021
385 East St, Louisville, CO 80027
$-2,128
Cash flow
-12.7%
Cash-on-Cash Return
2.8%
Cap rate
0.5%
Rent to Value Ratio
Active
$759,900
2
bds
|
3
ba
|
2,048
sqft
|
built
2013
1856 Kalel Ln, Louisville, CO 80027
$-2,355
Cash flow
-16.2%
Cash-on-Cash Return
2.0%
Cap rate
0.4%
Rent to Value Ratio
Active
$1,200,000
5
bds
|
3
ba
|
3,555
sqft
|
built
1994
1919 Quail Ct, Louisville, CO 80027
$-3,470
Cash flow
-15.1%
Cash-on-Cash Return
2.2%
Cap rate
0.3%
Rent to Value Ratio