Macon, GA Investment Properties for Sale
Browse homes for sale and investment properties in Macon, GA. Refine your search by price, property type, or more.
Best cash flowing properties in Macon, GA
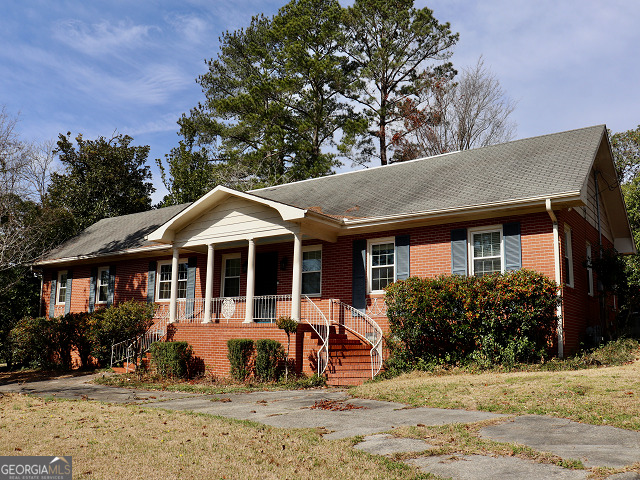
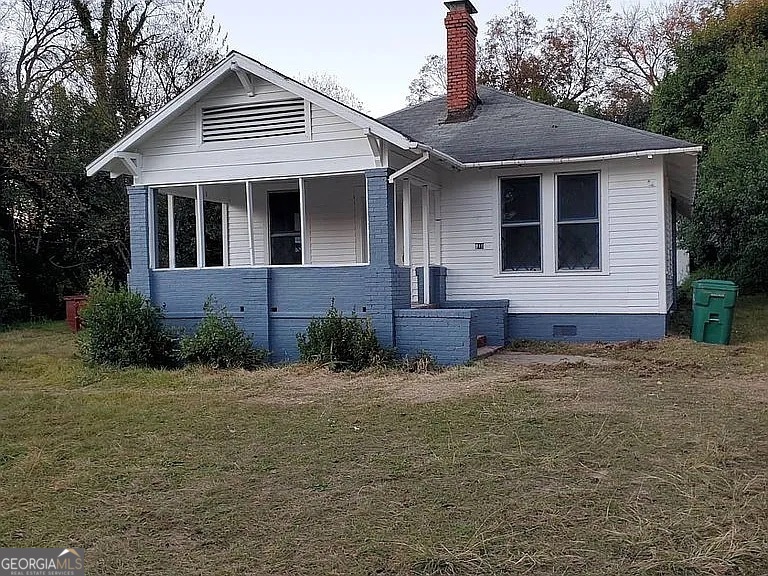
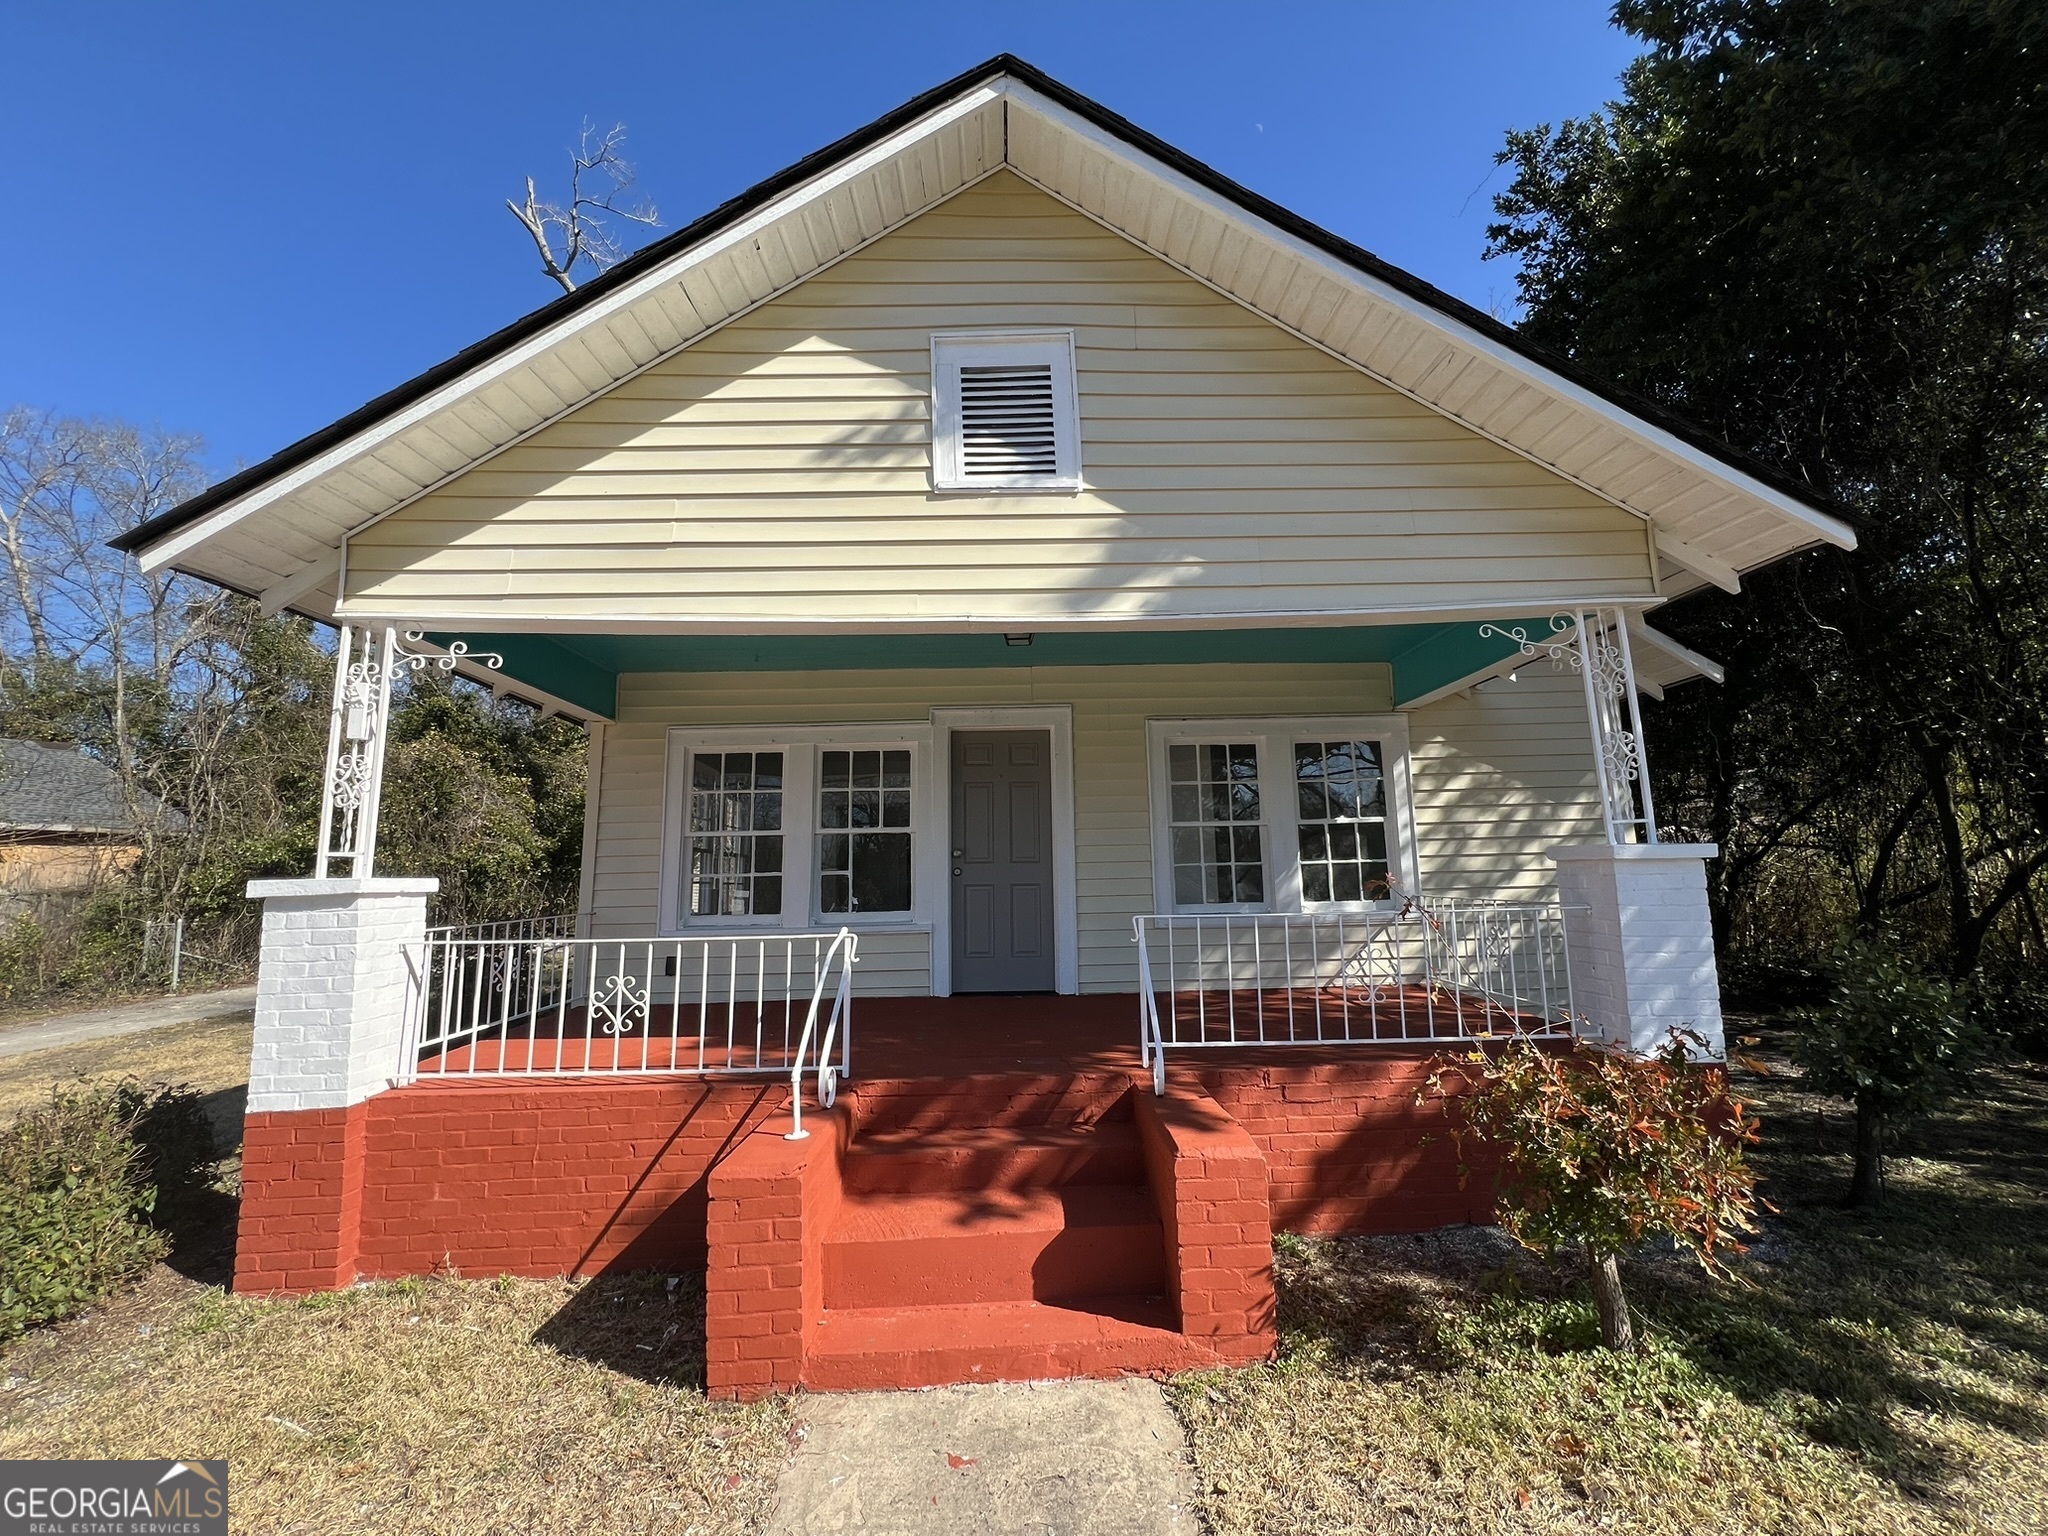
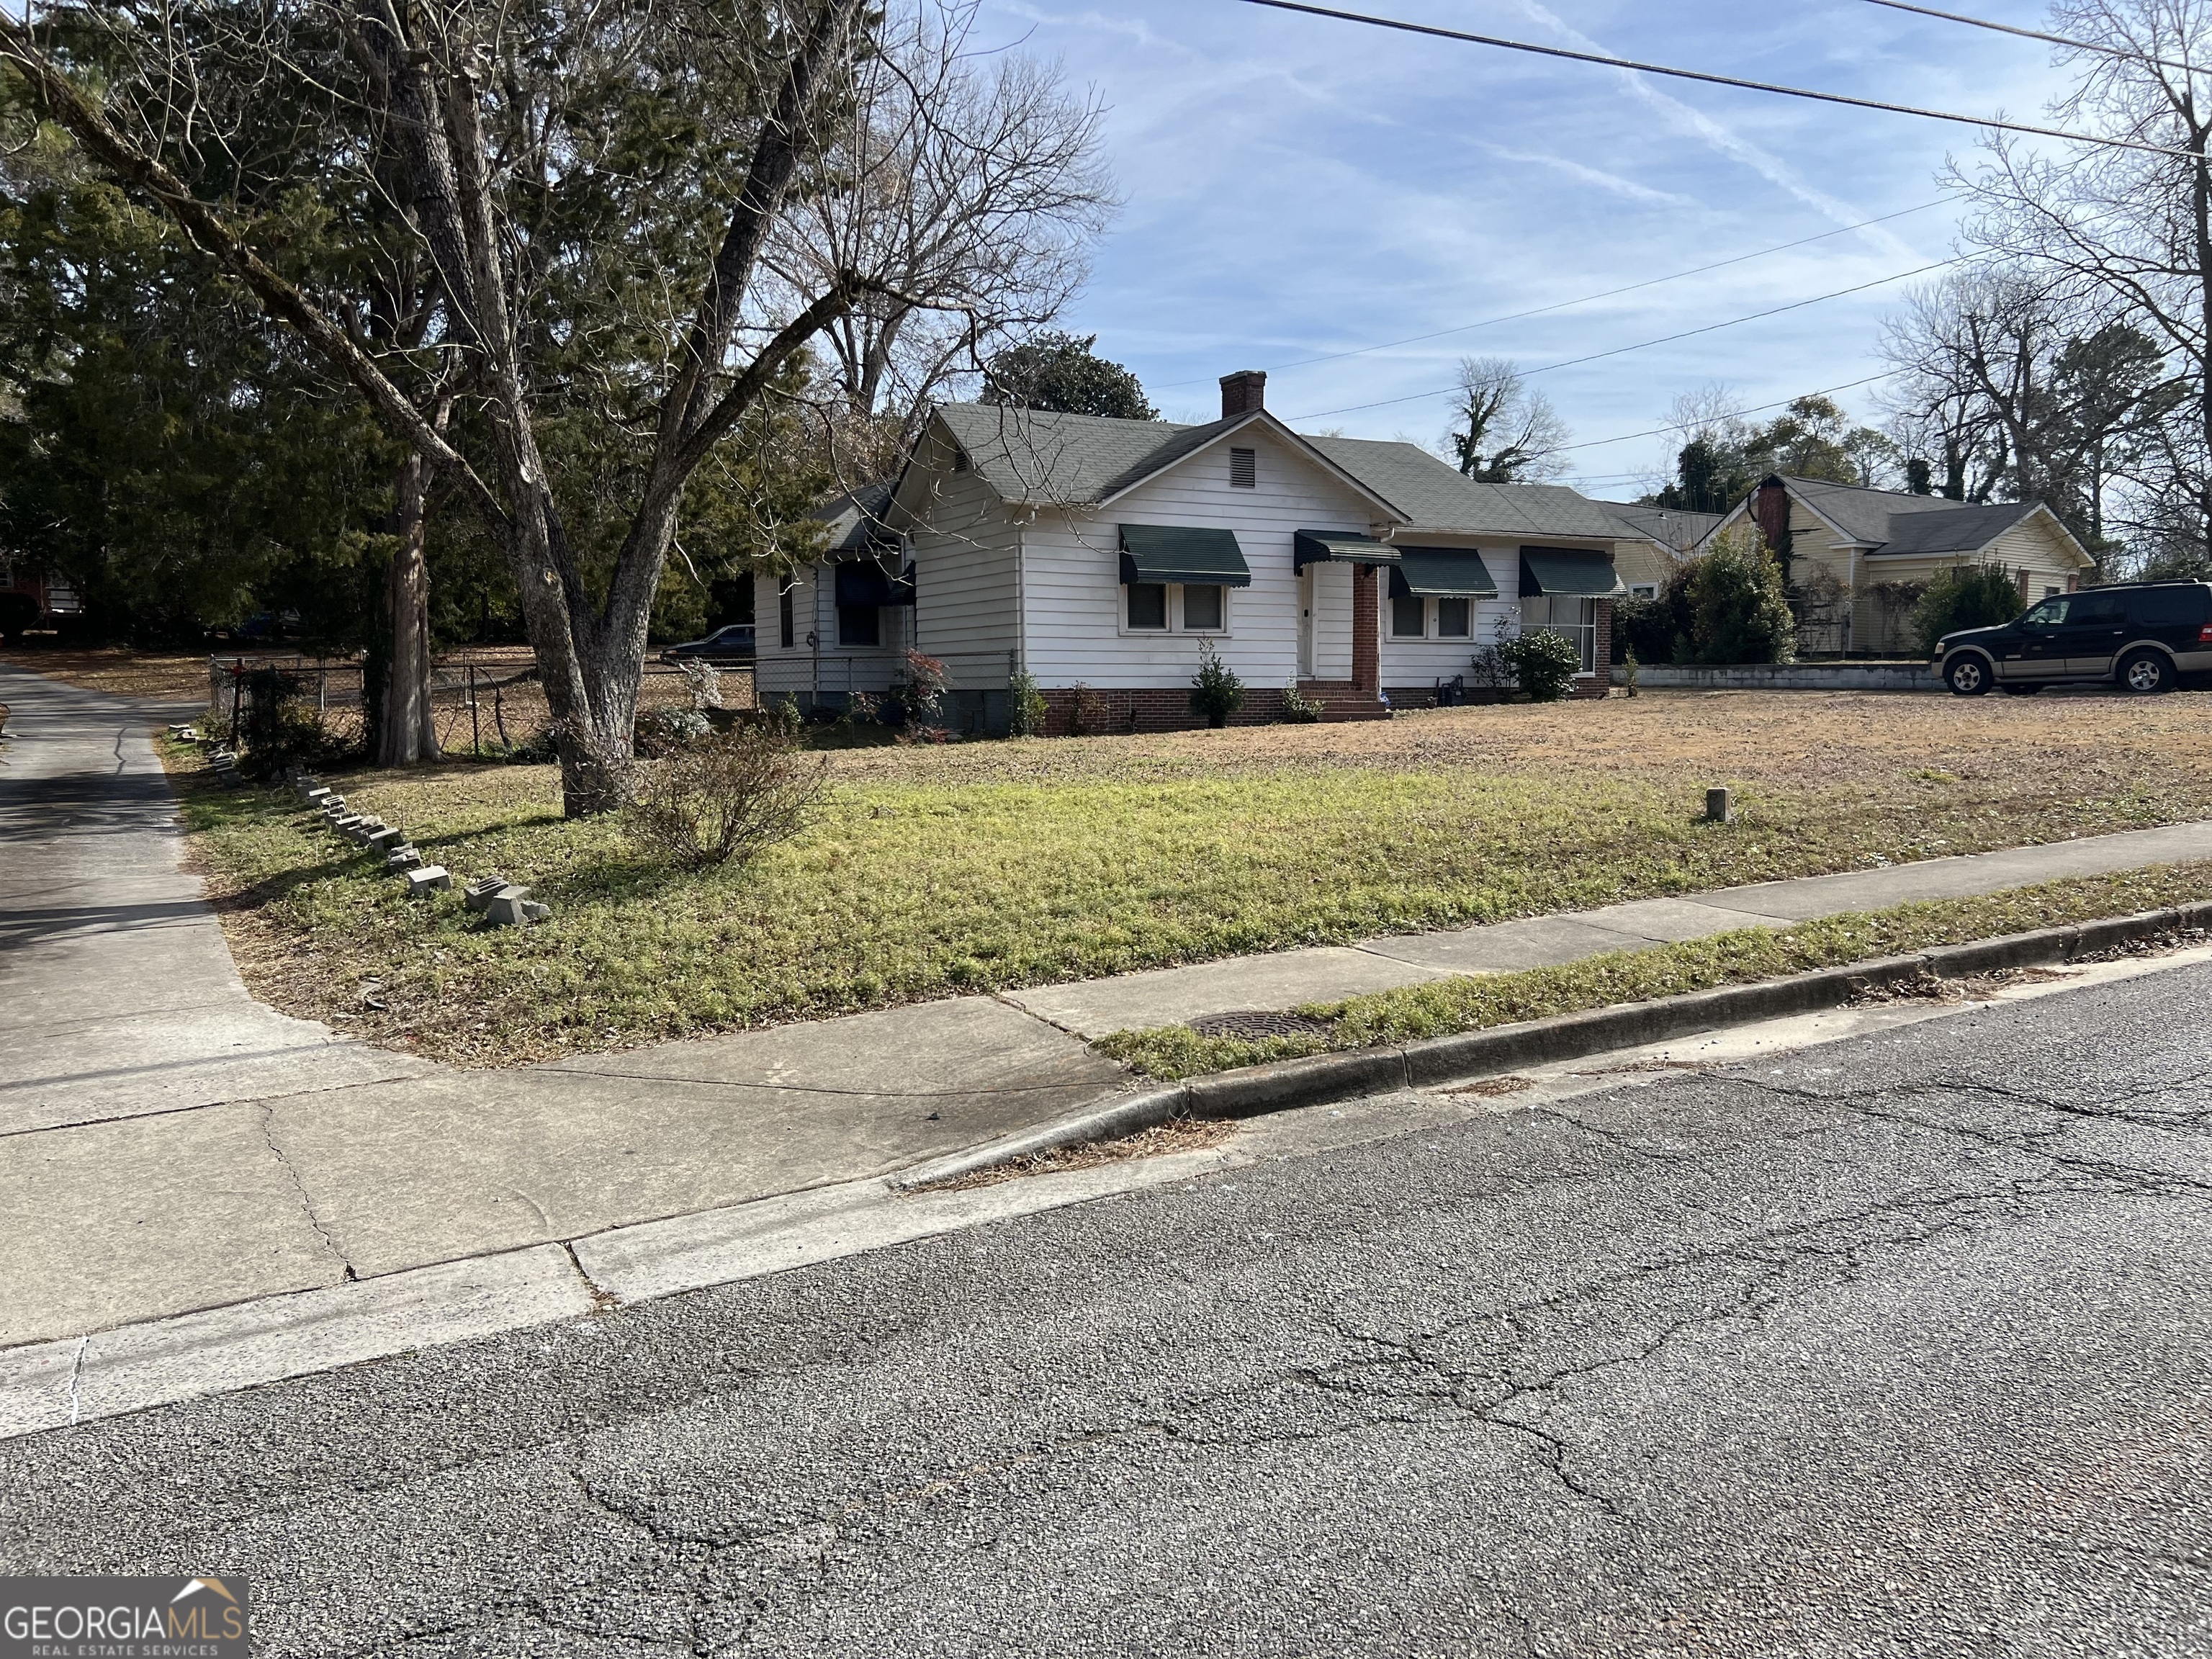
Active
$58,900
3
bds
|
0
ba
|
2,169
sqft
|
built
1930
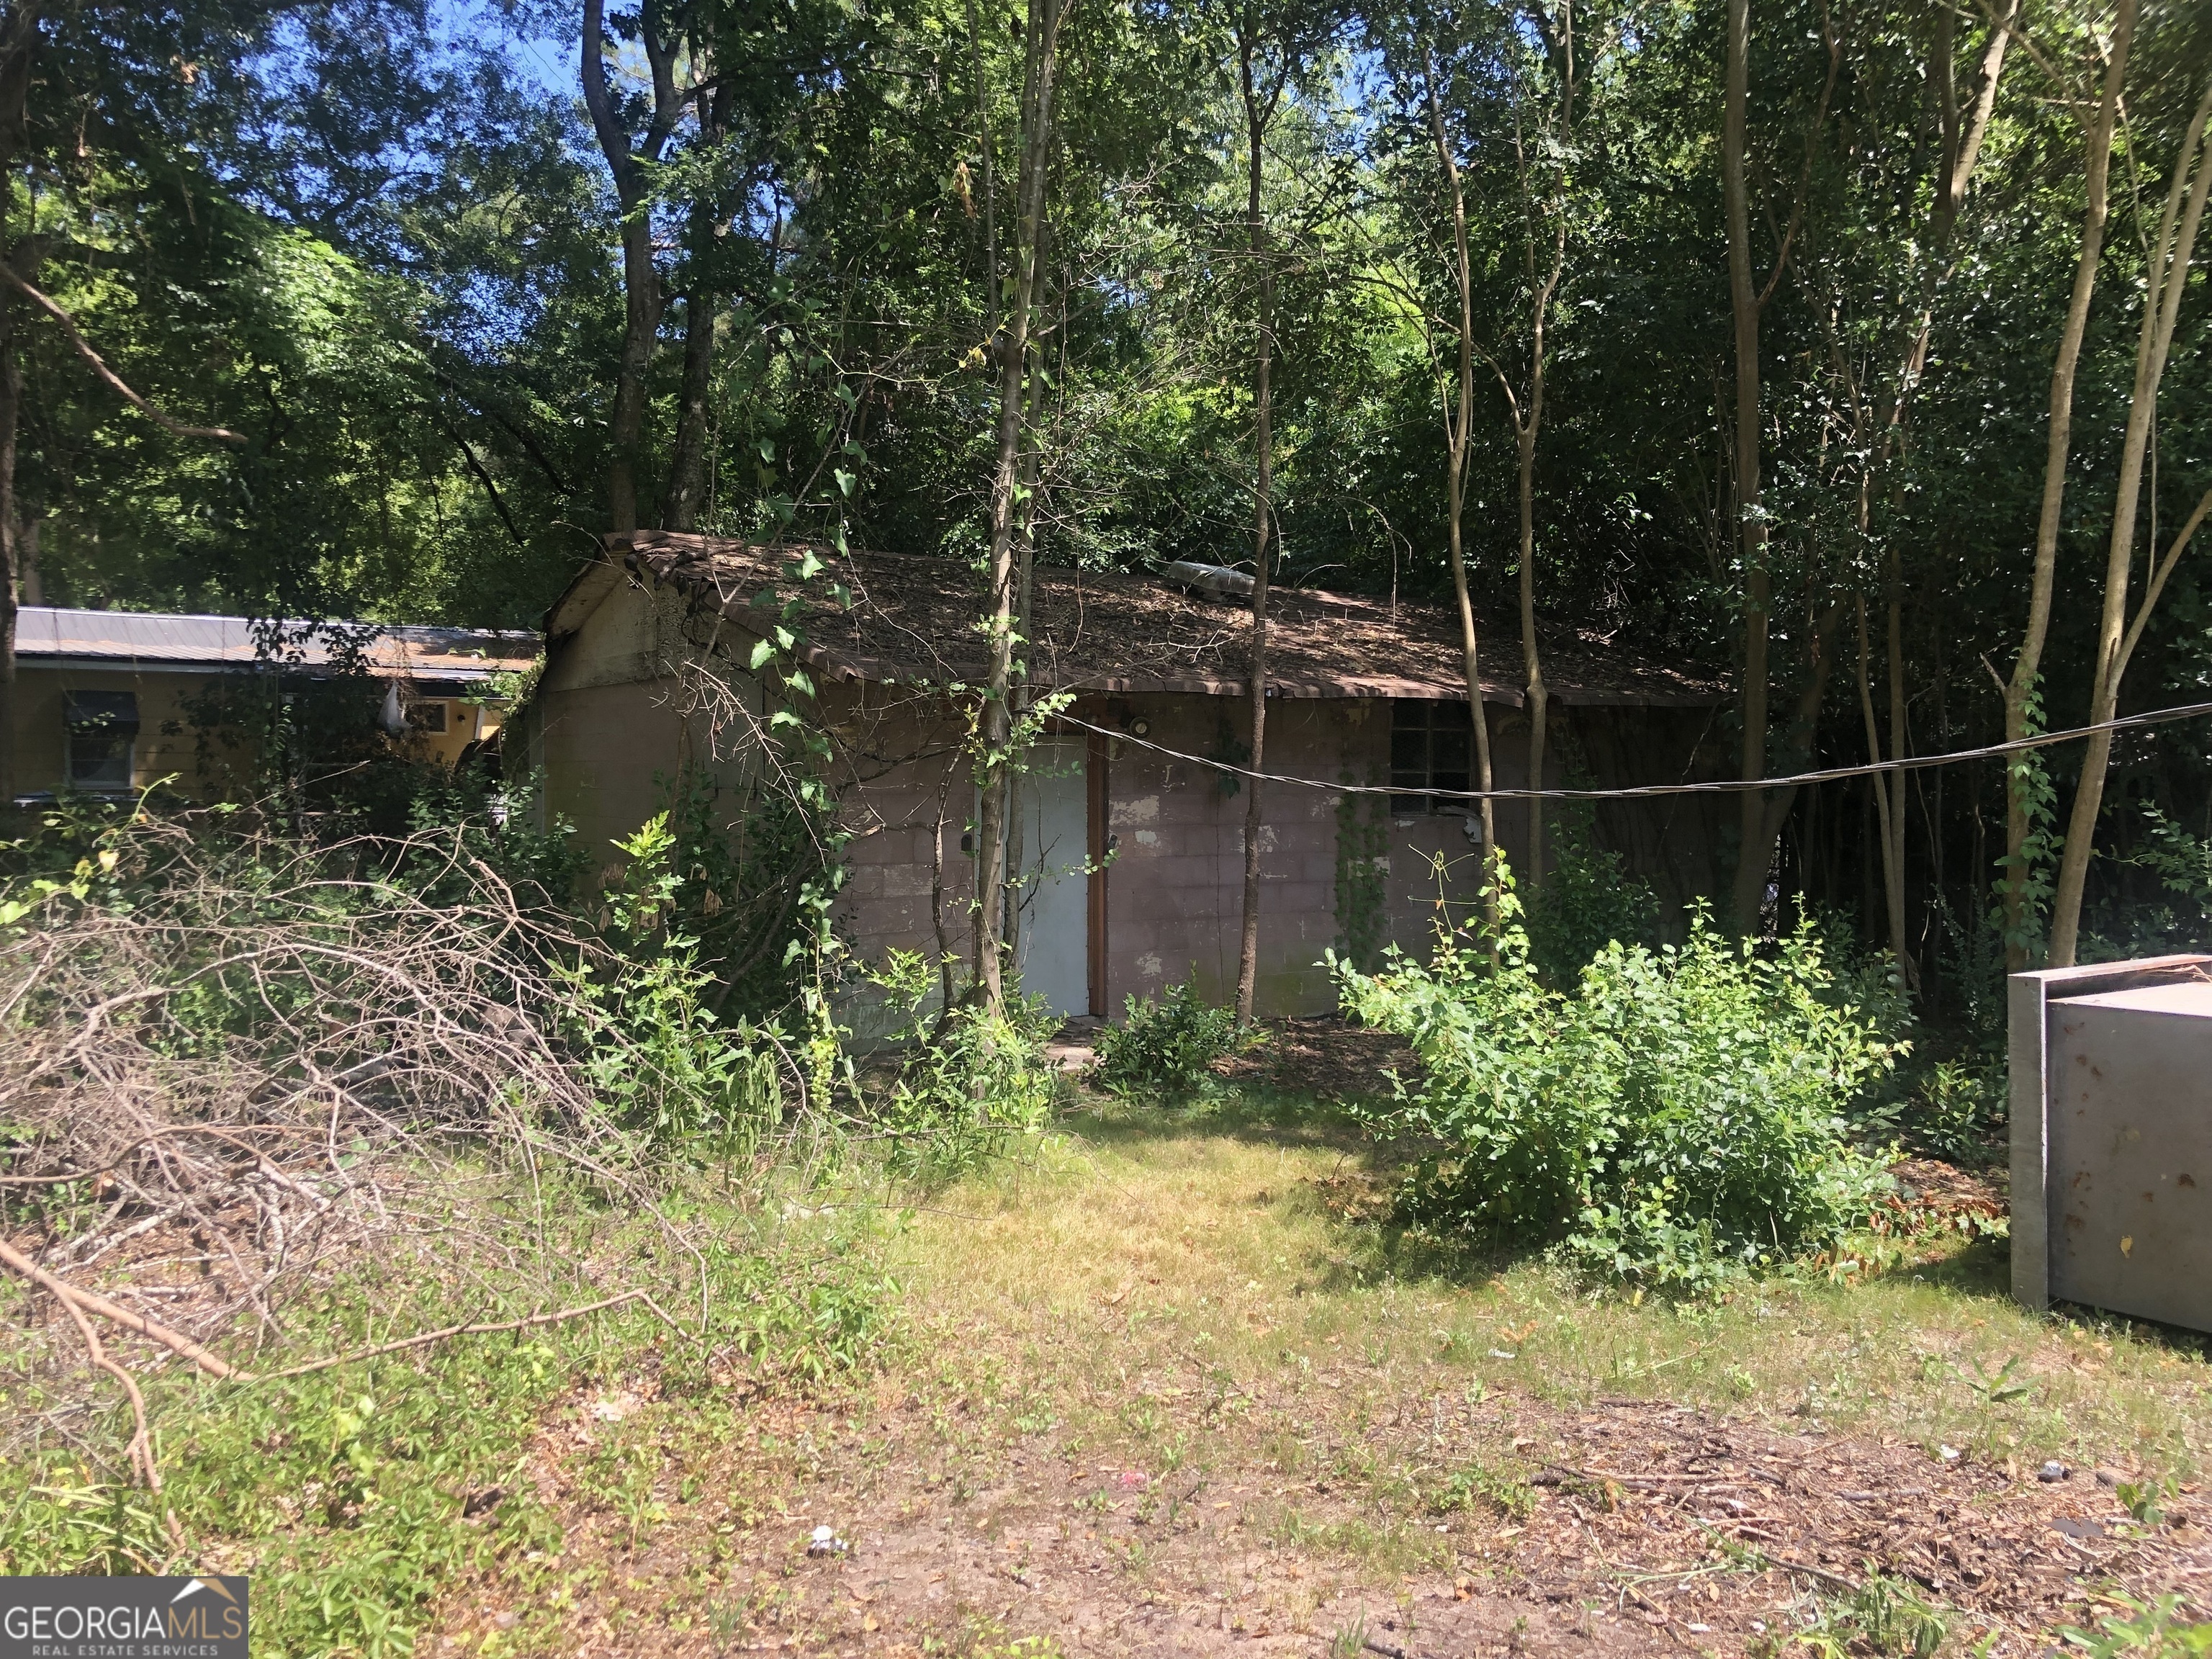
1195 Brentwood Ave, Macon, GA 31204
$1,073
Cash flow
21.2%
Cash-on-Cash Return
21.9%
Cap rate
2.7%
Rent to Value Ratio
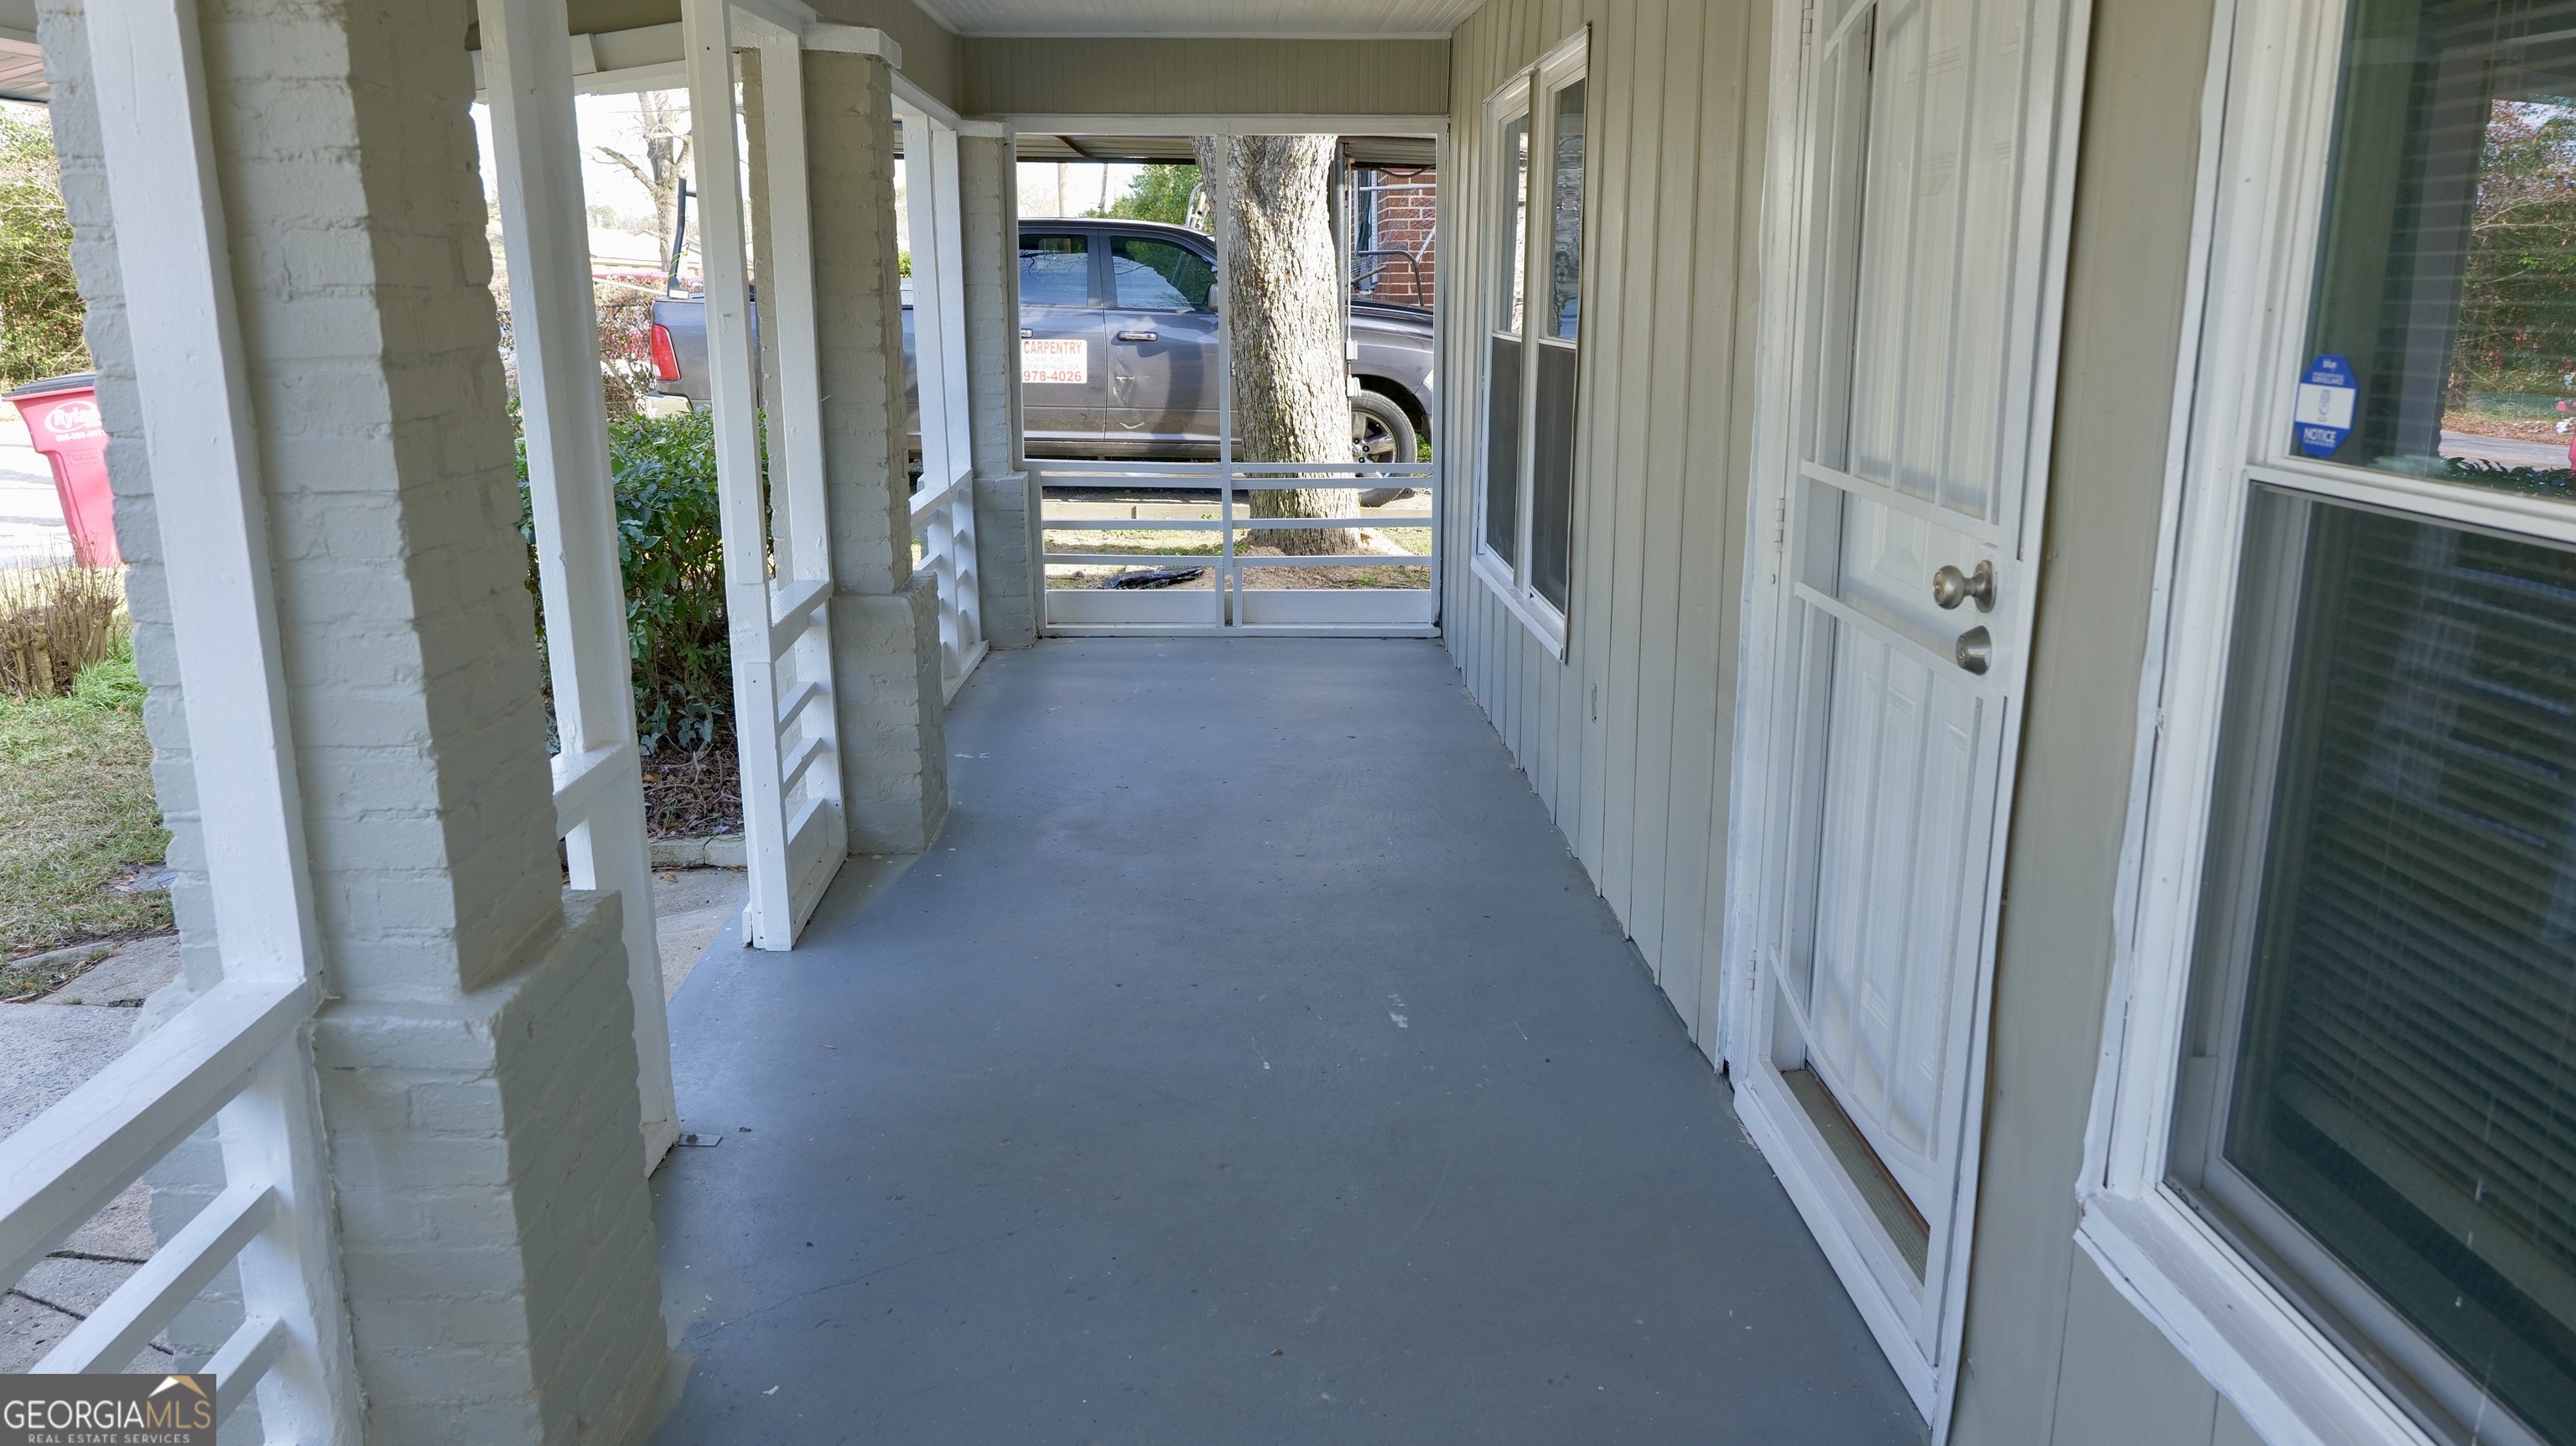
Active
$64,999
2
bds
|
0
ba
|
1,188
sqft
|
built
1940
212 Cordele Ave, Macon, GA 31217
$846
Cash flow
15.2%
Cash-on-Cash Return
15.6%
Cap rate
2.0%
Rent to Value Ratio
500 out of 517 properties for sale in Macon, GA
Limited Results Shown
Create a free account, or log in to reveal all property listings and enjoy the complete experience.
Active
$64,999
2
bds
|
0
ba
|
1,188
sqft
|
built
1940
212 Cordele Ave, Macon, GA 31217
$846
Cash flow
15.2%
Cash-on-Cash Return
15.6%
Cap rate
2.0%
Rent to Value Ratio
Active
$115,000
3
bds
|
0
ba
|
1,406
sqft
|
built
1951
1060 Cypress Dr, Macon, GA 31204
$440
Cash flow
20.0%
Cash-on-Cash Return
10.7%
Cap rate
1.4%
Rent to Value Ratio
Active
$85,000
3
bds
|
0
ba
|
982
sqft
|
built
1945
1121 Carroll St, Macon, GA 31206
$282
Cash flow
17.3%
Cash-on-Cash Return
10.1%
Cap rate
1.3%
Rent to Value Ratio
Active
$310,000
5
bds
|
0
ba
|
3,718
sqft
|
built
1959
2939 General Lee Rd, Macon, GA 31204
$-436
Cash flow
-7.3%
Cash-on-Cash Return
4.5%
Cap rate
0.6%
Rent to Value Ratio
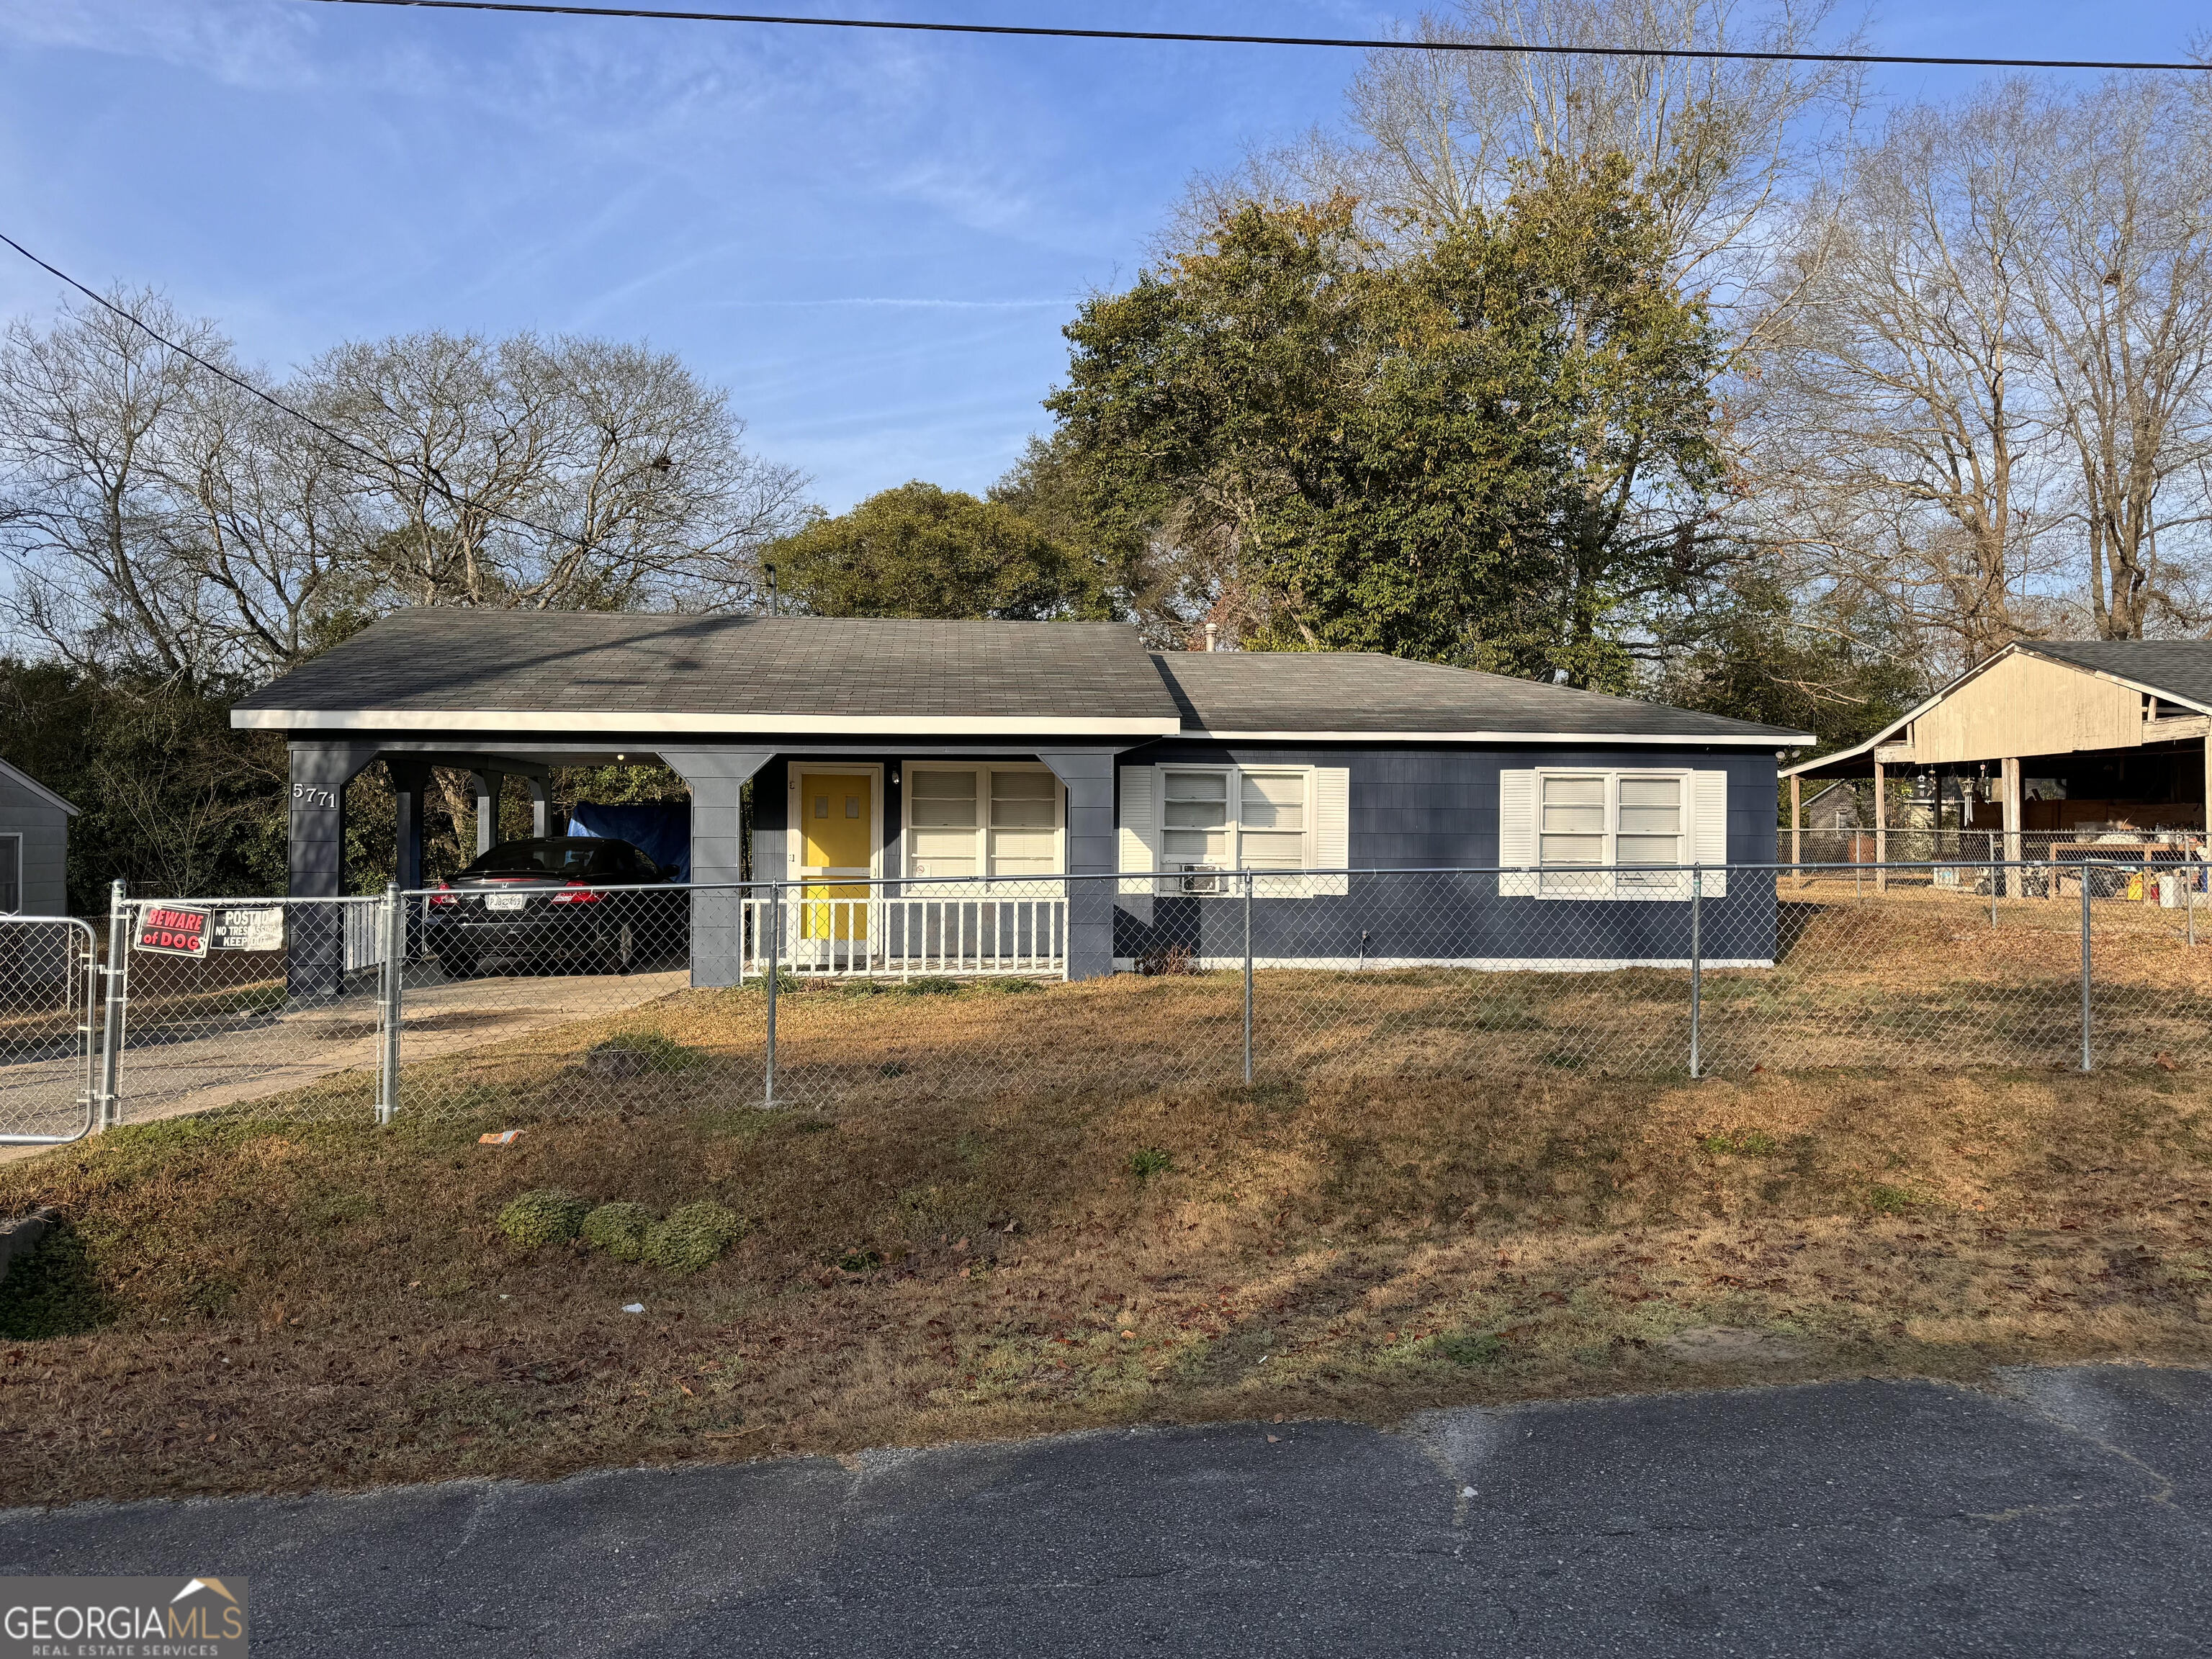
Active
$119,000
bds
|
0
ba
|
0
sqft
|
built
1959
5771 Satterfield Dr, Macon, GA 31206
$113
Cash flow
5.0%
Cash-on-Cash Return
7.3%
Cap rate
0.9%
Rent to Value Ratio
Active
$155,000
4
bds
|
0
ba
|
1,330
sqft
|
built
1920
4195 Mikado Ave, Macon, GA 31206
$-89
Cash flow
-3.0%
Cash-on-Cash Return
5.5%
Cap rate
0.7%
Rent to Value Ratio
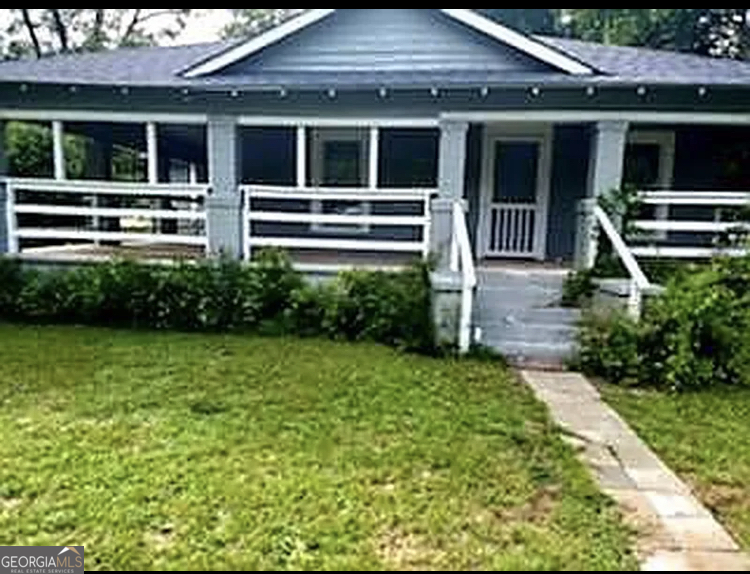
Active
$144,400
bds
|
0
ba
|
0
sqft
|
built
1936
697 Grenada Ter, Macon, GA 31206
$157
Cash flow
5.7%
Cash-on-Cash Return
7.5%
Cap rate
1.0%
Rent to Value Ratio
Active
$149,150
bds
|
0
ba
|
0
sqft
|
built
1925
749 Grenada Ter, Macon, GA 31206
$146
Cash flow
5.1%
Cash-on-Cash Return
7.3%
Cap rate
0.9%
Rent to Value Ratio
Active
$525,000
5
bds
|
0
ba
|
3,420
sqft
|
built
1981
4804 Brittany Dr, Macon, GA 31210
$-892
Cash flow
-8.9%
Cash-on-Cash Return
4.1%
Cap rate
0.6%
Rent to Value Ratio

Active
$132,000
3
bds
|
2
ba
|
0
sqft
|
built
1954
4263 Vallie Dr, Macon, GA 31204
$386
Cash flow
15.3%
Cash-on-Cash Return
9.7%
Cap rate
1.2%
Rent to Value Ratio
Active
$189,500
3
bds
|
0
ba
|
1,440
sqft
|
built
1985
260 Edgewater Dr, Macon, GA 31220
$-31
Cash flow
-0.9%
Cash-on-Cash Return
6.0%
Cap rate
0.8%
Rent to Value Ratio
Active
$105,000
4
bds
|
0
ba
|
1,108
sqft
|
built
1956
4255 Vinson Ave, Macon, GA 31206
$270
Cash flow
13.4%
Cash-on-Cash Return
9.2%
Cap rate
1.1%
Rent to Value Ratio
Active under contract
$90,000
3
bds
|
0
ba
|
988
sqft
|
built
1939
1426 Bailey Ave, Macon, GA 31204
$460
Cash flow
26.7%
Cash-on-Cash Return
12.3%
Cap rate
1.6%
Rent to Value Ratio
Active
$113,990
3
bds
|
0
ba
|
1,058
sqft
|
built
1924
1016 W Grenada Ter, Macon, GA 31206
$277
Cash flow
12.7%
Cash-on-Cash Return
9.1%
Cap rate
1.1%
Rent to Value Ratio
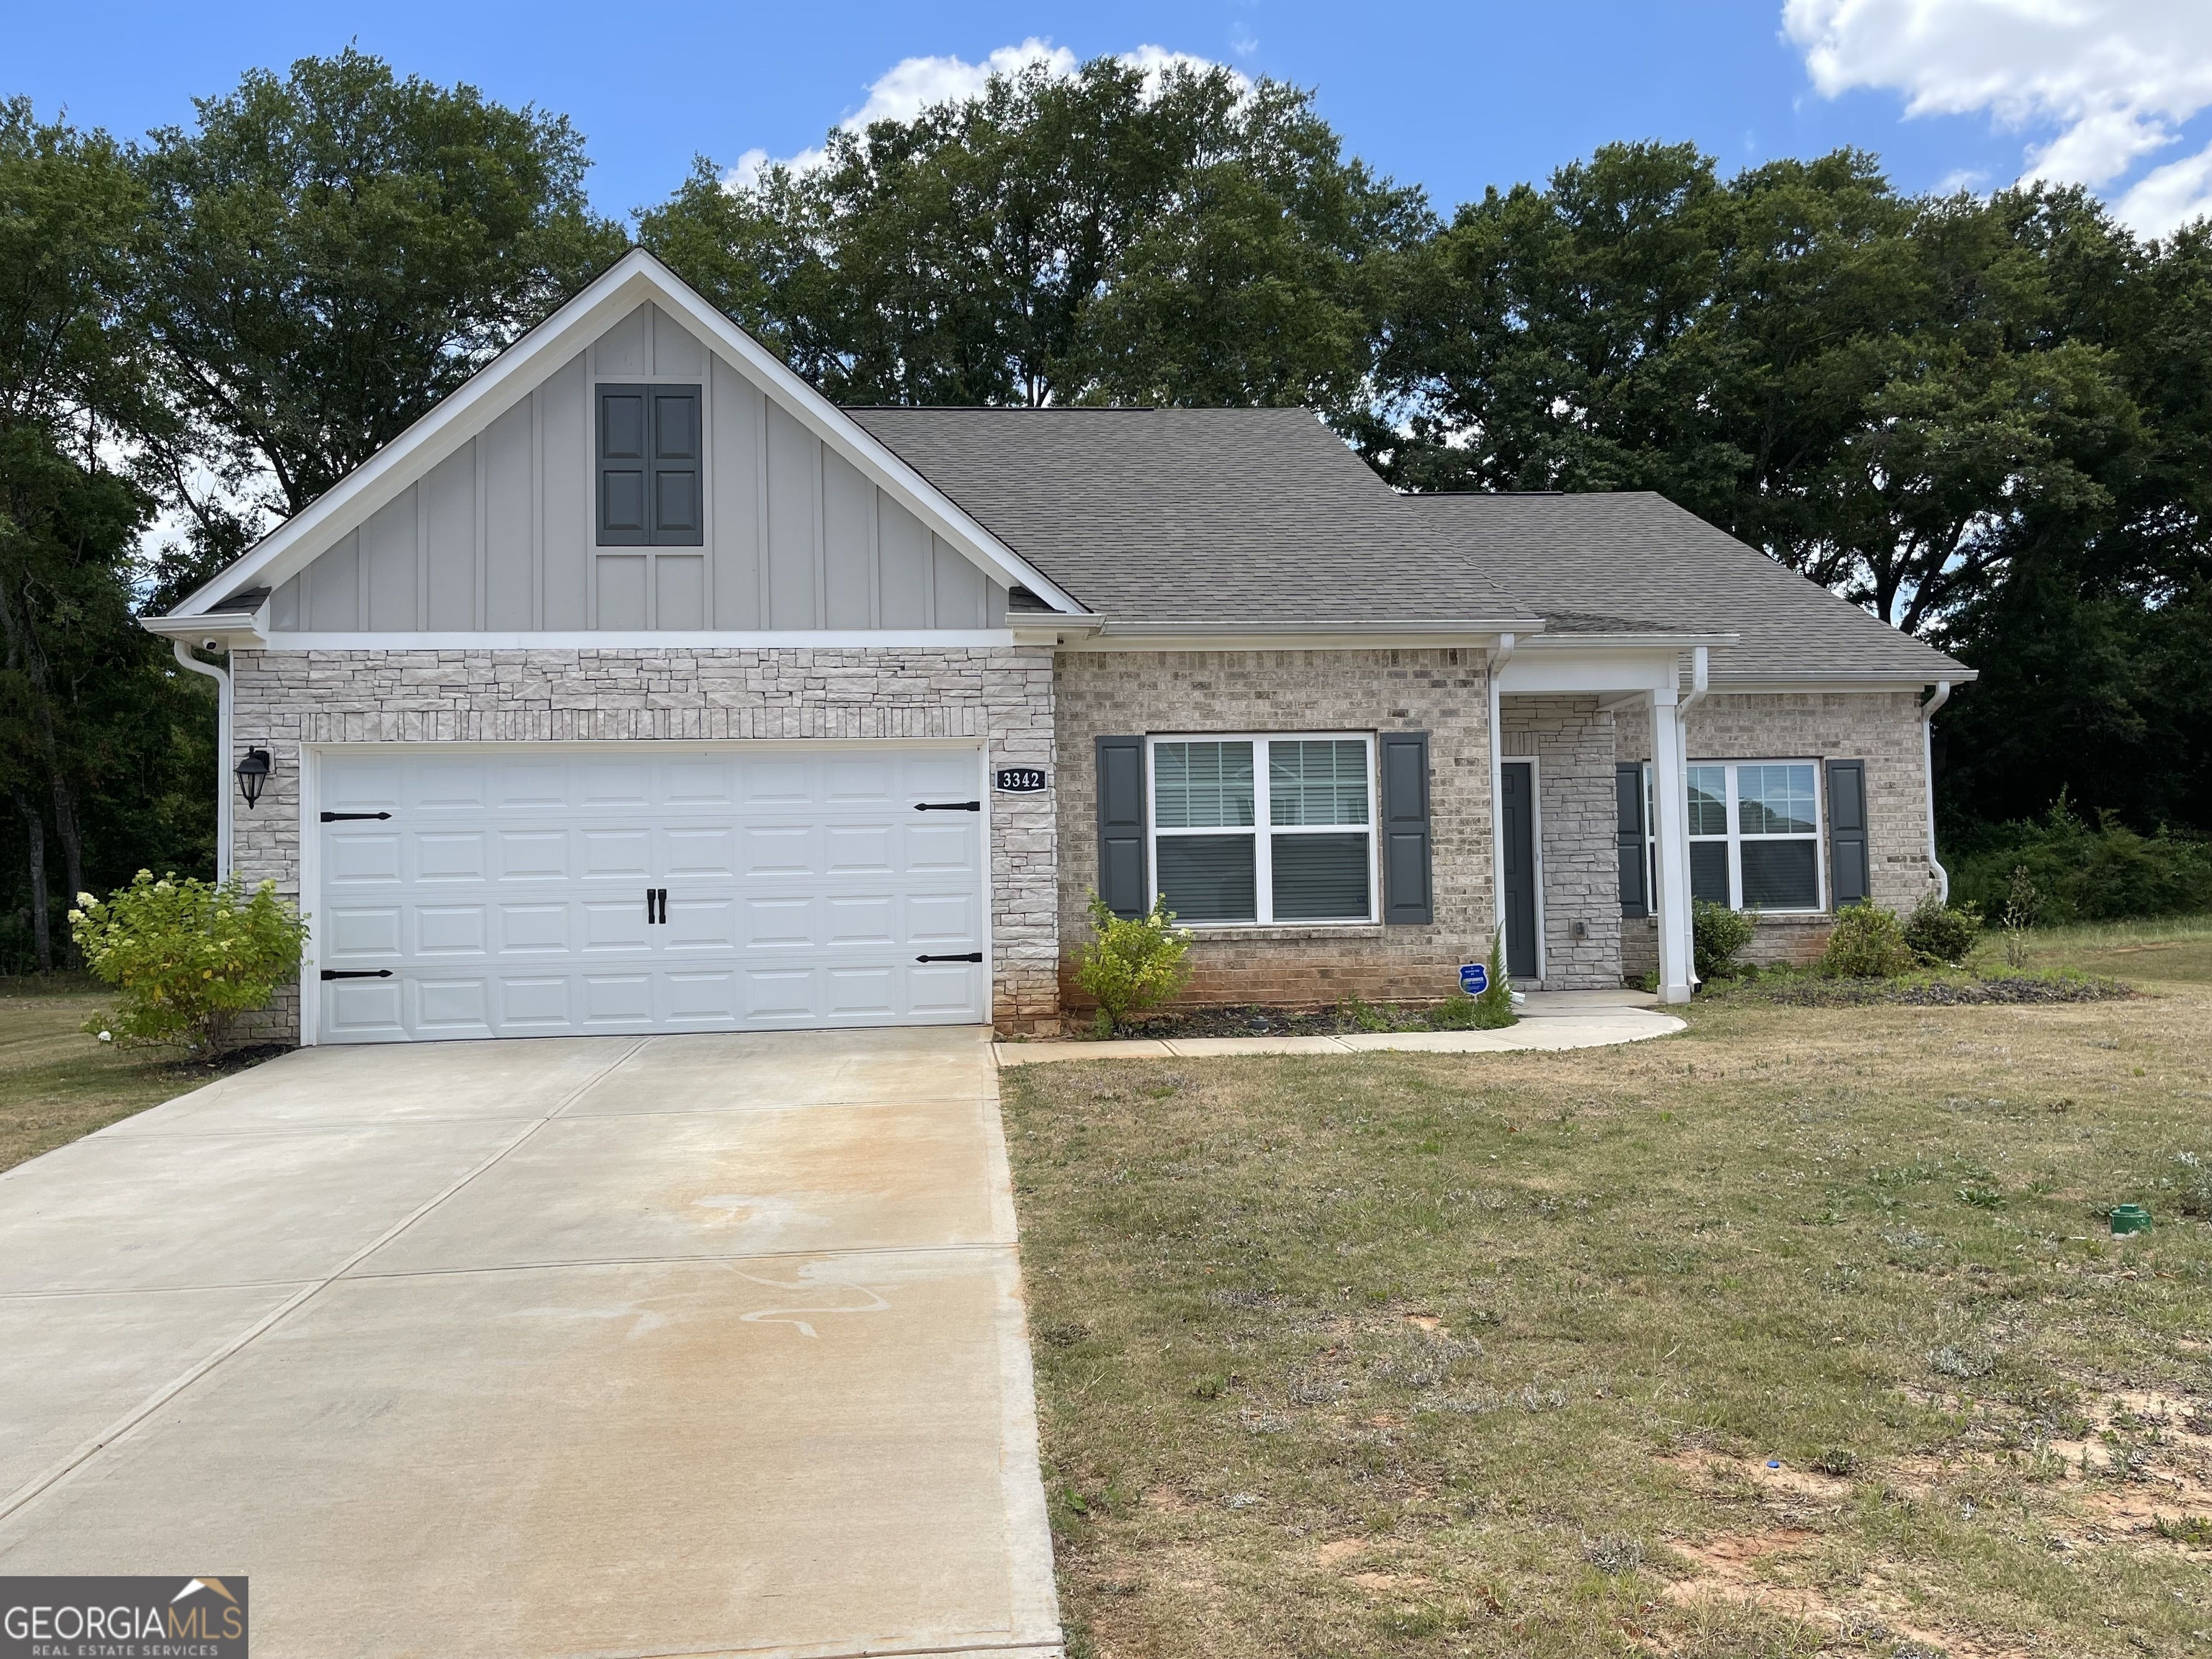
Active under contract
$249,900
4
bds
|
0
ba
|
2,111
sqft
|
built
2022
3342 Bridgewood Dr, Macon, GA 31216
$-194
Cash flow
-4.1%
Cash-on-Cash Return
5.2%
Cap rate
0.8%
Rent to Value Ratio

Active
$147,000
3
bds
|
2
ba
|
0
sqft
|
built
1953
4447 Pharr Ave, Macon, GA 31204
$298
Cash flow
10.6%
Cash-on-Cash Return
8.6%
Cap rate
1.1%
Rent to Value Ratio
Active
$84,900
3
bds
|
0
ba
|
1,409
sqft
|
built
1955
3413 Millerfield Rd, Macon, GA 31211
$183
Cash flow
11.2%
Cash-on-Cash Return
8.7%
Cap rate
1.2%
Rent to Value Ratio
Active
$119,500
3
bds
|
0
ba
|
1,128
sqft
|
built
1954
4220 Elkan Ave, Macon, GA 31206
$311
Cash flow
13.6%
Cash-on-Cash Return
9.3%
Cap rate
1.2%
Rent to Value Ratio
Active
$144,900
3
bds
|
0
ba
|
1,332
sqft
|
built
1949
980 Curry Pl, Macon, GA 31211
$-46
Cash flow
-1.7%
Cash-on-Cash Return
5.8%
Cap rate
0.8%
Rent to Value Ratio
Active
$49,000
2
bds
|
0
ba
|
582
sqft
|
built
1900
323 Spikes St, Macon, GA 31206
$549
Cash flow
13.1%
Cash-on-Cash Return
13.4%
Cap rate
1.6%
Rent to Value Ratio
Active
$129,900
3
bds
|
0
ba
|
1,624
sqft
|
built
1920
4052 Mikado Ave, Macon, GA 31206
$311
Cash flow
12.5%
Cash-on-Cash Return
9.0%
Cap rate
1.2%
Rent to Value Ratio
Active
$58,900
3
bds
|
0
ba
|
2,169
sqft
|
built
1930
1195 Brentwood Ave, Macon, GA 31204
$1,073
Cash flow
21.2%
Cash-on-Cash Return
21.9%
Cap rate
2.7%
Rent to Value Ratio
Active
$99,990
2
bds
|
0
ba
|
1,506
sqft
|
built
1952
2229 New Clinton Rd, Macon, GA 31217
$314
Cash flow
16.4%
Cash-on-Cash Return
9.9%
Cap rate
1.3%
Rent to Value Ratio
Active
$26,000
3
bds
|
0
ba
|
1,080
sqft
|
built
1955
1263 Hillridge Dr, Macon, GA 31206
$658
Cash flow
29.5%
Cash-on-Cash Return
30.4%
Cap rate
3.8%
Rent to Value Ratio
Active
$36,000
2
bds
|
0
ba
|
875
sqft
|
built
1900
4062 Broadway, Macon, GA 31206
$602
Cash flow
19.5%
Cash-on-Cash Return
20.1%
Cap rate
2.5%
Rent to Value Ratio
Active
$27,000
2
bds
|
0
ba
|
1,177
sqft
|
built
1900
2186 Neal Ave, Macon, GA 31204
$667
Cash flow
28.8%
Cash-on-Cash Return
29.6%
Cap rate
3.7%
Rent to Value Ratio
Active
$318,000
5
bds
|
3
ba
|
0
sqft
|
built
2020
4001 Liberty Estates Dr, Macon, GA 31216
$-226
Cash flow
-3.7%
Cash-on-Cash Return
5.3%
Cap rate
0.7%
Rent to Value Ratio
Active
$145,000
3
bds
|
0
ba
|
1,428
sqft
|
built
1860
392 Taylor Ave, Macon, GA 31217
$199
Cash flow
7.2%
Cash-on-Cash Return
7.8%
Cap rate
1.1%
Rent to Value Ratio
Active
$88,500
2
bds
|
0
ba
|
960
sqft
|
built
1994
1463 Bankston Ave, Macon, GA 31204
$253
Cash flow
14.9%
Cash-on-Cash Return
9.6%
Cap rate
1.2%
Rent to Value Ratio
Active
$31,000
3
bds
|
0
ba
|
980
sqft
|
built
1958
470 Holloway St, Macon, GA 31206
$681
Cash flow
25.6%
Cash-on-Cash Return
26.4%
Cap rate
3.2%
Rent to Value Ratio
Active
$105,000
3
bds
|
0
ba
|
891
sqft
|
built
1967
4354 Elkan Ave, Macon, GA 31206
$189
Cash flow
9.4%
Cash-on-Cash Return
8.3%
Cap rate
1.0%
Rent to Value Ratio
Active
$58,000
2
bds
|
0
ba
|
828
sqft
|
built
1953
4143 San Carlos Dr, Macon, GA 31206
$523
Cash flow
10.5%
Cash-on-Cash Return
10.8%
Cap rate
1.4%
Rent to Value Ratio
Active
$100,000
3
bds
|
0
ba
|
1,200
sqft
|
built
1943
3390 Mary Dr, Macon, GA 31204
$364
Cash flow
19.0%
Cash-on-Cash Return
10.5%
Cap rate
1.3%
Rent to Value Ratio
Active
$74,900
3
bds
|
0
ba
|
1,056
sqft
|
built
1970
3388 Majestic Ln, Macon, GA 31217
$648
Cash flow
10.1%
Cash-on-Cash Return
10.4%
Cap rate
1.3%
Rent to Value Ratio
Active
$375,999
4
bds
|
0
ba
|
3,094
sqft
|
built
1928
2733 Hillcrest Ave, Macon, GA 31204
$-208
Cash flow
-2.9%
Cash-on-Cash Return
5.5%
Cap rate
0.7%
Rent to Value Ratio
Active
$245,000
4
bds
|
0
ba
|
1,800
sqft
|
built
2020
1540 Austin Dr, Macon, GA 31217
$-197
Cash flow
-4.2%
Cash-on-Cash Return
5.2%
Cap rate
0.7%
Rent to Value Ratio
Active
$57,000
3
bds
|
0
ba
|
792
sqft
|
built
1955
2431 Vivian Dr, Macon, GA 31206
$591
Cash flow
12.1%
Cash-on-Cash Return
12.4%
Cap rate
1.6%
Rent to Value Ratio
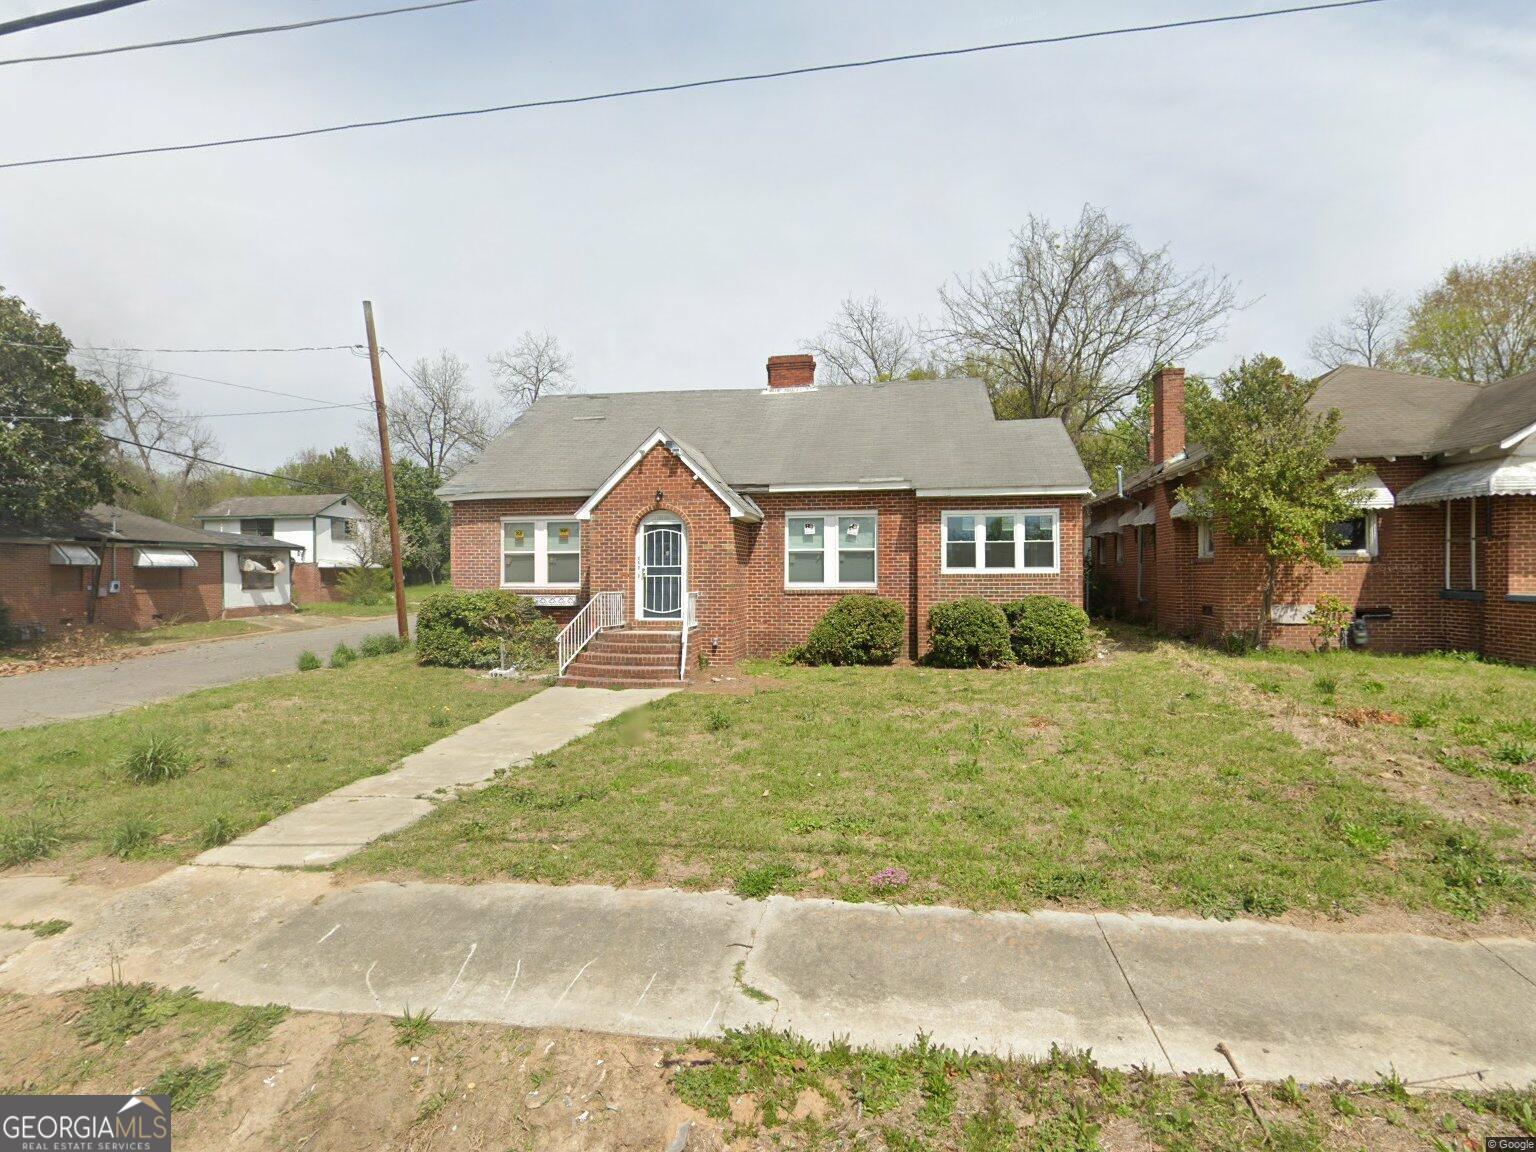
Active
$294,000
bds
|
0
ba
|
0
sqft
|
built
1920
1278 Jackson St, Macon, GA 31201
$167
Cash flow
3.0%
Cash-on-Cash Return
6.8%
Cap rate
0.9%
Rent to Value Ratio
Active
$37,000
2
bds
|
0
ba
|
864
sqft
|
built
1959
5746 Sterling Pl, Macon, GA 31206
$517
Cash flow
16.3%
Cash-on-Cash Return
16.8%
Cap rate
2.2%
Rent to Value Ratio
Active
$45,000
2
bds
|
0
ba
|
820
sqft
|
built
1942
524 Ormond Ter, Macon, GA 31206
$595
Cash flow
15.4%
Cash-on-Cash Return
15.9%
Cap rate
2.0%
Rent to Value Ratio