Marshfield, MA Investment Properties for Sale
Browse homes for sale and investment properties in Marshfield, MA. Refine your search by price, property type, or more.
Best cash flowing properties in Marshfield, MA
Active
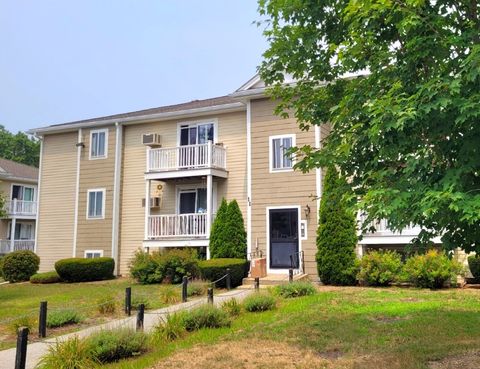
$289,000
2
bds
|
1
ba
|
923
sqft
|
built
1973
451 School St, Marshfield, MA 02050
$-173
Cash flow
-3.1%
Cash-on-Cash Return
5.0%
Cap rate
0.9%
Rent to Value Ratio
Active
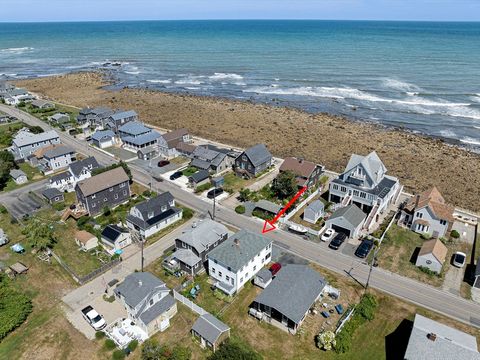
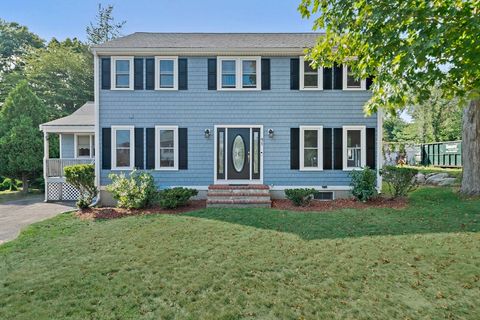
$629,900
4
bds
|
2
ba
|
1,826
sqft
|
built
1929
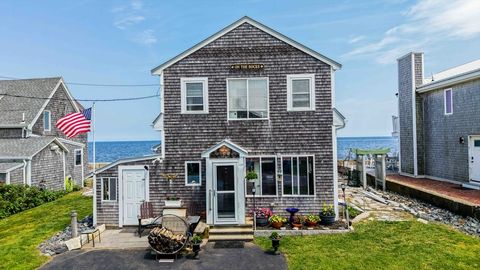
53 Ocean St, Marshfield, MA 02050
$-1,182
Cash flow
-9.8%
Cash-on-Cash Return
3.4%
Cap rate
0.5%
Rent to Value Ratio
22 out of 27 properties for sale in Marshfield, MA
Limited Results Shown
Create a free account, or log in to reveal all property listings and enjoy the complete experience.
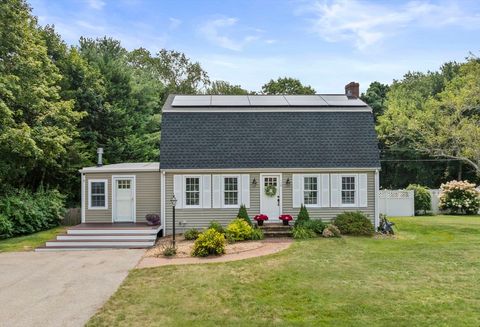
Active
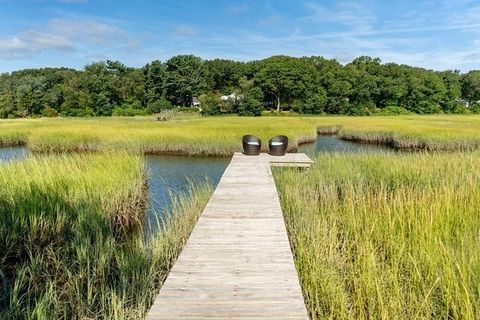
$949,000
3
bds
|
2
ba
|
2,178
sqft
|
built
2001
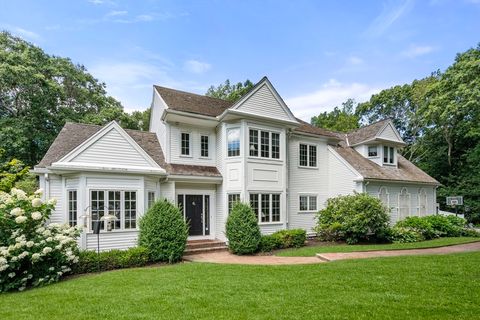
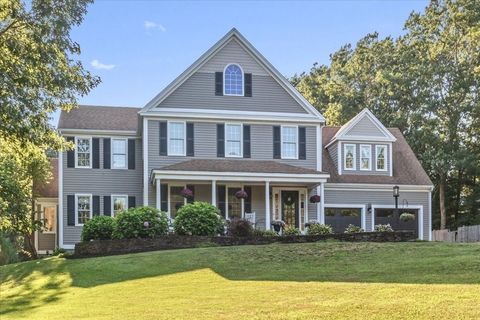
55 Macombers Way, Marshfield, MA 02050
$-2,457
Cash flow
-13.5%
Cash-on-Cash Return
2.6%
Cap rate
0.4%
Rent to Value Ratio
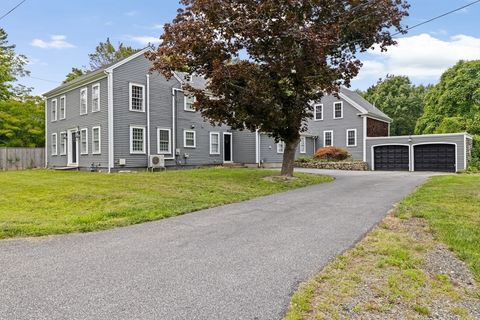
Active
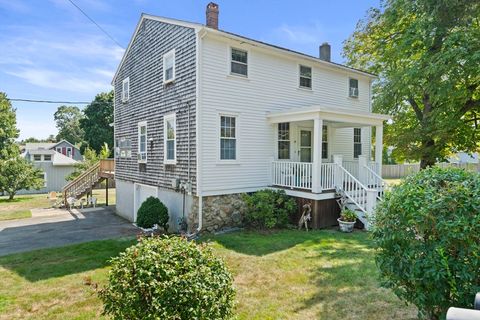
$1,050,000
6
bds
|
3
ba
|
2,610
sqft
|
built
1900
74 Elm St, Marshfield, MA 02050
$-2,861
Cash flow
-14.2%
Cash-on-Cash Return
2.4%
Cap rate
0.4%
Rent to Value Ratio
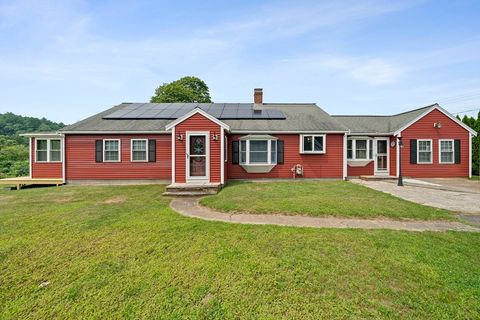
Active
$1,050,000
6
bds
|
5
ba
|
3,660
sqft
|
built
1987
91 Winslow St, Marshfield, MA 02050
$-3,025
Cash flow
-15.0%
Cash-on-Cash Return
2.2%
Cap rate
0.4%
Rent to Value Ratio
Active
$869,000
3
bds
|
3
ba
|
2,400
sqft
|
built
1972
112 Woodlawn Cir, Marshfield, MA 02050
$-1,954
Cash flow
-11.7%
Cash-on-Cash Return
3.0%
Cap rate
0.5%
Rent to Value Ratio
Active
$1,150,000
4
bds
|
4
ba
|
3,094
sqft
|
built
1828
144 Spring St, Marshfield, MA 02050
$-3,465
Cash flow
-15.7%
Cash-on-Cash Return
2.1%
Cap rate
0.3%
Rent to Value Ratio
Active
$699,000
3
bds
|
3
ba
|
2,535
sqft
|
built
1948
51 Hatch St, Marshfield, MA 02050
$-1,185
Cash flow
-8.8%
Cash-on-Cash Return
3.6%
Cap rate
0.6%
Rent to Value Ratio
Active
$1,350,000
4
bds
|
3
ba
|
3,549
sqft
|
built
1991
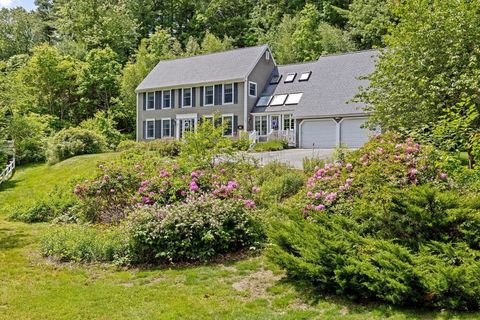
29 Oxen Dr, Marshfield, MA 02050
$-3,940
Cash flow
-15.2%
Cash-on-Cash Return
2.2%
Cap rate
0.4%
Rent to Value Ratio
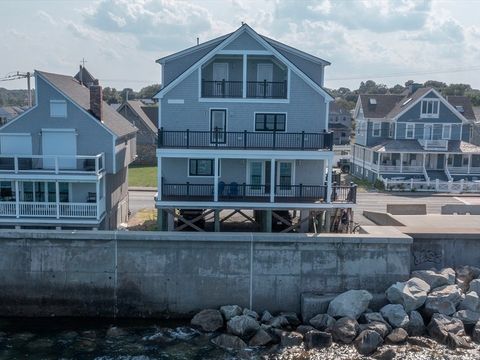
Active
$1,599,900
5
bds
|
3
ba
|
3,812
sqft
|
built
2023
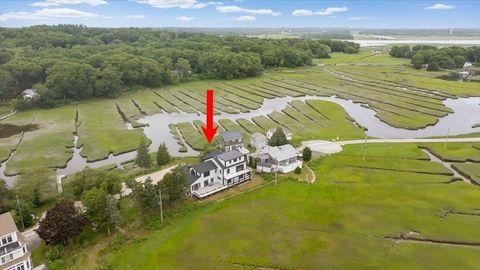
328 Ocean St, Marshfield, MA 02050
$-1,823
Cash flow
-5.9%
Cash-on-Cash Return
4.3%
Cap rate
0.6%
Rent to Value Ratio
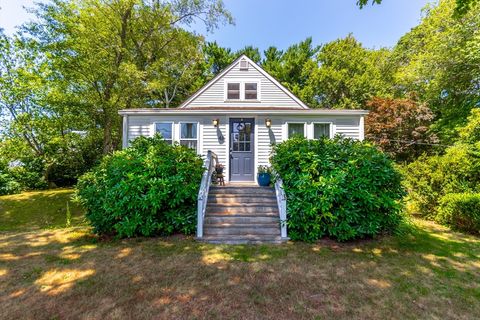
Active
$650,000
3
bds
|
1
ba
|
1,333
sqft
|
built
1955
48 Norwell Rd, Marshfield, MA 02050
$-1,297
Cash flow
-10.4%
Cash-on-Cash Return
3.3%
Cap rate
0.5%
Rent to Value Ratio
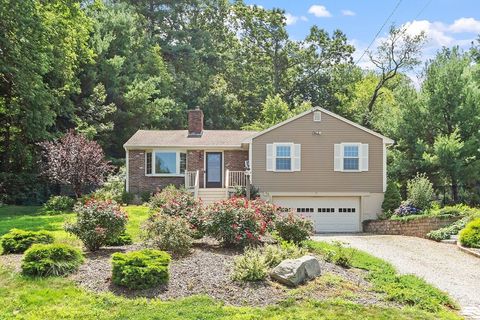
Active
$830,000
3
bds
|
2
ba
|
1,296
sqft
|
built
1960
64 Carolyn Cir, Marshfield, MA 02050
$-1,874
Cash flow
-11.8%
Cash-on-Cash Return
3.0%
Cap rate
0.5%
Rent to Value Ratio
Active
$1,379,000
4
bds
|
4
ba
|
3,903
sqft
|
built
2000
106 Quail Run, Marshfield, MA 02050
$-3,552
Cash flow
-13.4%
Cash-on-Cash Return
2.6%
Cap rate
0.4%
Rent to Value Ratio
Active
$1,199,000
3
bds
|
2
ba
|
1,645
sqft
|
built
1900
36 Ocean St, Marshfield, MA 02050
$-4,088
Cash flow
-17.8%
Cash-on-Cash Return
1.6%
Cap rate
0.3%
Rent to Value Ratio
Active
$1,500,000
4
bds
|
4
ba
|
4,871
sqft
|
built
1920
76 Macombers Way, Marshfield, MA 02050
$-4,166
Cash flow
-14.5%
Cash-on-Cash Return
2.3%
Cap rate
0.4%
Rent to Value Ratio
Active
$1,125,000
4
bds
|
3
ba
|
2,818
sqft
|
built
1985
39 High Beacon Way, Marshfield, MA 02050
$-2,866
Cash flow
-13.3%
Cash-on-Cash Return
2.6%
Cap rate
0.4%
Rent to Value Ratio
Active
$1,299,900
4
bds
|
4
ba
|
3,988
sqft
|
built
2010
480 Ferry St, Marshfield, MA 02050
$-3,546
Cash flow
-14.2%
Cash-on-Cash Return
2.4%
Cap rate
0.4%
Rent to Value Ratio
Active
$1,199,000
4
bds
|
3
ba
|
2,436
sqft
|
built
1928
25 11th Rd, Marshfield, MA 02050
$-3,740
Cash flow
-16.3%
Cash-on-Cash Return
1.9%
Cap rate
0.3%
Rent to Value Ratio
Active
$1,649,000
5
bds
|
5
ba
|
4,664
sqft
|
built
2025
176 Plymouth Ave, Marshfield, MA 02050
$-6,300
Cash flow
-19.9%
Cash-on-Cash Return
1.1%
Cap rate
0.1%
Rent to Value Ratio
Active
$1,029,900
3
bds
|
4
ba
|
3,142
sqft
|
built
1973
487 Main St, Marshfield, MA 02050
$-2,288
Cash flow
-11.6%
Cash-on-Cash Return
3.0%
Cap rate
0.5%
Rent to Value Ratio
Active
$1,789,000
6
bds
|
4
ba
|
3,026
sqft
|
built
1896
35 Mayflower Rd, Marshfield, MA 02050
$-5,982
Cash flow
-17.4%
Cash-on-Cash Return
1.7%
Cap rate
0.3%
Rent to Value Ratio

Active
$1,800,000
4
bds
|
4
ba
|
3,214
sqft
|
built
2019
308 Ocean St, Marshfield, MA 02050
$-5,872
Cash flow
-17.0%
Cash-on-Cash Return
1.8%
Cap rate
0.3%
Rent to Value Ratio