Melbourne, FL Investment Properties for Sale
Browse homes for sale and investment properties in Melbourne, FL. Refine your search by price, property type, or more.
Best cash flowing properties in Melbourne, FL
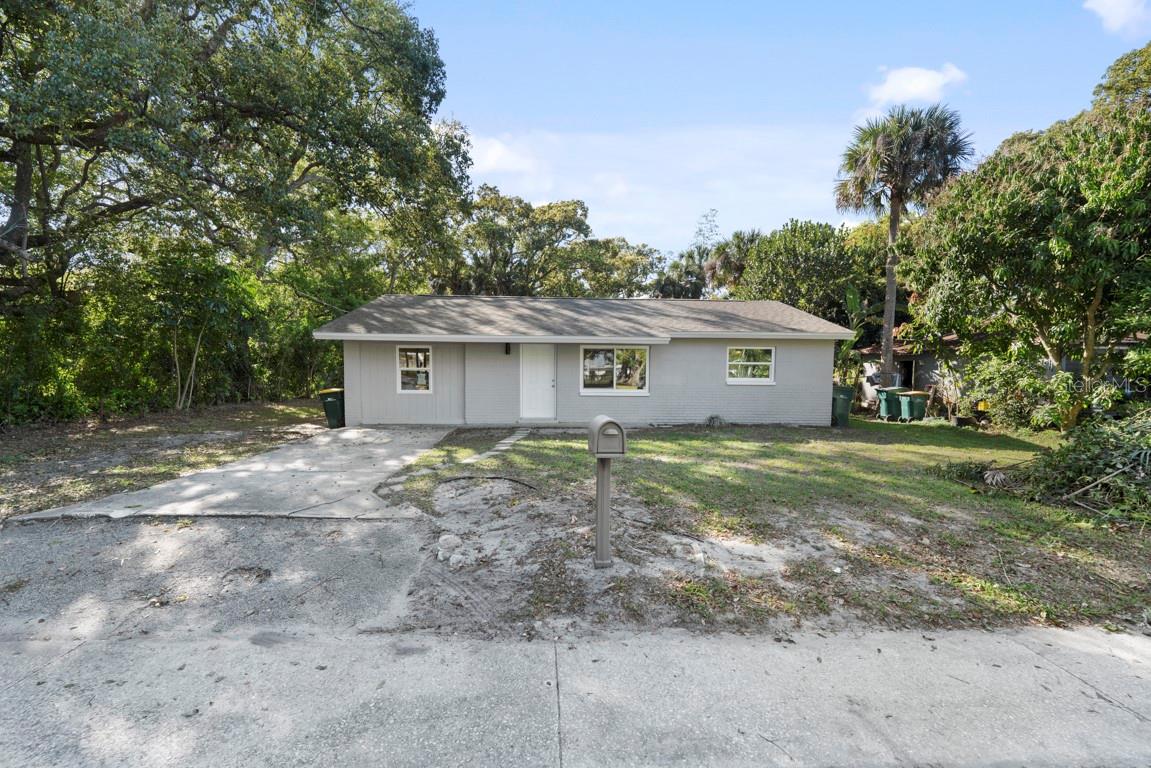
Active
$150,000
3
bds
|
2
ba
|
1,088
sqft
|
built
1963
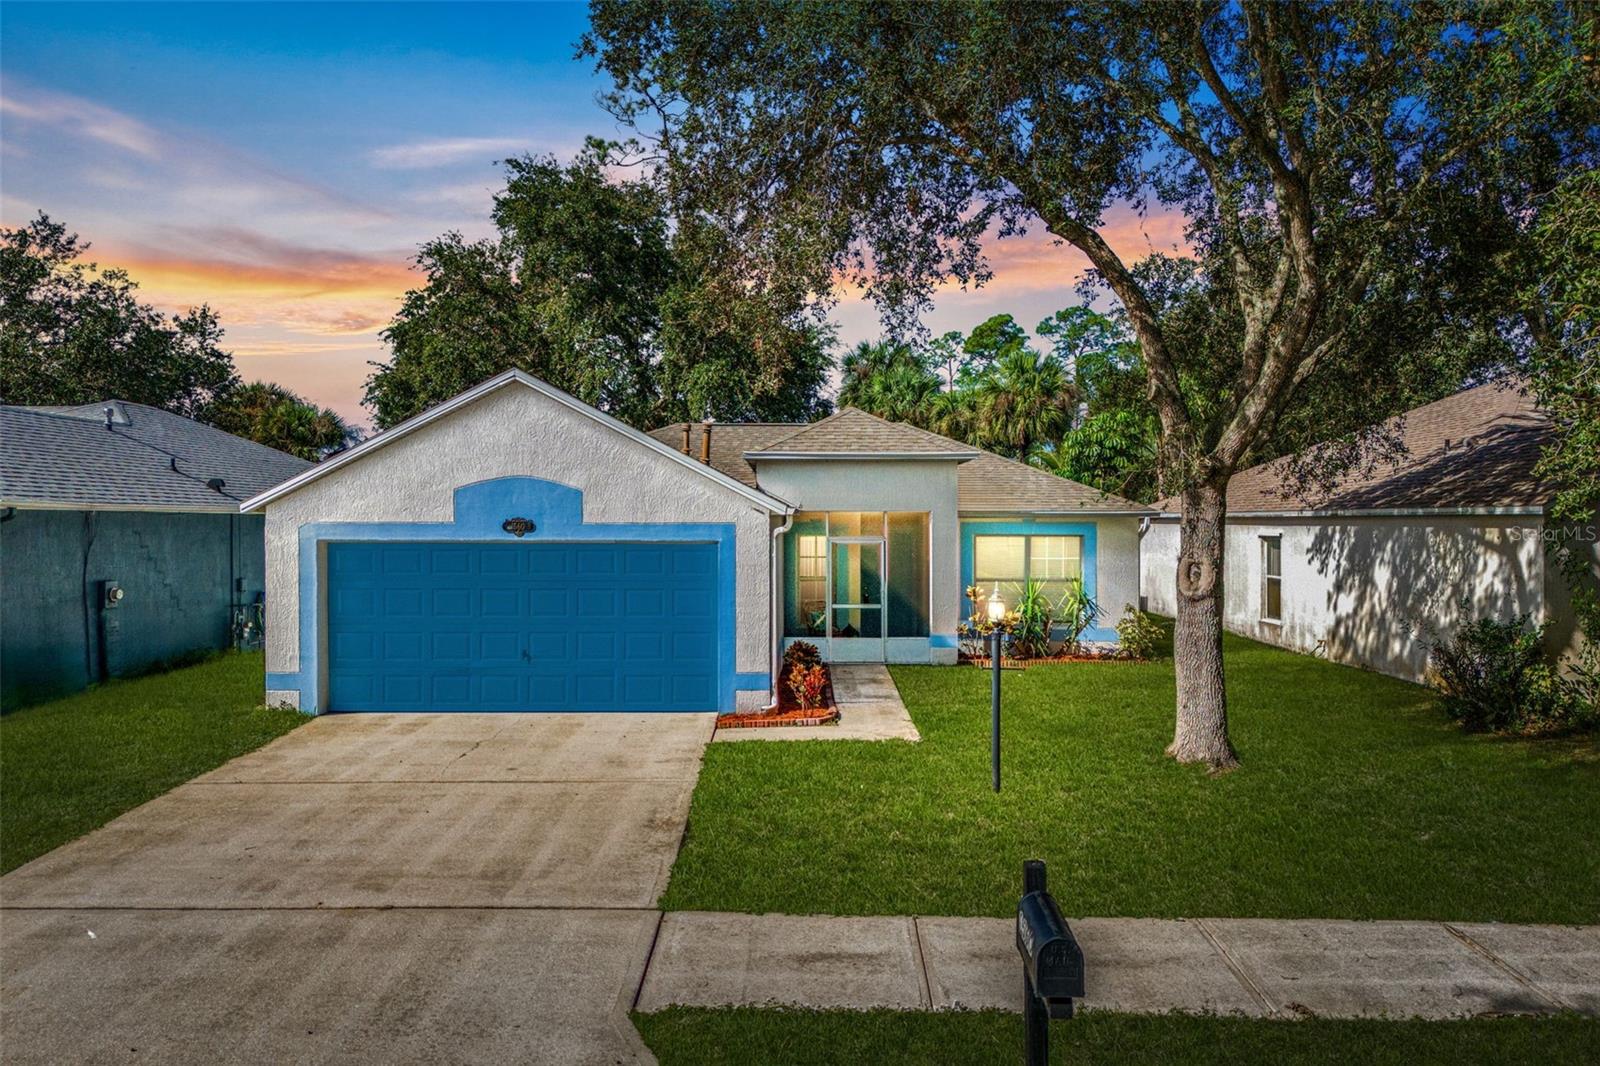
811 Calloway Ln, Melbourne, FL 32901
$230
Cash flow
8.0%
Cash-on-Cash Return
8.0%
Cap rate
1.1%
Rent to Value Ratio
Active
$164,500
1
bds
|
1
ba
|
752
sqft
|
built
1990
7667 N Wickham Rd, Melbourne, FL 32940
$97
Cash flow
3.1%
Cash-on-Cash Return
6.9%
Cap rate
1.0%
Rent to Value Ratio
43 out of 45 properties for sale in Melbourne, FL
Limited Results Shown
Create a free account, or log in to reveal all property listings and enjoy the complete experience.
Active
$900,000
3
bds
|
4
ba
|
2,776
sqft
|
built
2023
9309 Barbizon Ln, Melbourne, FL 32940
$-2,906
Cash flow
-16.8%
Cash-on-Cash Return
2.3%
Cap rate
0.4%
Rent to Value Ratio
Active
$435,000
3
bds
|
3
ba
|
2,279
sqft
|
built
2003
373 Intrepid Way, Melbourne, FL 32903
$-940
Cash flow
-11.3%
Cash-on-Cash Return
3.6%
Cap rate
0.7%
Rent to Value Ratio
Active
$569,900
5
bds
|
3
ba
|
2,827
sqft
|
built
2017
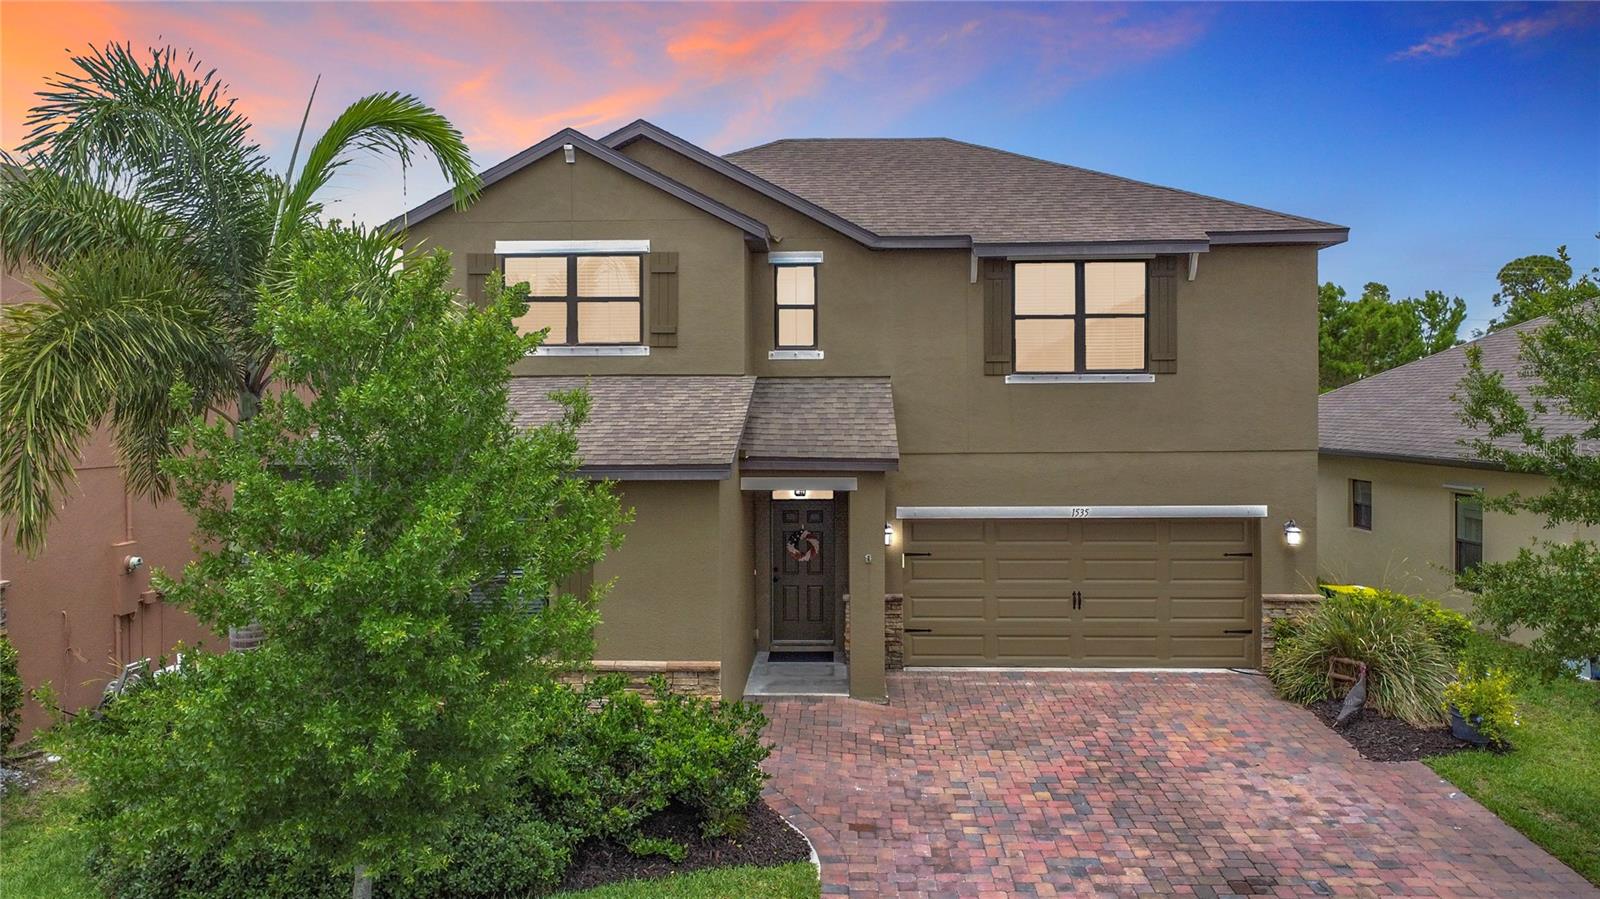
1535 Fuji Dr, Melbourne, FL 32940
$-1,094
Cash flow
-10.0%
Cash-on-Cash Return
3.8%
Cap rate
0.6%
Rent to Value Ratio
Active
$229,000
2
bds
|
2
ba
|
1,157
sqft
|
built
2005
6451 Borasco Dr, Melbourne, FL 32940
$-907
Cash flow
-20.7%
Cash-on-Cash Return
1.4%
Cap rate
0.8%
Rent to Value Ratio
Active
$500,000
3
bds
|
2
ba
|
1,938
sqft
|
built
2007
3024 Constellation Dr, Melbourne, FL 32940
$-694
Cash flow
-7.2%
Cash-on-Cash Return
4.5%
Cap rate
0.6%
Rent to Value Ratio

Active
$219,700
2
bds
|
2
ba
|
1,088
sqft
|
built
2005
6421 Borasco Dr, Melbourne, FL 32940
$-483
Cash flow
-11.5%
Cash-on-Cash Return
3.5%
Cap rate
1.0%
Rent to Value Ratio
Active
$165,000
3
bds
|
1
ba
|
840
sqft
|
built
1958
2391 Burns Ave, Melbourne, FL 32935
$65
Cash flow
2.1%
Cash-on-Cash Return
6.6%
Cap rate
1.0%
Rent to Value Ratio
Active
$765,000
3
bds
|
2
ba
|
2,461
sqft
|
built
1959
105 Devonshire Dr, Melbourne, FL 32901
$-2,118
Cash flow
-14.4%
Cash-on-Cash Return
2.8%
Cap rate
0.4%
Rent to Value Ratio
Active
$509,900
3
bds
|
2
ba
|
1,820
sqft
|
built
1997
600 Gina Ln, Melbourne, FL 32940
$-816
Cash flow
-8.3%
Cash-on-Cash Return
4.2%
Cap rate
0.6%
Rent to Value Ratio

Active
$349,900
2
bds
|
2
ba
|
1,419
sqft
|
built
1985
1804 W Shores Rd, Melbourne, FL 32935
$-599
Cash flow
-8.9%
Cash-on-Cash Return
4.1%
Cap rate
0.7%
Rent to Value Ratio
Active
$449,900
4
bds
|
2
ba
|
1,724
sqft
|
built
1977
2815 Golfview Dr, Melbourne, FL 32901
$-1,238
Cash flow
-14.4%
Cash-on-Cash Return
2.8%
Cap rate
0.5%
Rent to Value Ratio
Active
$219,900
2
bds
|
1
ba
|
728
sqft
|
built
1940
1213 Azalea Ct W, Melbourne, FL 32935
$-125
Cash flow
-3.0%
Cash-on-Cash Return
5.5%
Cap rate
0.7%
Rent to Value Ratio
Active
$505,000
4
bds
|
3
ba
|
2,439
sqft
|
built
1925
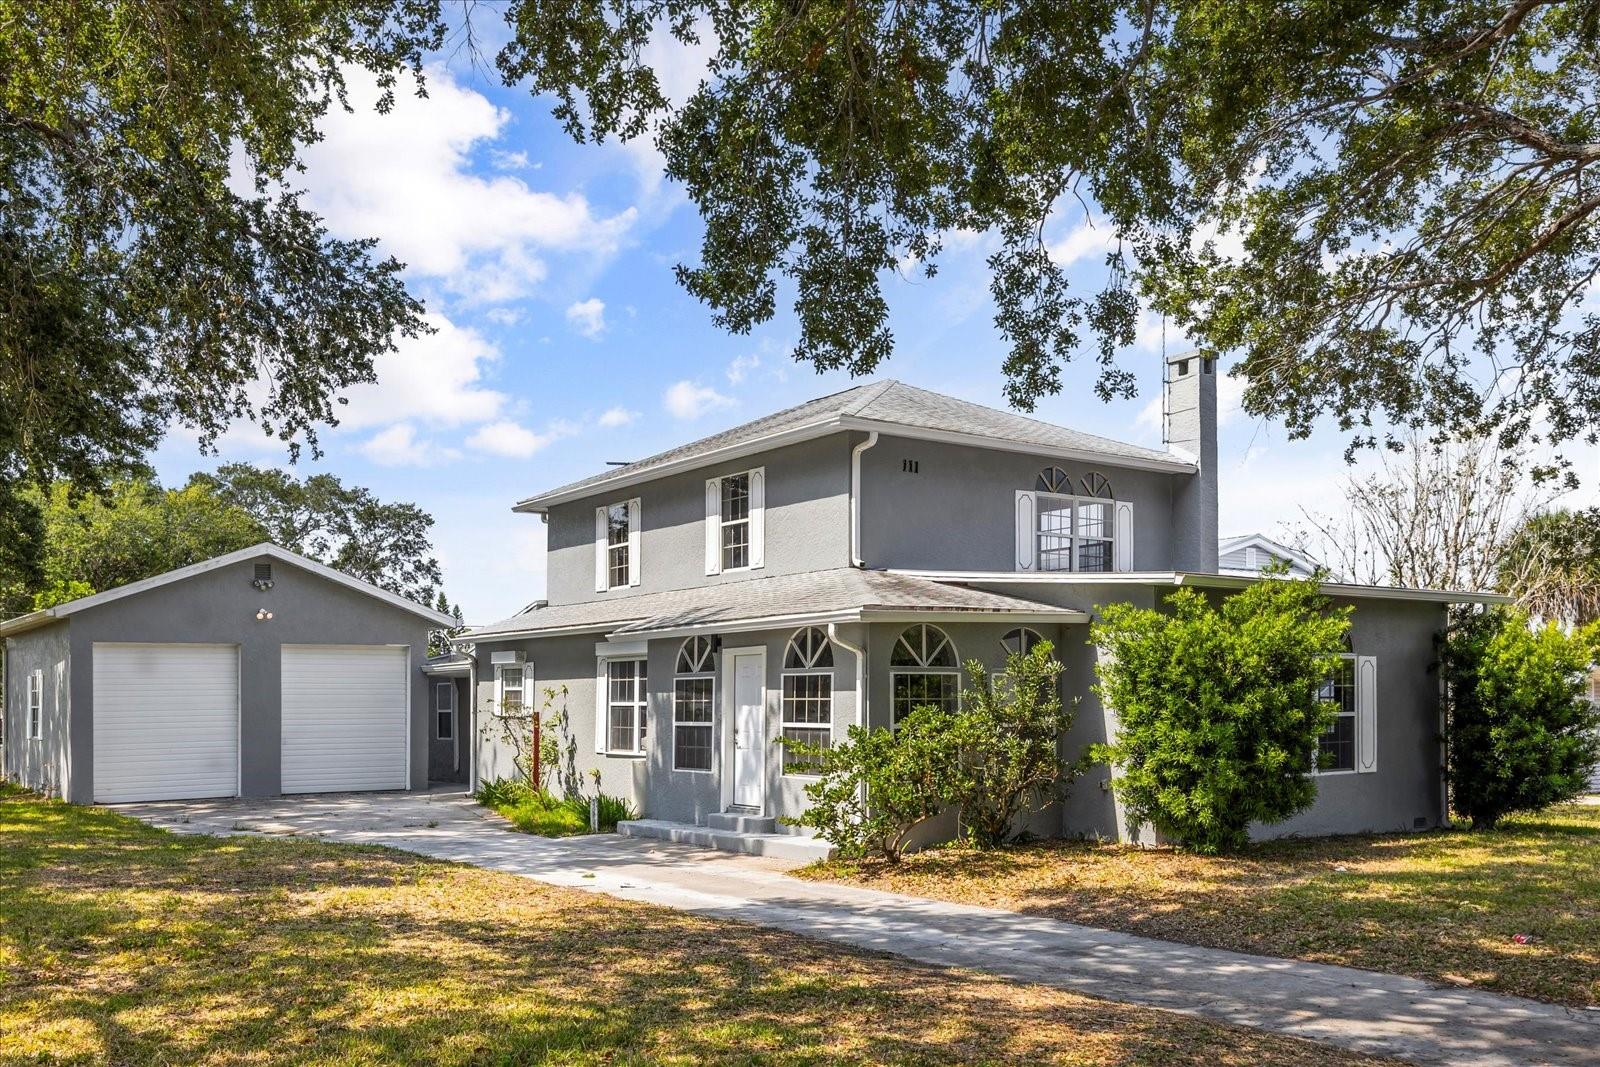
111 E Avenue C, Melbourne, FL 32901
$-1,156
Cash flow
-11.9%
Cash-on-Cash Return
3.4%
Cap rate
0.5%
Rent to Value Ratio

Active
$934,900
4
bds
|
3
ba
|
2,628
sqft
|
built
2023
2476 Kamin Dr, Melbourne, FL 32940
$-2,899
Cash flow
-16.2%
Cash-on-Cash Return
2.4%
Cap rate
0.4%
Rent to Value Ratio

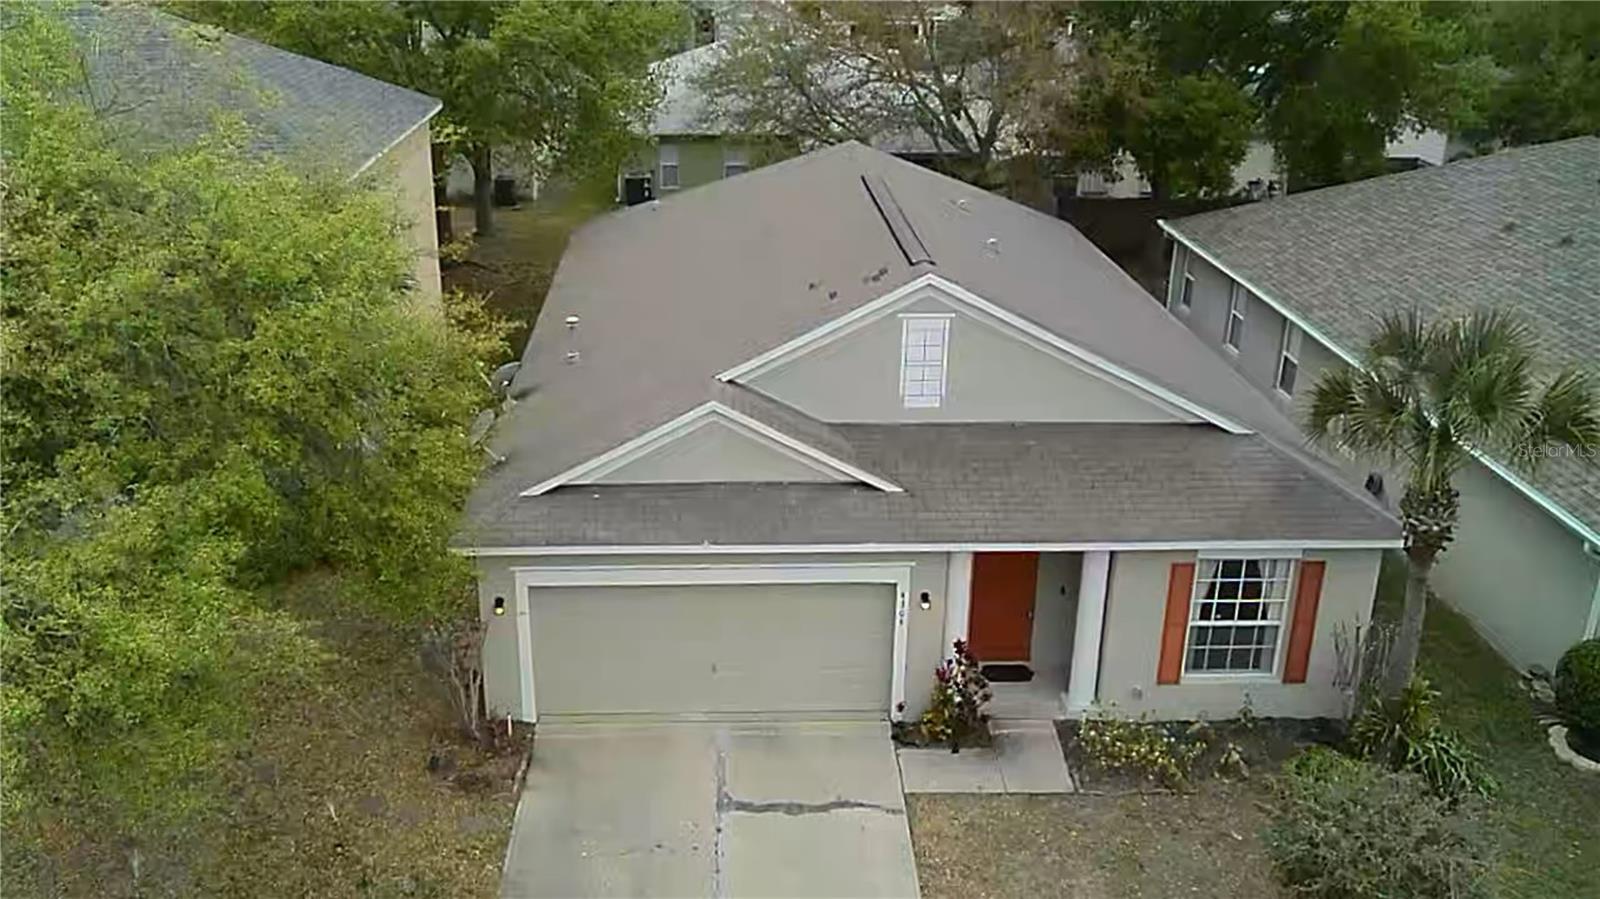
Active
$220,000
1
bds
|
2
ba
|
850
sqft
|
built
1980
2175 Golf Isle Dr, Melbourne, FL 32935
$-883
Cash flow
-20.9%
Cash-on-Cash Return
1.3%
Cap rate
0.5%
Rent to Value Ratio
Active
$229,900
3
bds
|
2
ba
|
1,740
sqft
|
built
1979
113 Hibiscus St, Melbourne, FL 32935
$-31
Cash flow
-0.7%
Cash-on-Cash Return
6.0%
Cap rate
0.9%
Rent to Value Ratio
Active
$319,500
3
bds
|
2
ba
|
1,665
sqft
|
built
1961
1674 Tynan Ave, Melbourne, FL 32935
$-428
Cash flow
-7.0%
Cash-on-Cash Return
4.5%
Cap rate
0.6%
Rent to Value Ratio
Active
$344,900
3
bds
|
2
ba
|
1,441
sqft
|
built
1995
2911 Saint James Ln, Melbourne, FL 32935
$-647
Cash flow
-9.8%
Cash-on-Cash Return
3.9%
Cap rate
0.6%
Rent to Value Ratio
Active
$335,000
3
bds
|
2
ba
|
1,264
sqft
|
built
1999
1560 Vista Lake Cir, Melbourne, FL 32904
$-430
Cash flow
-6.7%
Cash-on-Cash Return
4.6%
Cap rate
0.7%
Rent to Value Ratio
Active
$550,000
4
bds
|
2
ba
|
2,105
sqft
|
built
2004
2420 Windchaser Ct, Melbourne, FL 32904
$-1,292
Cash flow
-12.3%
Cash-on-Cash Return
3.3%
Cap rate
0.5%
Rent to Value Ratio

Active
$599,000
4
bds
|
3
ba
|
2,475
sqft
|
built
1989
721 Spring Lake Dr, Melbourne, FL 32940
$-1,384
Cash flow
-12.1%
Cash-on-Cash Return
3.4%
Cap rate
0.5%
Rent to Value Ratio
Active
$574,000
3
bds
|
3
ba
|
2,103
sqft
|
built
2018
2290 Enjoya Ln, Melbourne, FL 32901
$-1,687
Cash flow
-15.3%
Cash-on-Cash Return
2.6%
Cap rate
0.6%
Rent to Value Ratio
Active
$194,000
2
bds
|
2
ba
|
1,320
sqft
|
built
1981
9002 Brighton Ct, Melbourne, FL 32904
$-710
Cash flow
-19.1%
Cash-on-Cash Return
1.8%
Cap rate
0.8%
Rent to Value Ratio

Active
$409,900
3
bds
|
3
ba
|
1,945
sqft
|
built
2021
200 Circle Ave, Melbourne, FL 32935
$-469
Cash flow
-6.0%
Cash-on-Cash Return
4.8%
Cap rate
0.8%
Rent to Value Ratio
Active
$299,900
4
bds
|
2
ba
|
1,593
sqft
|
built
1973
1087 Swan St, Melbourne, FL 32935
$-495
Cash flow
-8.6%
Cash-on-Cash Return
4.2%
Cap rate
0.6%
Rent to Value Ratio

Active
$693,000
4
bds
|
3
ba
|
2,428
sqft
|
built
2017
7115 Pena Ln, Melbourne, FL 32940
$-1,320
Cash flow
-9.9%
Cash-on-Cash Return
3.9%
Cap rate
0.6%
Rent to Value Ratio
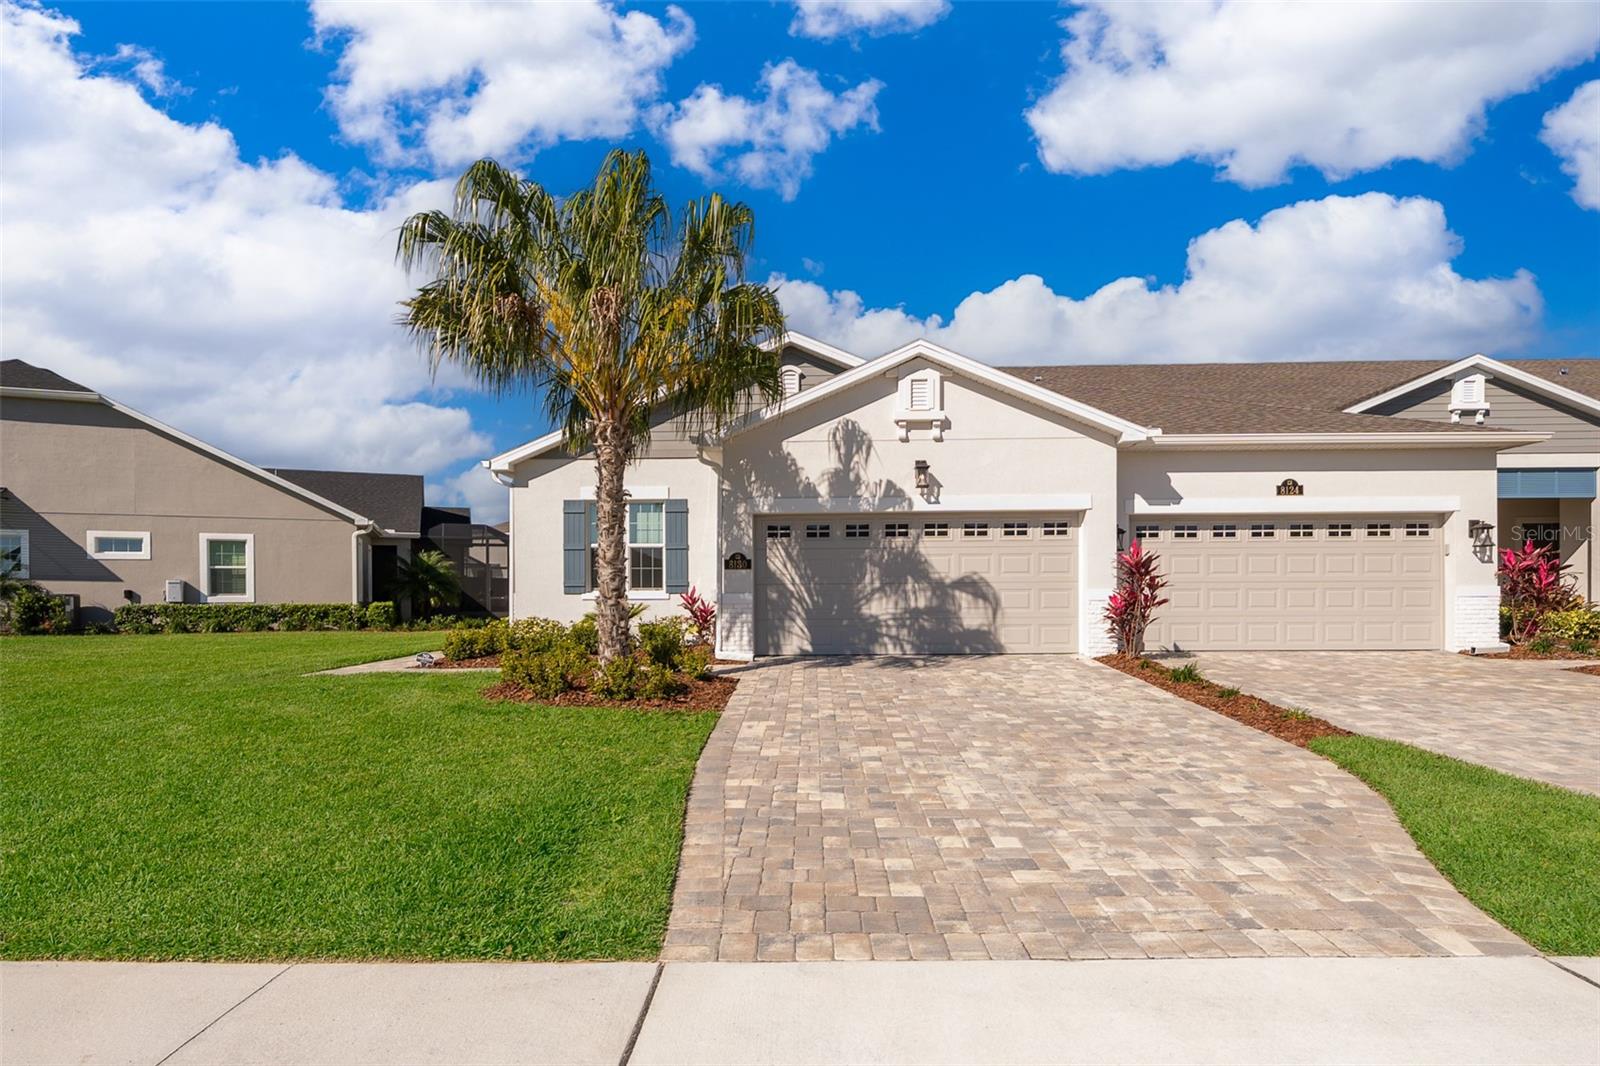
Active
$499,990
3
bds
|
2
ba
|
1,731
sqft
|
built
2023
8130 Cache Creek Ln, Melbourne, FL 32940
$-1,285
Cash flow
-13.4%
Cash-on-Cash Return
3.1%
Cap rate
0.6%
Rent to Value Ratio
Active
$449,000
3
bds
|
2
ba
|
1,572
sqft
|
built
1994
4983 Erin Ln, Melbourne, FL 32940
$-757
Cash flow
-8.8%
Cash-on-Cash Return
4.1%
Cap rate
0.6%
Rent to Value Ratio
Active
$269,999
3
bds
|
2
ba
|
1,706
sqft
|
built
2005
4304 Canby Dr, Melbourne, FL 32901
$-296
Cash flow
-5.7%
Cash-on-Cash Return
4.8%
Cap rate
0.8%
Rent to Value Ratio
Active
$194,900
2
bds
|
2
ba
|
1,072
sqft
|
built
1984
7808 Shadowood Dr, Melbourne, FL 32904
$-535
Cash flow
-14.3%
Cash-on-Cash Return
2.9%
Cap rate
0.8%
Rent to Value Ratio
Active
$434,900
4
bds
|
3
ba
|
2,023
sqft
|
built
2009
3691 Titanic Cir, Melbourne, FL 32903
$-1,027
Cash flow
-12.3%
Cash-on-Cash Return
3.3%
Cap rate
0.7%
Rent to Value Ratio
Active
$150,000
3
bds
|
2
ba
|
1,088
sqft
|
built
1963
811 Calloway Ln, Melbourne, FL 32901
$230
Cash flow
8.0%
Cash-on-Cash Return
8.0%
Cap rate
1.1%
Rent to Value Ratio

Active
$299,000
2
bds
|
3
ba
|
1,632
sqft
|
built
1984
1251 Beachside Ln, Melbourne, FL 32903
$-749
Cash flow
-13.1%
Cash-on-Cash Return
3.1%
Cap rate
0.8%
Rent to Value Ratio
Active
$164,500
1
bds
|
1
ba
|
752
sqft
|
built
1990
7667 N Wickham Rd, Melbourne, FL 32940
$97
Cash flow
3.1%
Cash-on-Cash Return
6.9%
Cap rate
1.0%
Rent to Value Ratio
Active
$263,100
3
bds
|
2
ba
|
1,152
sqft
|
built
1954
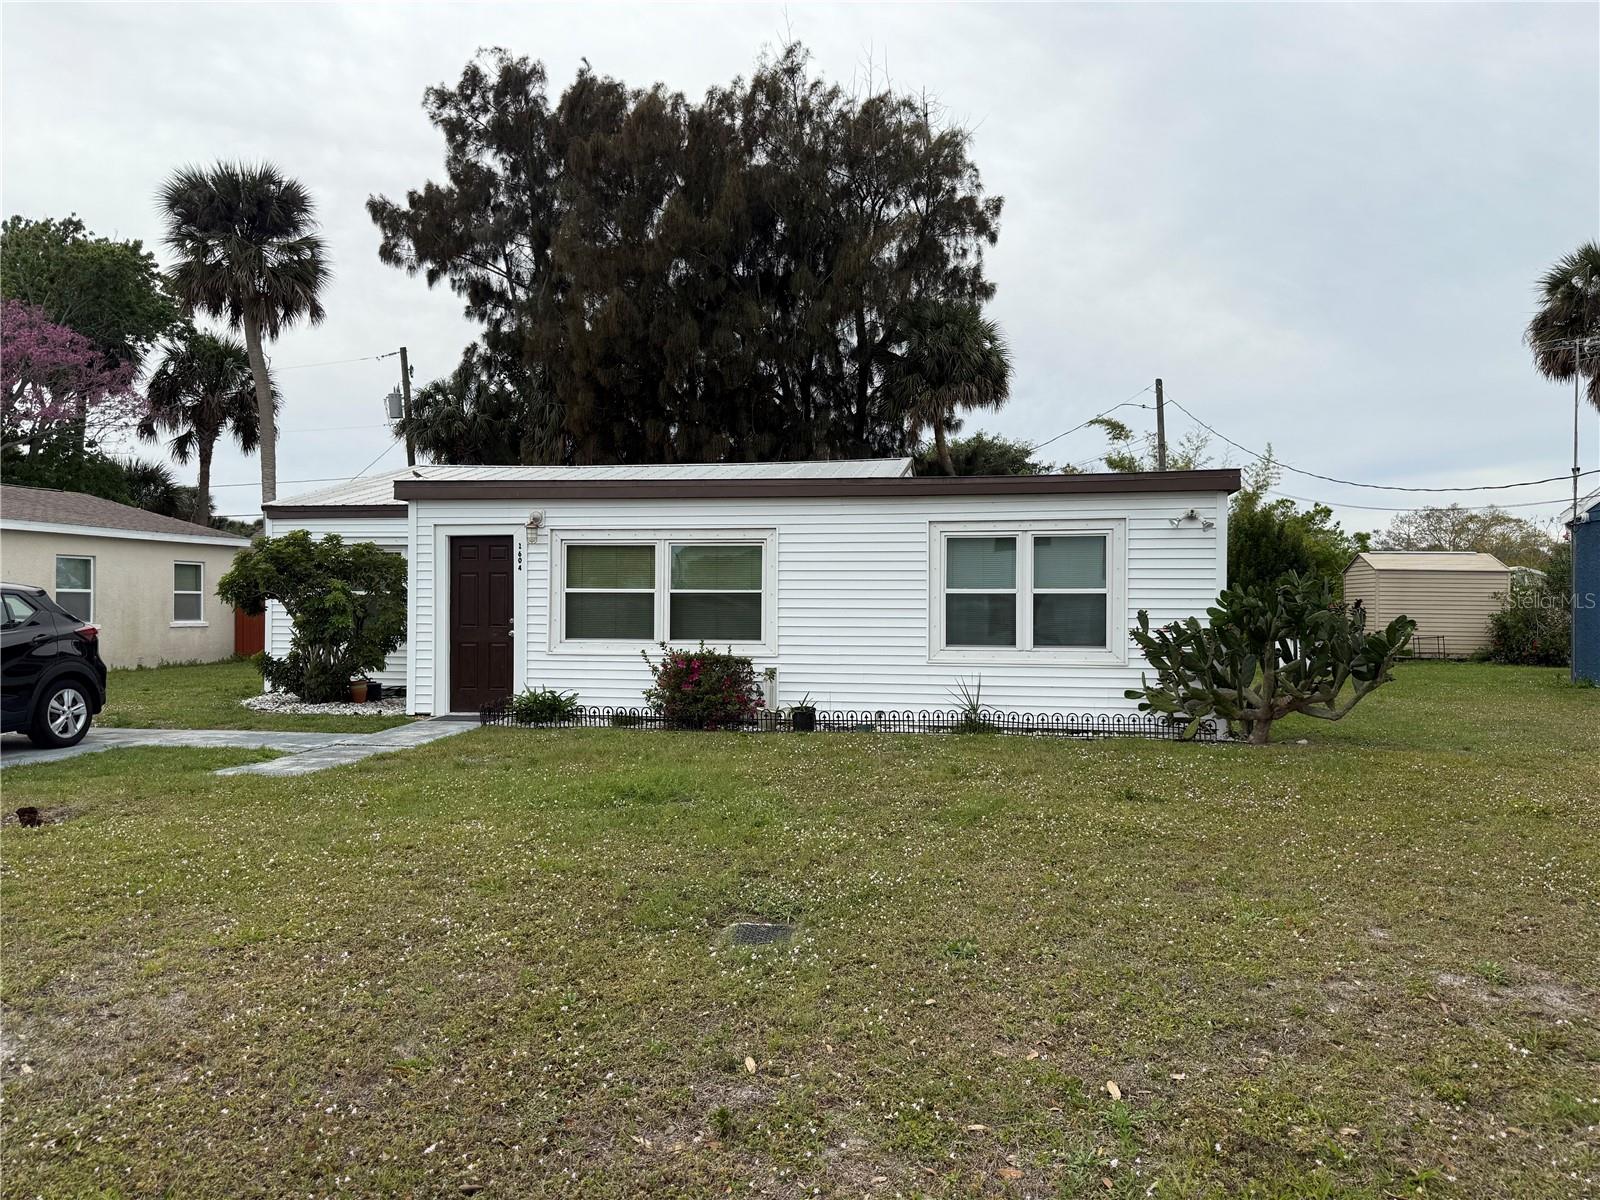
1604 Park Ave, Melbourne, FL 32901
$-63
Cash flow
-1.2%
Cash-on-Cash Return
5.9%
Cap rate
0.8%
Rent to Value Ratio
Active
$390,000
3
bds
|
2
ba
|
1,458
sqft
|
built
2022
8135 Tethys Ct, Melbourne, FL 32940
$-633
Cash flow
-8.5%
Cash-on-Cash Return
4.2%
Cap rate
0.8%
Rent to Value Ratio
Active
$190,000
2
bds
|
2
ba
|
1,157
sqft
|
built
2005
6460 Borasco Dr, Melbourne, FL 32940
$-584
Cash flow
-16.0%
Cash-on-Cash Return
2.5%
Cap rate
1.0%
Rent to Value Ratio
Active
$377,000
4
bds
|
3
ba
|
1,340
sqft
|
built
1935
342 Gray Rd, Melbourne, FL 32904
$-1,031
Cash flow
-14.3%
Cash-on-Cash Return
2.9%
Cap rate
0.4%
Rent to Value Ratio
Active
$229,900
3
bds
|
1
ba
|
910
sqft
|
built
1957
2830 Colbert Cir, Melbourne, FL 32901
$-113
Cash flow
-2.6%
Cash-on-Cash Return
5.6%
Cap rate
0.7%
Rent to Value Ratio
Active
$175,000
1
bds
|
1
ba
|
598
sqft
|
built
2005
6440 Borasco Dr, Melbourne, FL 32940
$-267
Cash flow
-8.0%
Cash-on-Cash Return
4.3%
Cap rate
0.9%
Rent to Value Ratio