Kent County Investment Properties for Sale
Browse homes for sale and investment properties in Kent County. Refine your search by price, property type, or more.
Best cash flowing properties in Kent County
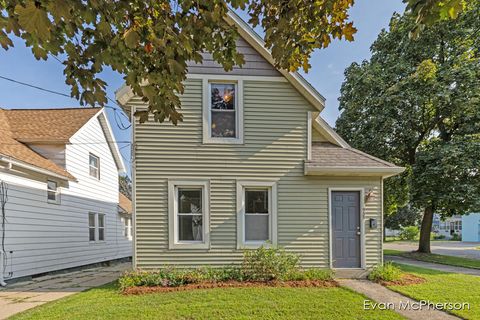
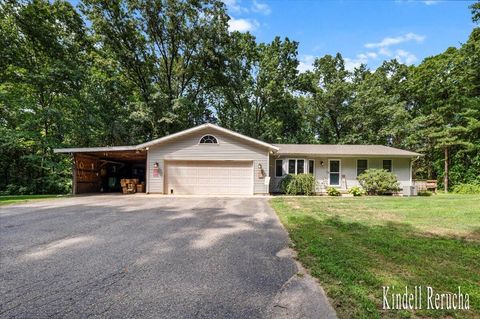
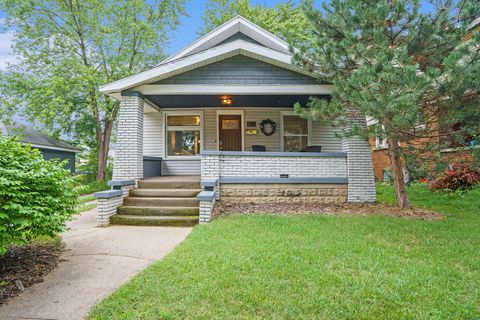
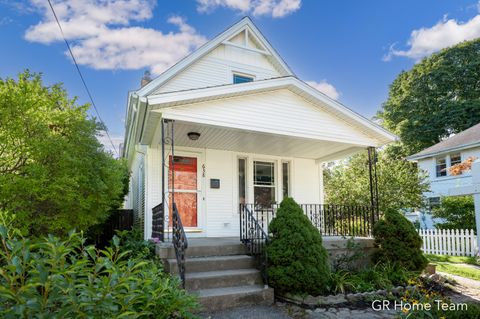
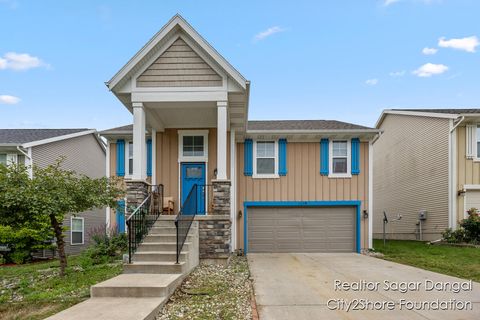
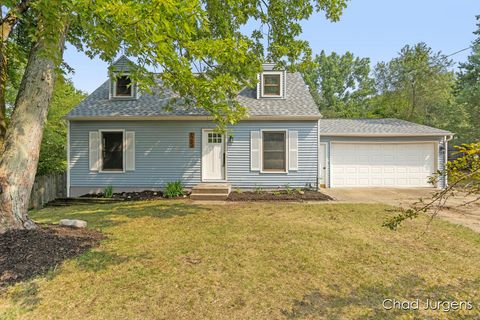
Active
$239,900
3
bds
|
1
ba
|
1,155
sqft
|
built
1890
935 Watson St SW, Grand Rapids, MI 49504
$10
Cash flow
0.2%
Cash-on-Cash Return
6.2%
Cap rate
0.8%
Rent to Value Ratio

Active
$179,900
2
bds
|
1
ba
|
620
sqft
|
built
1940
3701 Clyde Park Ave SW, Wyoming, MI 49509
$-24
Cash flow
-0.7%
Cash-on-Cash Return
6.0%
Cap rate
0.8%
Rent to Value Ratio
528 out of 596 properties for sale in Kent County
Limited Results Shown
Create a free account, or log in to reveal all property listings and enjoy the complete experience.

Active
$329,900
4
bds
|
3
ba
|
2,173
sqft
|
built
1989
6767 Wildwood Ct, Cedar Springs, MI 49319
$-243
Cash flow
-3.8%
Cash-on-Cash Return
5.3%
Cap rate
0.8%
Rent to Value Ratio

Active
$237,000
3
bds
|
3
ba
|
1,749
sqft
|
built
1900
94 W Division St, Sparta, MI 49345
$-62
Cash flow
-1.4%
Cash-on-Cash Return
5.8%
Cap rate
0.8%
Rent to Value Ratio
Active
$199,900
2
bds
|
1
ba
|
953
sqft
|
built
1965
8315 Ramsdell Dr NE, Rockford, MI 49341
$-64
Cash flow
-1.7%
Cash-on-Cash Return
5.8%
Cap rate
0.9%
Rent to Value Ratio
Active
$379,000
3
bds
|
2
ba
|
1,416
sqft
|
built
1987
1131 Fernridge Ave SE, Grand Rapids, MI 49546
$-255
Cash flow
-3.5%
Cash-on-Cash Return
5.3%
Cap rate
0.7%
Rent to Value Ratio

Active
$275,000
3
bds
|
1
ba
|
1,145
sqft
|
built
1952
1659 Mason St NE, Grand Rapids, MI 49503
$-308
Cash flow
-5.8%
Cash-on-Cash Return
4.8%
Cap rate
0.7%
Rent to Value Ratio
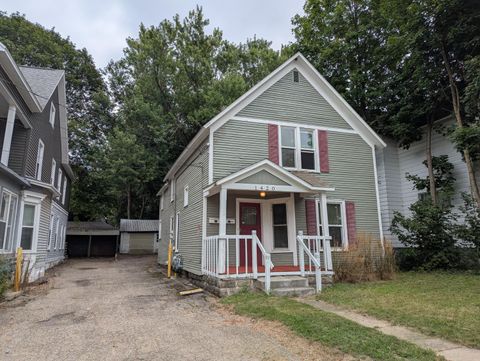
Active
$299,000
bds
|
0
ba
|
0
sqft
|
built
1890
1420 Buffalo Ave NE, Grand Rapids, MI 49505
$-555
Cash flow
-9.7%
Cash-on-Cash Return
3.9%
Cap rate
0.5%
Rent to Value Ratio
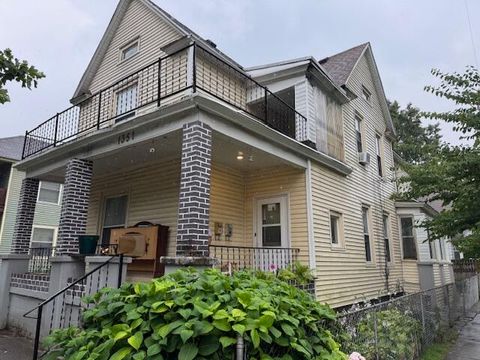
Active
$274,900
bds
|
0
ba
|
0
sqft
|
built
1895
1351 Hamilton Ave NW, Grand Rapids, MI 49504
$-214
Cash flow
-4.1%
Cash-on-Cash Return
5.2%
Cap rate
0.7%
Rent to Value Ratio
Active
$240,000
2
bds
|
2
ba
|
1,036
sqft
|
built
1967
2470 Abbington Dr SE, Grand Rapids, MI 49506
$-558
Cash flow
-12.1%
Cash-on-Cash Return
3.4%
Cap rate
0.8%
Rent to Value Ratio

Active
$449,000
4
bds
|
3
ba
|
2,912
sqft
|
built
1995
5621 Pine Island Dr NE, Comstock Park, MI 49321
$-1,209
Cash flow
-14.0%
Cash-on-Cash Return
2.9%
Cap rate
0.4%
Rent to Value Ratio
Active
$2,377,700
5
bds
|
5
ba
|
7,628
sqft
|
built
1993
8050 Wilderness Trl NE, Ada, MI 49301
$-10,484
Cash flow
-23.0%
Cash-on-Cash Return
0.9%
Cap rate
0.2%
Rent to Value Ratio
Active
$314,900
3
bds
|
1
ba
|
1,084
sqft
|
built
1959
45 Daniel St SE, Kentwood, MI 49548
$-590
Cash flow
-9.8%
Cash-on-Cash Return
3.9%
Cap rate
0.6%
Rent to Value Ratio
Active
$385,000
3
bds
|
2
ba
|
1,679
sqft
|
built
1995
699 Lincoln Lake Ave NE, Lowell, MI 49331
$-664
Cash flow
-9.0%
Cash-on-Cash Return
4.1%
Cap rate
0.6%
Rent to Value Ratio
Active
$360,000
3
bds
|
2
ba
|
1,485
sqft
|
built
1934
1319 Allerton Ave SE, Grand Rapids, MI 49506
$-431
Cash flow
-6.2%
Cash-on-Cash Return
4.7%
Cap rate
0.6%
Rent to Value Ratio
Active
$515,000
4
bds
|
4
ba
|
2,196
sqft
|
built
1994
3750 Benjamin Ave NE, Grand Rapids, MI 49525
$-1,806
Cash flow
-18.3%
Cash-on-Cash Return
1.9%
Cap rate
0.3%
Rent to Value Ratio
Active
$295,000
3
bds
|
3
ba
|
2,214
sqft
|
built
1930
104 Colrain St SE, Grand Rapids, MI 49548
$-127
Cash flow
-2.2%
Cash-on-Cash Return
5.6%
Cap rate
0.8%
Rent to Value Ratio
Active
$270,000
2
bds
|
2
ba
|
1,424
sqft
|
built
1923
941 Arianna St NW, Grand Rapids, MI 49504
$-222
Cash flow
-4.3%
Cash-on-Cash Return
5.2%
Cap rate
0.7%
Rent to Value Ratio

Active
$214,900
2
bds
|
2
ba
|
961
sqft
|
built
1981
3536 Whispering Brook Dr SE, Kentwood, MI 49508
$-406
Cash flow
-9.9%
Cash-on-Cash Return
3.9%
Cap rate
0.8%
Rent to Value Ratio
Active
$384,900
2
bds
|
3
ba
|
2,112
sqft
|
built
2020
8788 Veld Stream Dr, Rockford, MI 49341
$-1,074
Cash flow
-14.6%
Cash-on-Cash Return
2.8%
Cap rate
0.6%
Rent to Value Ratio

Active
$324,000
3
bds
|
2
ba
|
1,919
sqft
|
built
1941
1613 Margaret Ave SE, Grand Rapids, MI 49507
$-389
Cash flow
-6.3%
Cash-on-Cash Return
4.7%
Cap rate
0.7%
Rent to Value Ratio

Active
$350,000
4
bds
|
2
ba
|
1,937
sqft
|
built
1990
6513 Kuttshill Dr NE, Rockford, MI 49341
$-378
Cash flow
-5.6%
Cash-on-Cash Return
4.9%
Cap rate
0.7%
Rent to Value Ratio
Active
$279,900
2
bds
|
2
ba
|
1,072
sqft
|
built
1989
2156 Ter Van Dr NE, Grand Rapids, MI 49505
$-1,097
Cash flow
-20.4%
Cash-on-Cash Return
1.4%
Cap rate
0.6%
Rent to Value Ratio
Active
$455,000
4
bds
|
2
ba
|
2,500
sqft
|
built
1975
6040 Adacroft Dr SE, Ada, MI 49301
$-949
Cash flow
-10.9%
Cash-on-Cash Return
3.6%
Cap rate
0.6%
Rent to Value Ratio
Active
$369,900
3
bds
|
2
ba
|
1,008
sqft
|
built
1920
638 Gladstone Dr SE, East Grand Rapids, MI 49506
$-547
Cash flow
-7.7%
Cash-on-Cash Return
4.4%
Cap rate
0.7%
Rent to Value Ratio

Active
$749,600
6
bds
|
4
ba
|
4,673
sqft
|
built
1990
2331 Westwinde Ct NW, Grand Rapids, MI 49504
$-1,889
Cash flow
-13.1%
Cash-on-Cash Return
3.1%
Cap rate
0.5%
Rent to Value Ratio
Active
$390,000
5
bds
|
3
ba
|
2,000
sqft
|
built
2013
3075 Creek Way Ct SE, Kentwood, MI 49512
$-177
Cash flow
-2.4%
Cash-on-Cash Return
5.6%
Cap rate
0.7%
Rent to Value Ratio

Active
$349,900
4
bds
|
2
ba
|
2,252
sqft
|
built
1922
107 S Main St, Rockford, MI 49341
$-427
Cash flow
-6.4%
Cash-on-Cash Return
4.7%
Cap rate
0.7%
Rent to Value Ratio

Active
$354,900
4
bds
|
2
ba
|
1,635
sqft
|
built
1980
4561 Blackfoot Dr SW, Grandville, MI 49418
$-540
Cash flow
-7.9%
Cash-on-Cash Return
4.3%
Cap rate
0.6%
Rent to Value Ratio
Active
$319,000
3
bds
|
2
ba
|
1,619
sqft
|
built
1951
952 Frederick Ave NW, Grand Rapids, MI 49504
$-468
Cash flow
-7.7%
Cash-on-Cash Return
4.4%
Cap rate
0.6%
Rent to Value Ratio

Active
$420,000
4
bds
|
3
ba
|
2,510
sqft
|
built
1964
583 Kingsbury St NW, Grand Rapids, MI 49544
$-858
Cash flow
-10.7%
Cash-on-Cash Return
3.7%
Cap rate
0.5%
Rent to Value Ratio

Active
$800,000
4
bds
|
3
ba
|
2,712
sqft
|
built
1956
1825 Meadowfield Dr NE, Grand Rapids, MI 49505
$-2,451
Cash flow
-16.0%
Cash-on-Cash Return
2.5%
Cap rate
0.4%
Rent to Value Ratio
Active
$650,000
4
bds
|
3
ba
|
2,551
sqft
|
built
1900
708 Cherry St SE, Grand Rapids, MI 49503
$-1,667
Cash flow
-13.4%
Cash-on-Cash Return
3.1%
Cap rate
0.5%
Rent to Value Ratio
Active
$349,000
3
bds
|
2
ba
|
1,537
sqft
|
built
2016
5070 Wild Senna Ave SE, Kentwood, MI 49512
$-510
Cash flow
-7.6%
Cash-on-Cash Return
4.4%
Cap rate
0.7%
Rent to Value Ratio
Active
$400,000
4
bds
|
3
ba
|
1,428
sqft
|
built
1980
5080 Brookestone Dr NE, Rockford, MI 49341
$-381
Cash flow
-5.0%
Cash-on-Cash Return
5.0%
Cap rate
0.7%
Rent to Value Ratio
Active
$225,000
3
bds
|
1
ba
|
986
sqft
|
built
1922
1010 Oakdale St SE, Grand Rapids, MI 49507
$-54
Cash flow
-1.3%
Cash-on-Cash Return
5.9%
Cap rate
0.8%
Rent to Value Ratio
Active
$259,900
3
bds
|
2
ba
|
1,378
sqft
|
built
1905
614 Sheldon Ave SE, Grand Rapids, MI 49503
$-252
Cash flow
-5.1%
Cash-on-Cash Return
5.0%
Cap rate
0.7%
Rent to Value Ratio
Active
$344,900
4
bds
|
2
ba
|
2,040
sqft
|
built
1971
1702 Woodgate Dr SE, Lowell, MI 49331
$-416
Cash flow
-6.3%
Cash-on-Cash Return
4.7%
Cap rate
0.7%
Rent to Value Ratio
Active
$1,150,000
4
bds
|
5
ba
|
3,716
sqft
|
built
1979
8300 Grand River Dr SE, Ada, MI 49301
$-4,700
Cash flow
-21.3%
Cash-on-Cash Return
1.2%
Cap rate
0.2%
Rent to Value Ratio

Active
$349,900
3
bds
|
2
ba
|
1,022
sqft
|
built
1900
656 Gladstone Dr SE, Grand Rapids, MI 49506
$-677
Cash flow
-10.1%
Cash-on-Cash Return
3.8%
Cap rate
0.6%
Rent to Value Ratio