Kent County Investment Properties for Sale
Browse homes for sale and investment properties in Kent County. Refine your search by price, property type, or more.
Best cash flowing properties in Kent County
Active
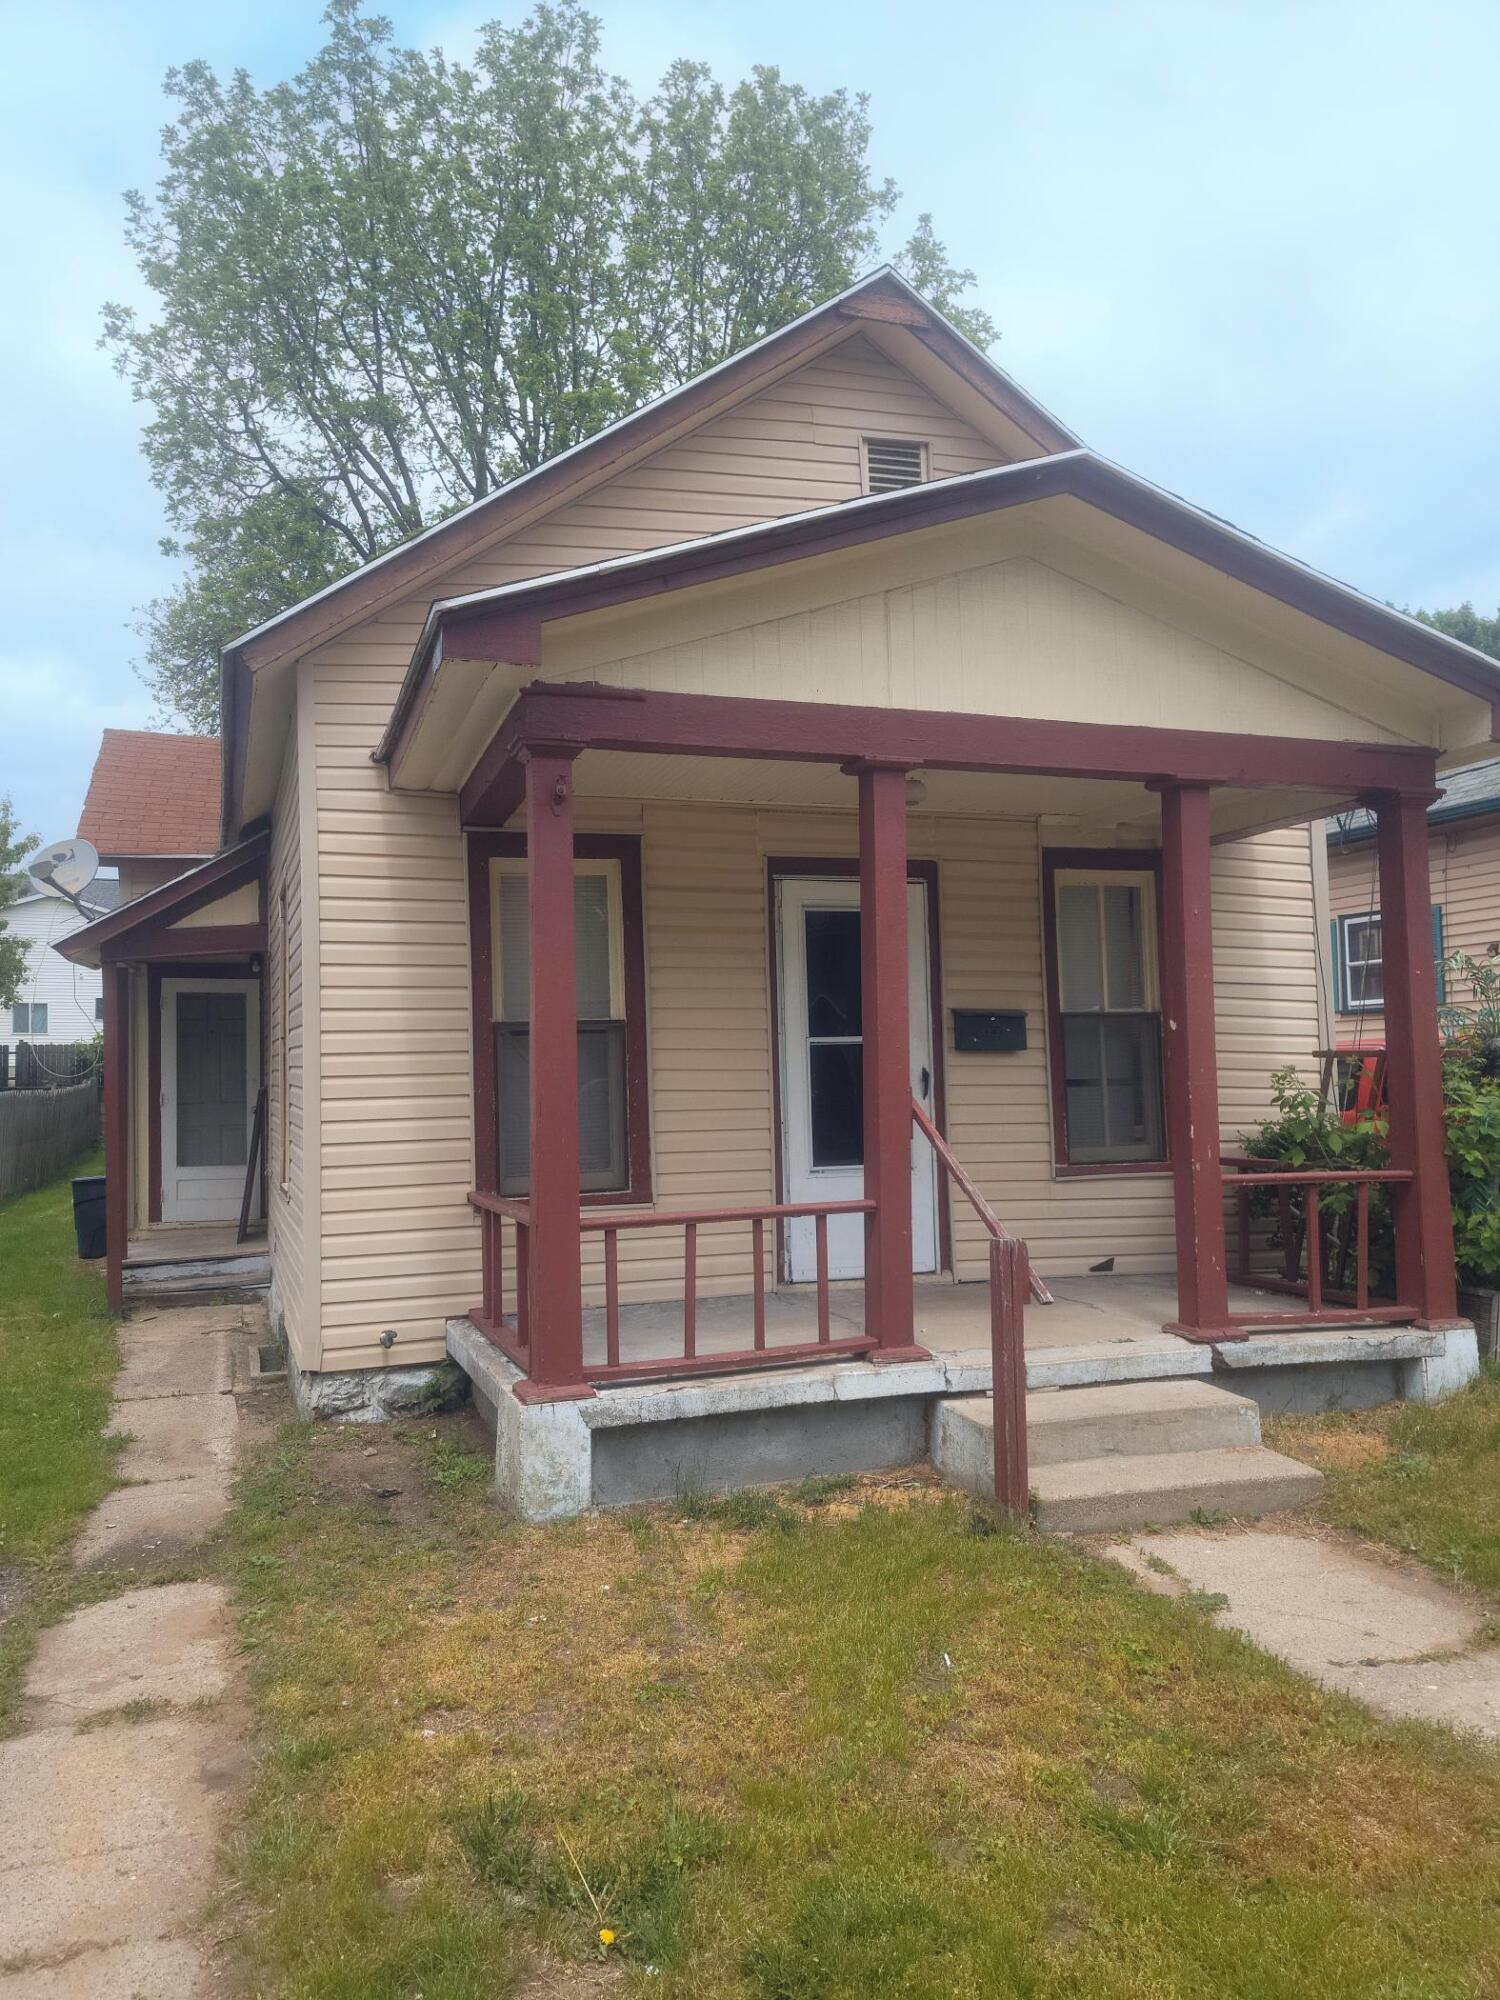
$129,900
2
bds
|
1
ba
|
806
sqft
|
built
1912
427 Highland St SE, Grand Rapids, MI 49507
$258
Cash flow
10.4%
Cash-on-Cash Return
8.5%
Cap rate
1.1%
Rent to Value Ratio
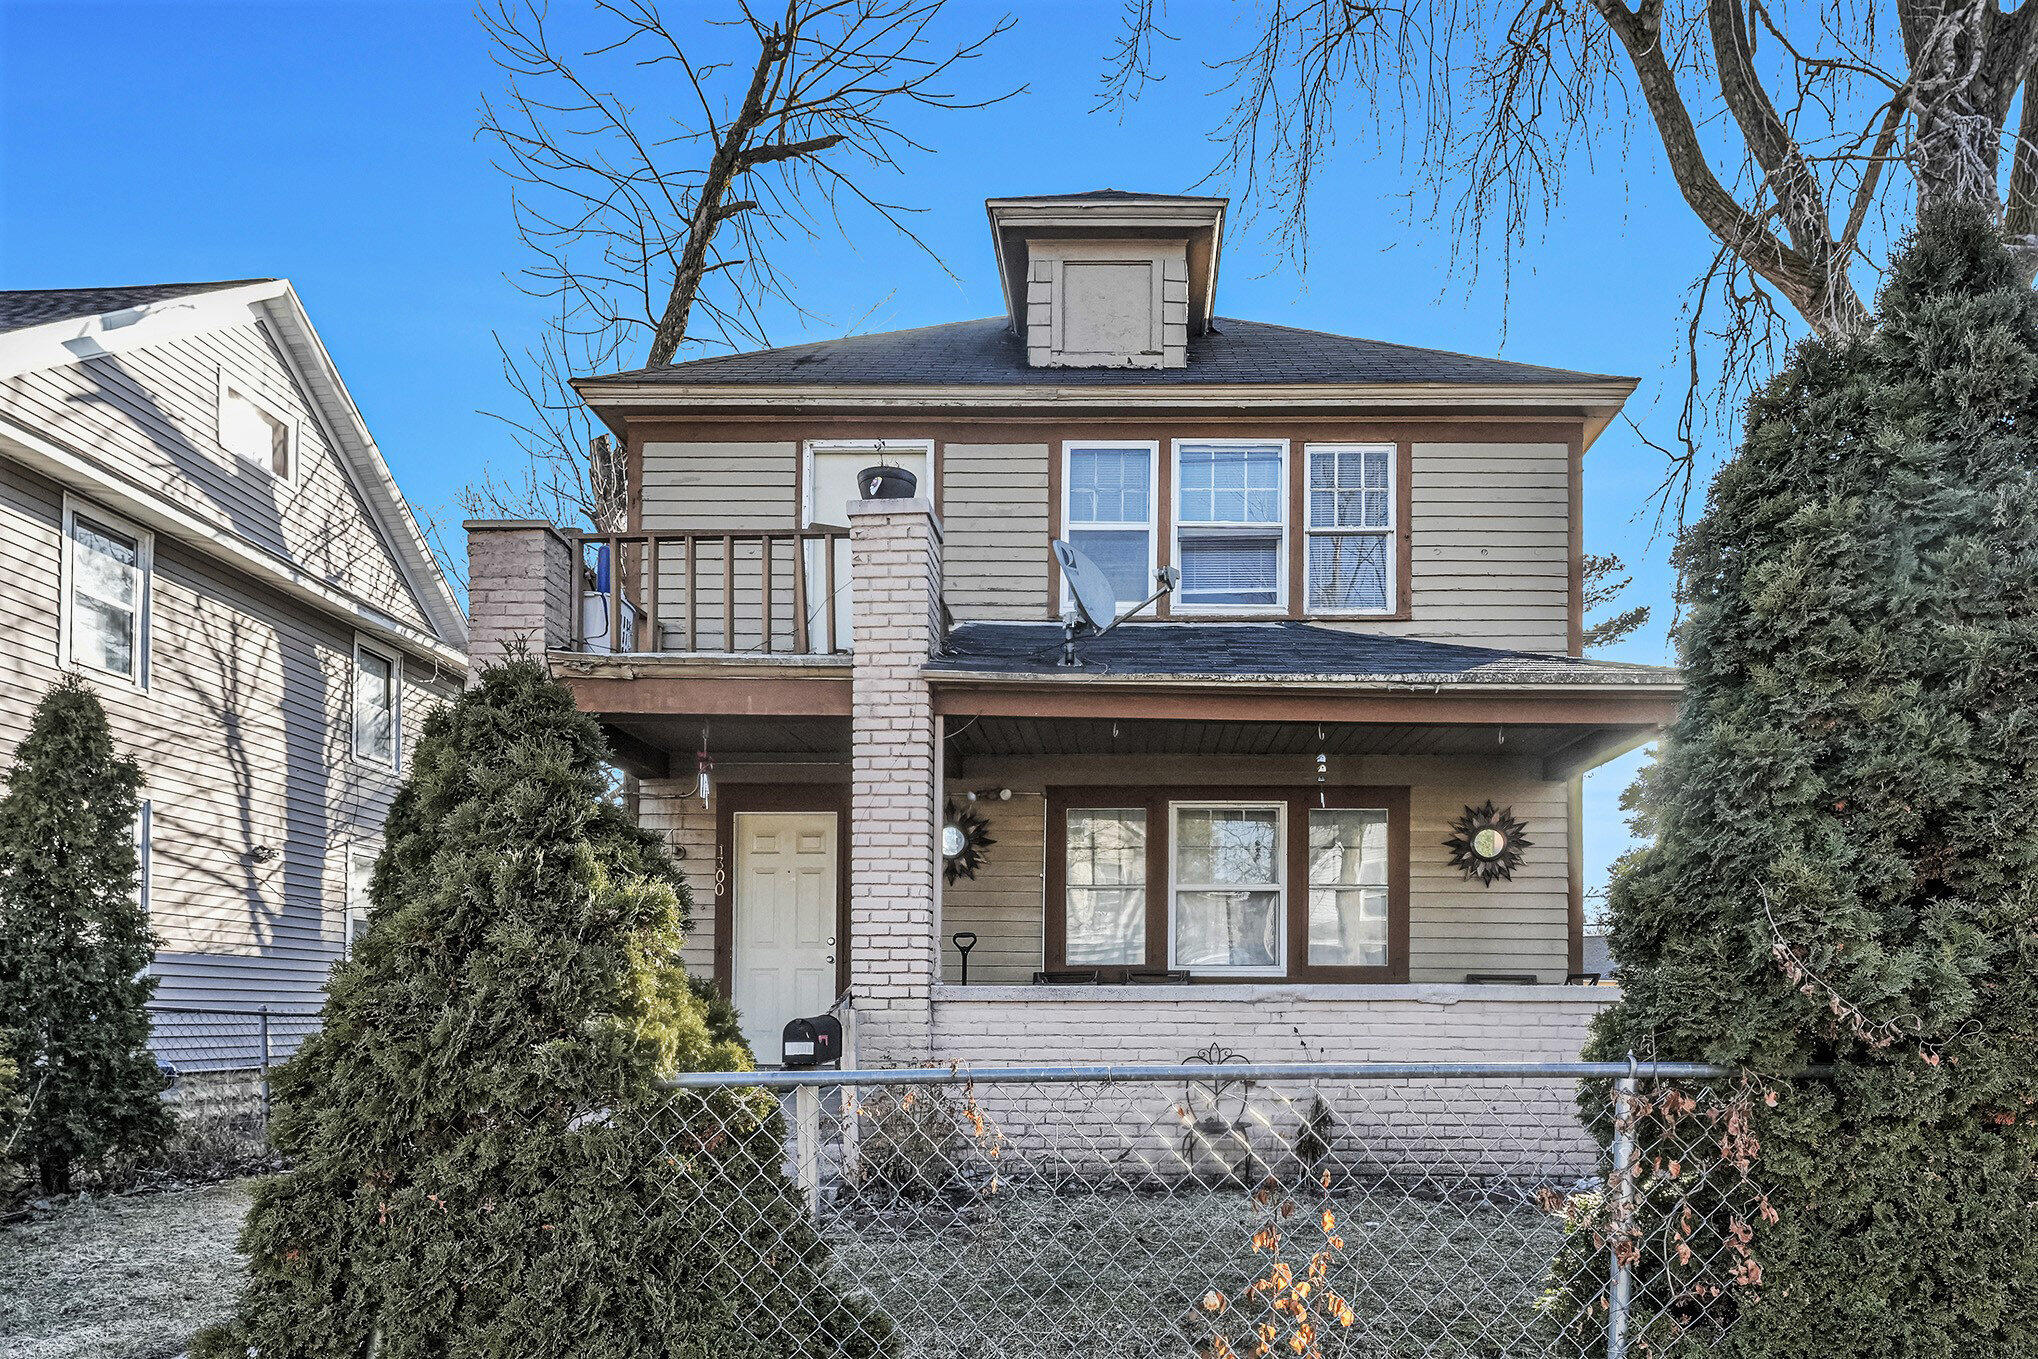
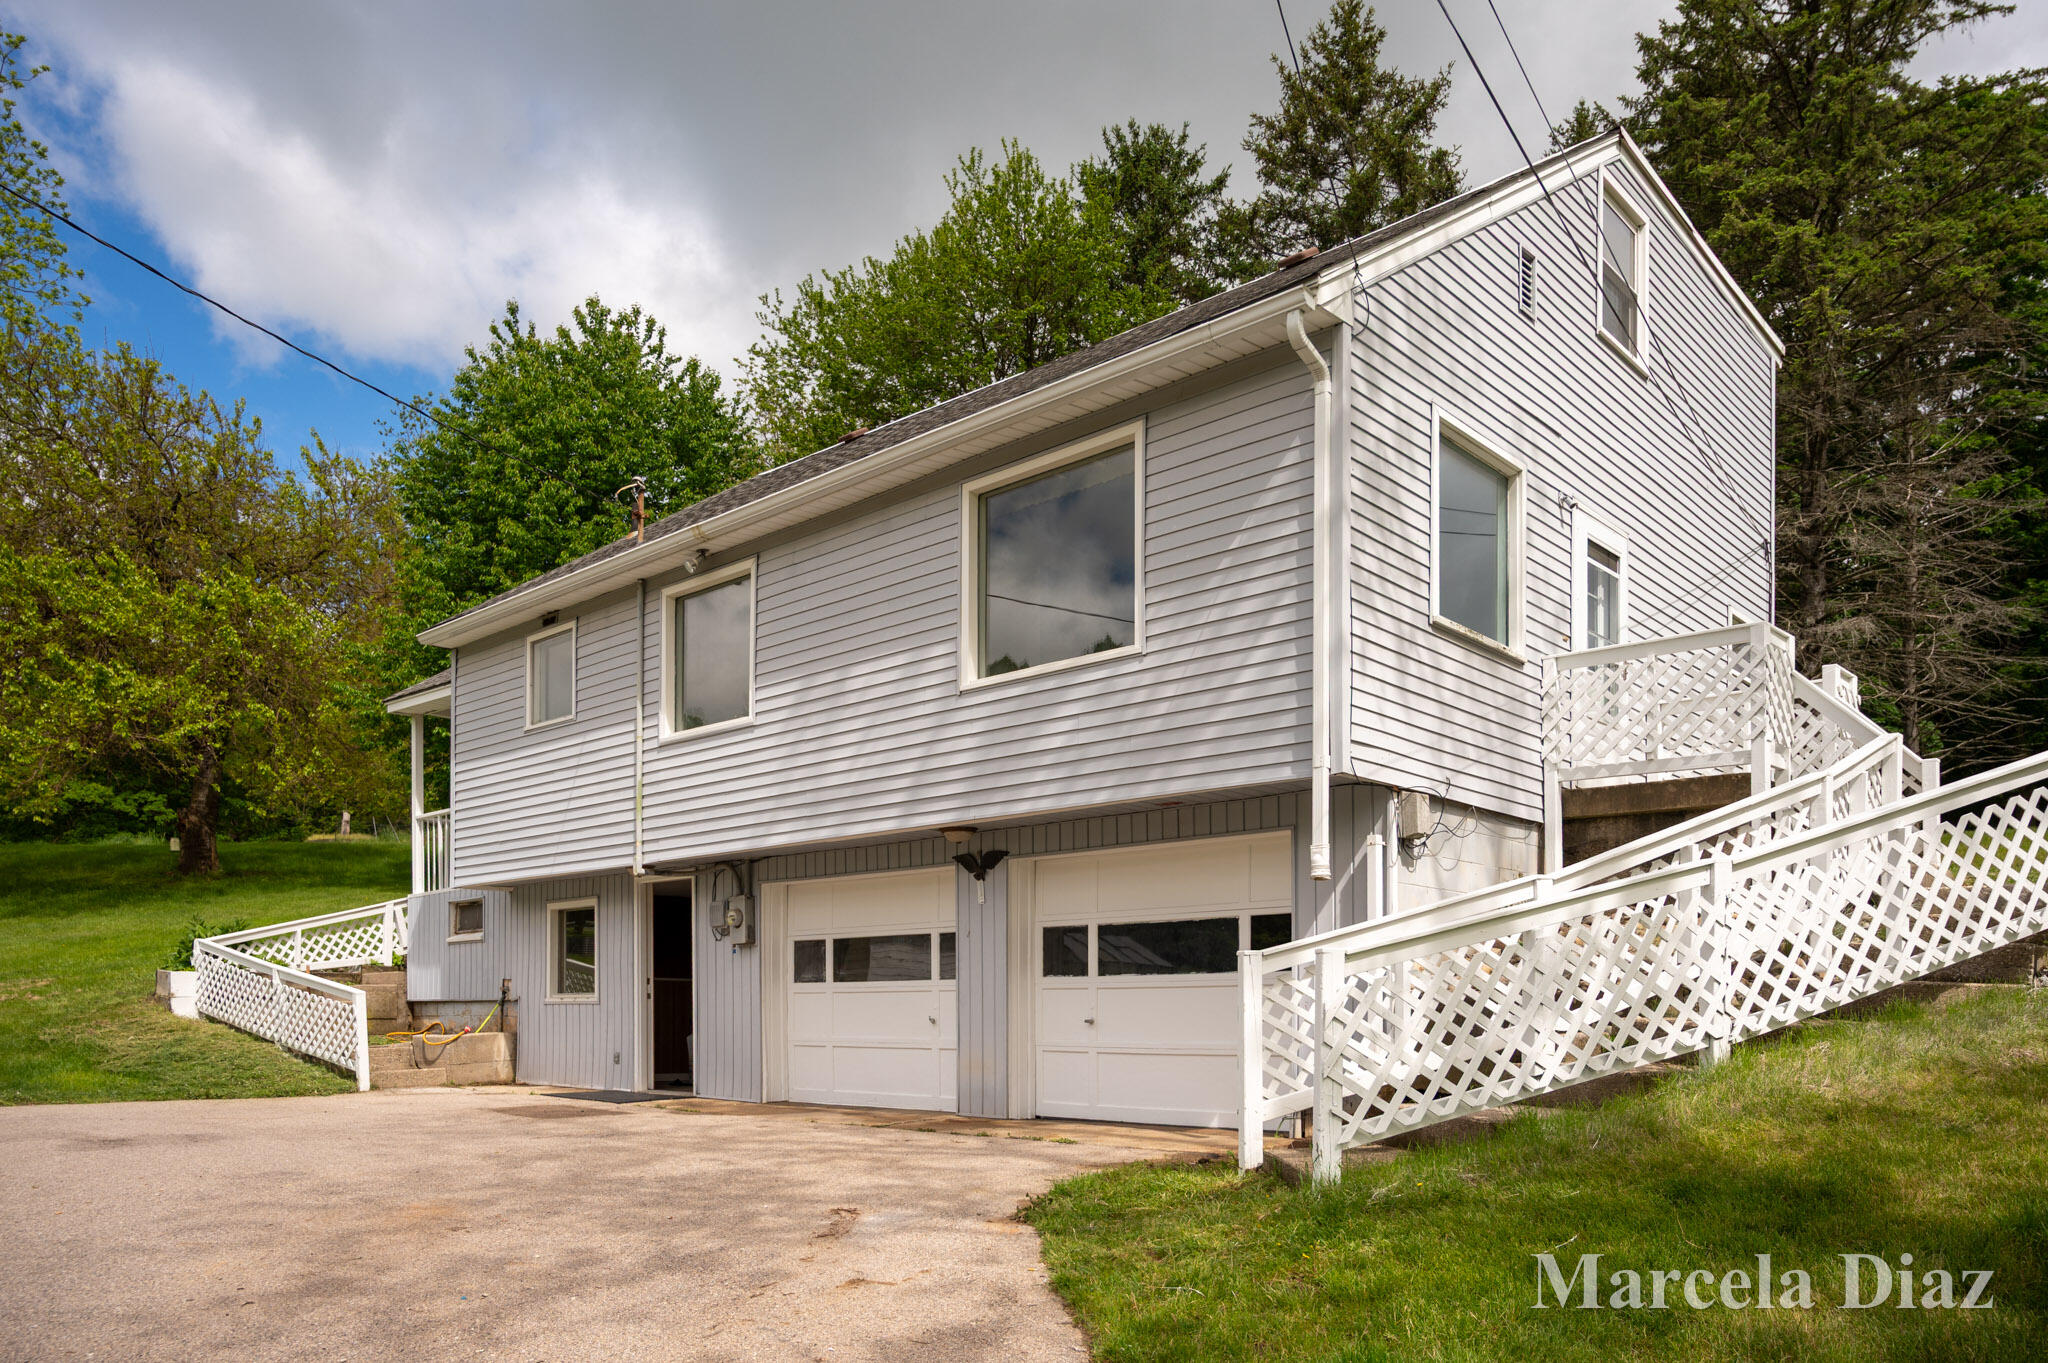
Active
$239,900
bds
|
0
ba
|
0
sqft
|
built
1925
1300 Cass Ave SE, Grand Rapids, MI 49507
$8
Cash flow
0.2%
Cash-on-Cash Return
6.2%
Cap rate
0.8%
Rent to Value Ratio
479 out of 649 properties for sale in Kent County
Limited Results Shown
Create a free account, or log in to reveal all property listings and enjoy the complete experience.
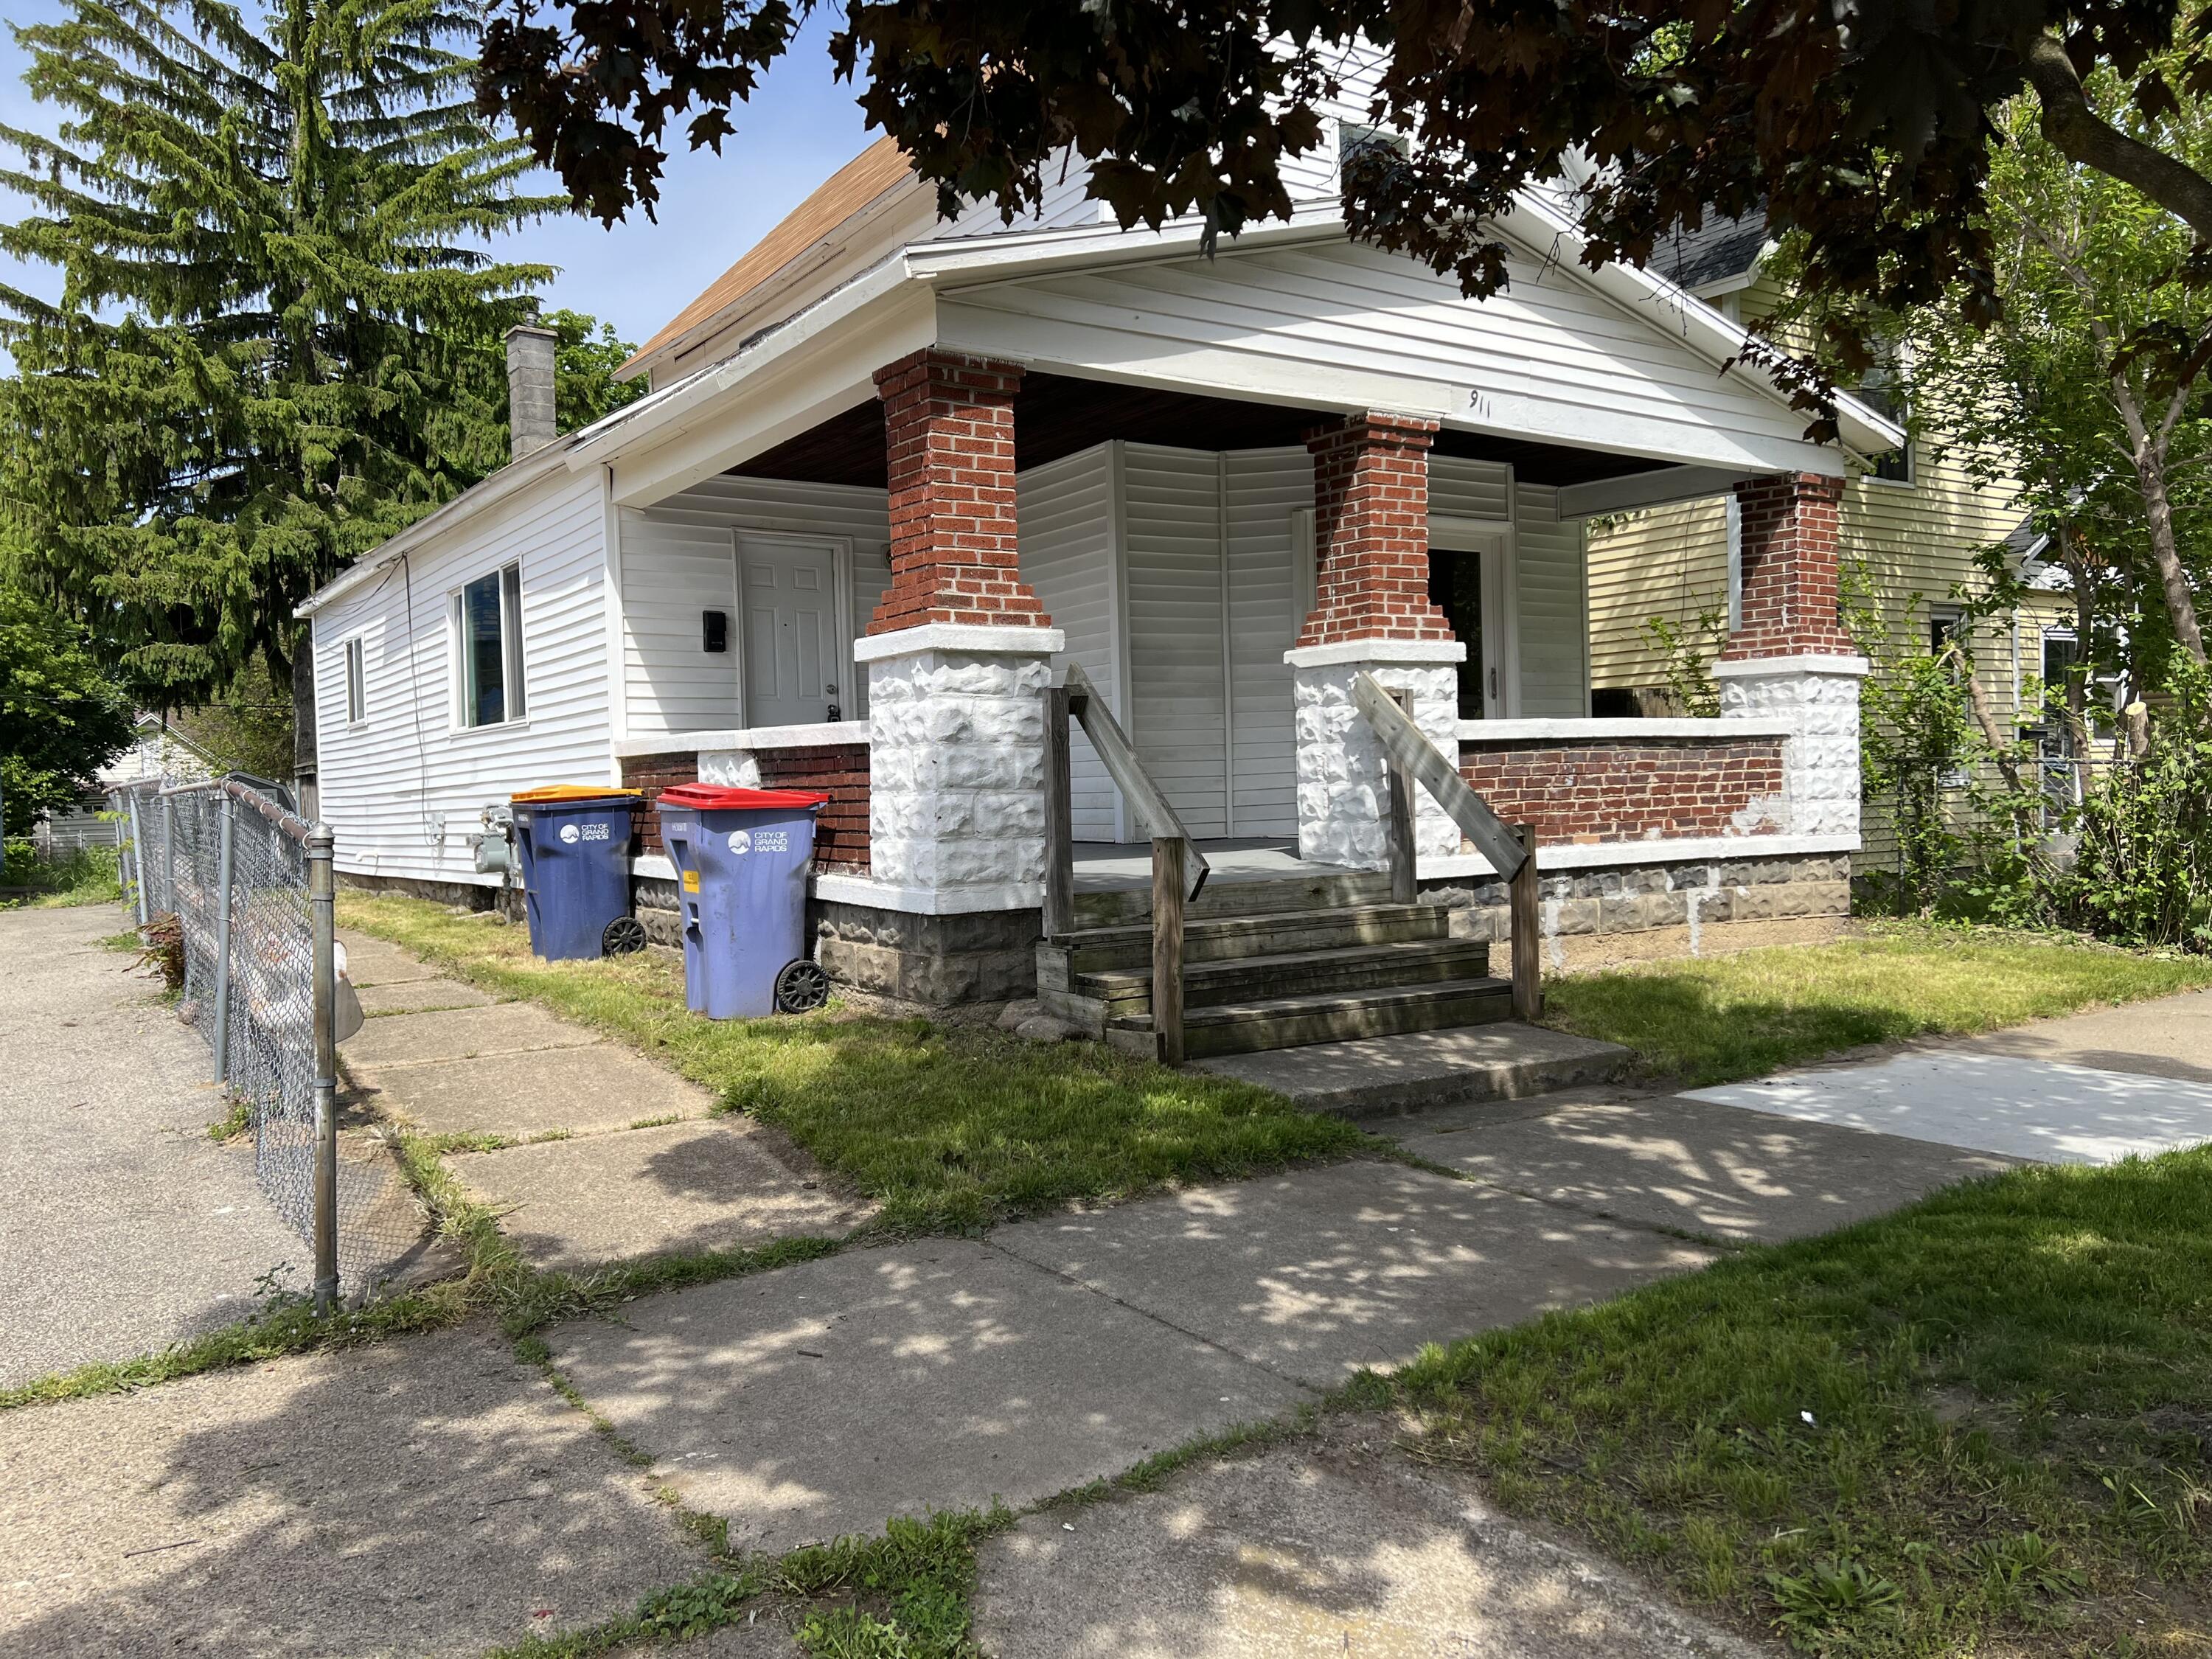
Active
$215,975
3
bds
|
1
ba
|
1,255
sqft
|
built
1865
911 Muskegon Ave NW, Grand Rapids, MI 49504
$-193
Cash flow
-4.7%
Cash-on-Cash Return
5.1%
Cap rate
0.8%
Rent to Value Ratio

Active
$775,000
4
bds
|
2
ba
|
1,657
sqft
|
built
1931
8779 Je Ne Be Dr NE, Rockford, MI 49341
$-2,387
Cash flow
-16.1%
Cash-on-Cash Return
2.5%
Cap rate
0.5%
Rent to Value Ratio
Active
$309,900
2
bds
|
1
ba
|
1,110
sqft
|
built
1900
600 Broadway Ave NW, Grand Rapids, MI 49504
$-964
Cash flow
-16.2%
Cash-on-Cash Return
2.4%
Cap rate
0.7%
Rent to Value Ratio
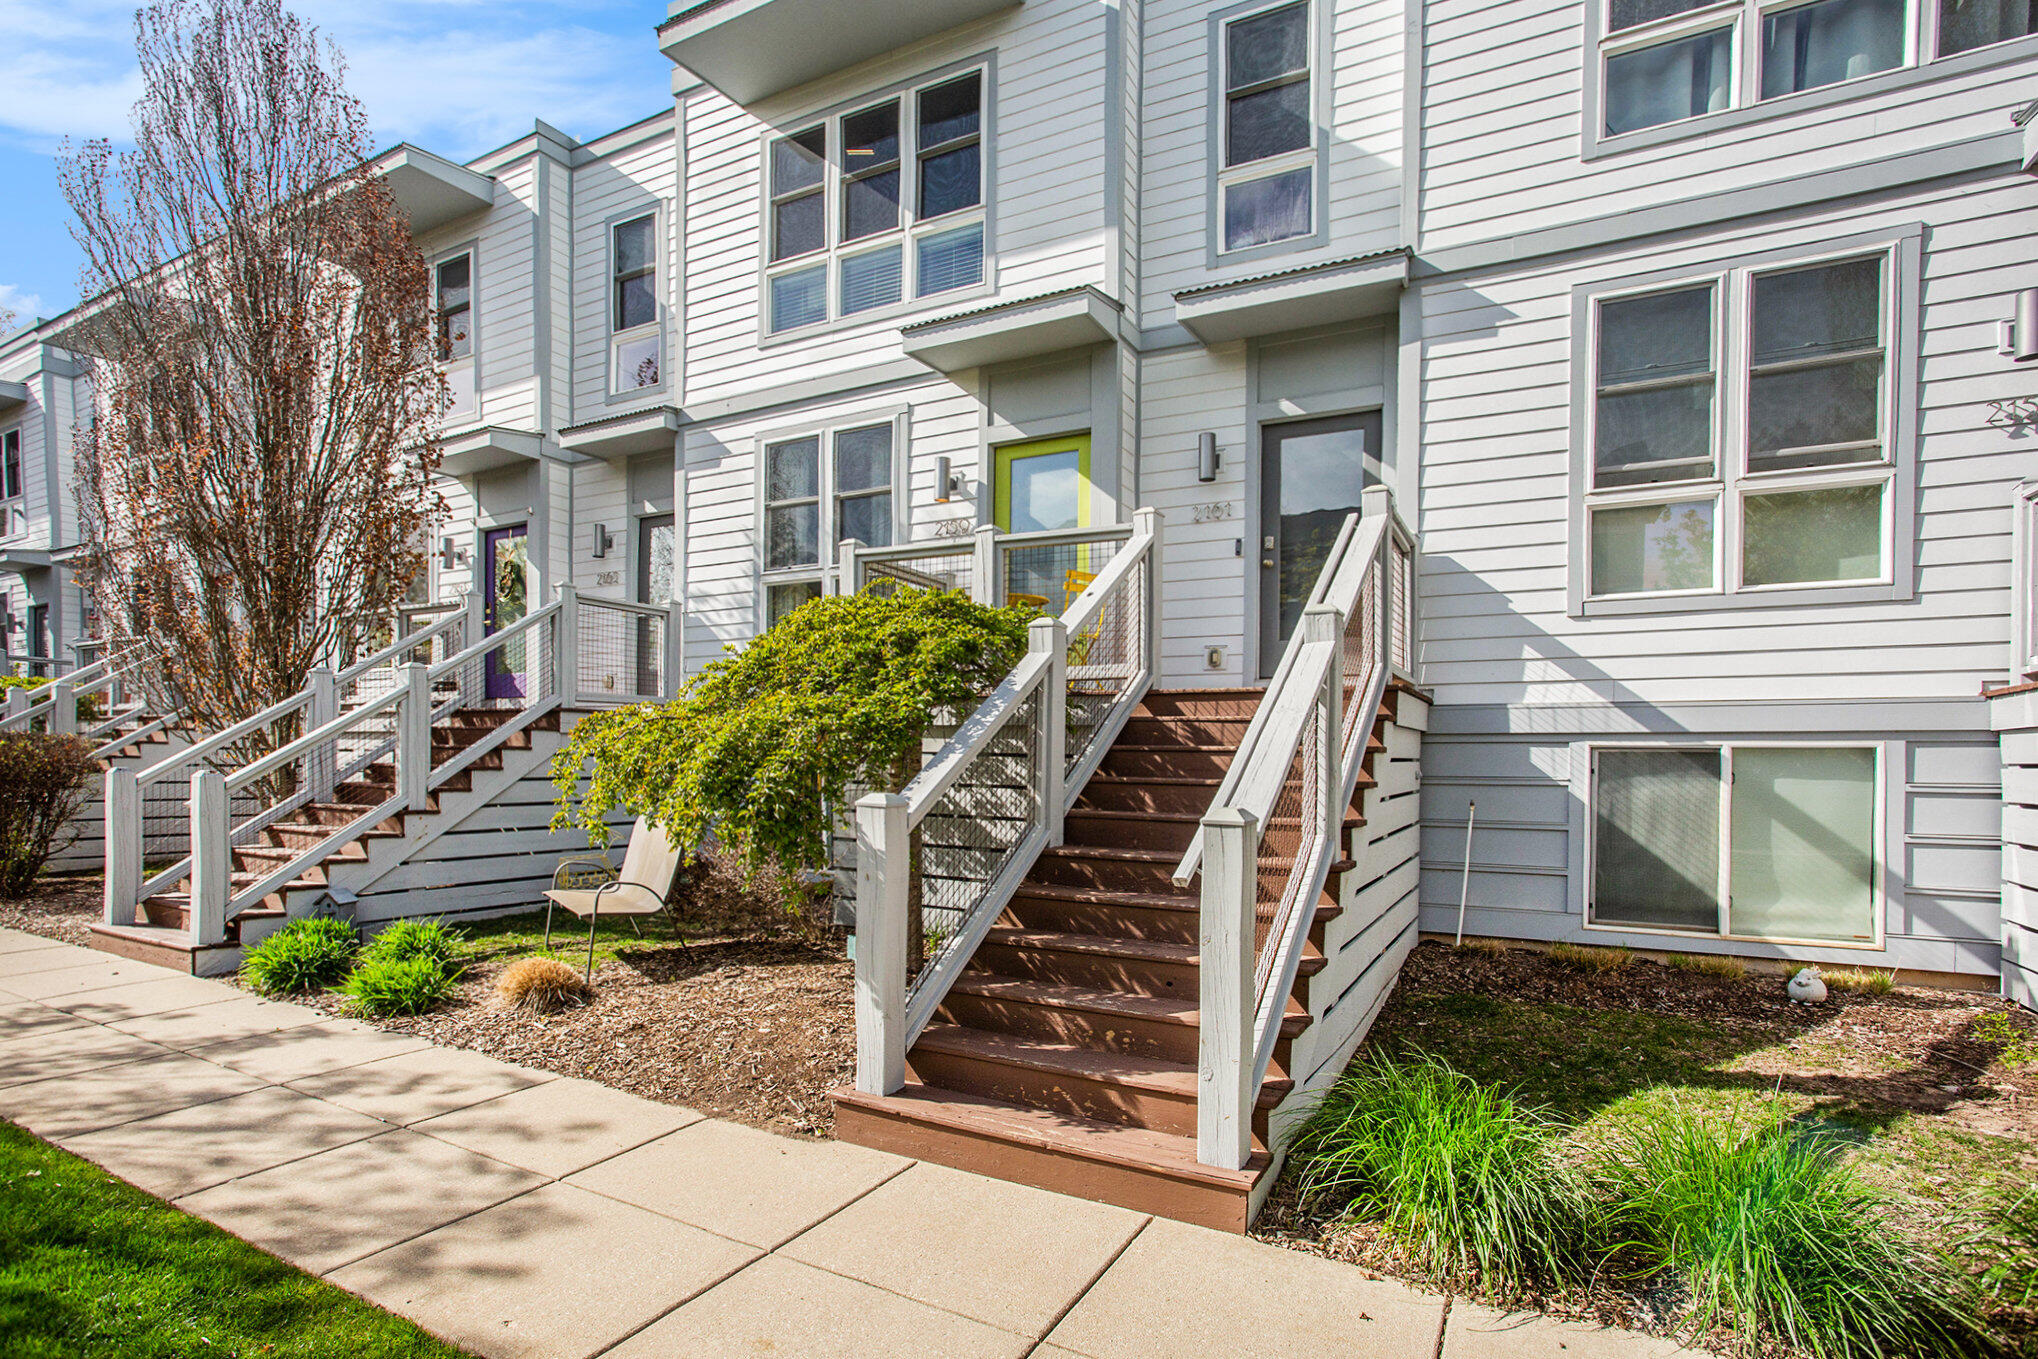
Pending
$319,900
3
bds
|
2
ba
|
1,448
sqft
|
built
2008
2159 New Town Dr NE, Grand Rapids, MI 49525
$-624
Cash flow
-10.2%
Cash-on-Cash Return
3.8%
Cap rate
0.7%
Rent to Value Ratio

Pending
$595,000
4
bds
|
3
ba
|
2,574
sqft
|
built
2014
3724 Charlevoix Dr SE, Grand Rapids, MI 49546
$-1,364
Cash flow
-12.0%
Cash-on-Cash Return
3.4%
Cap rate
0.5%
Rent to Value Ratio
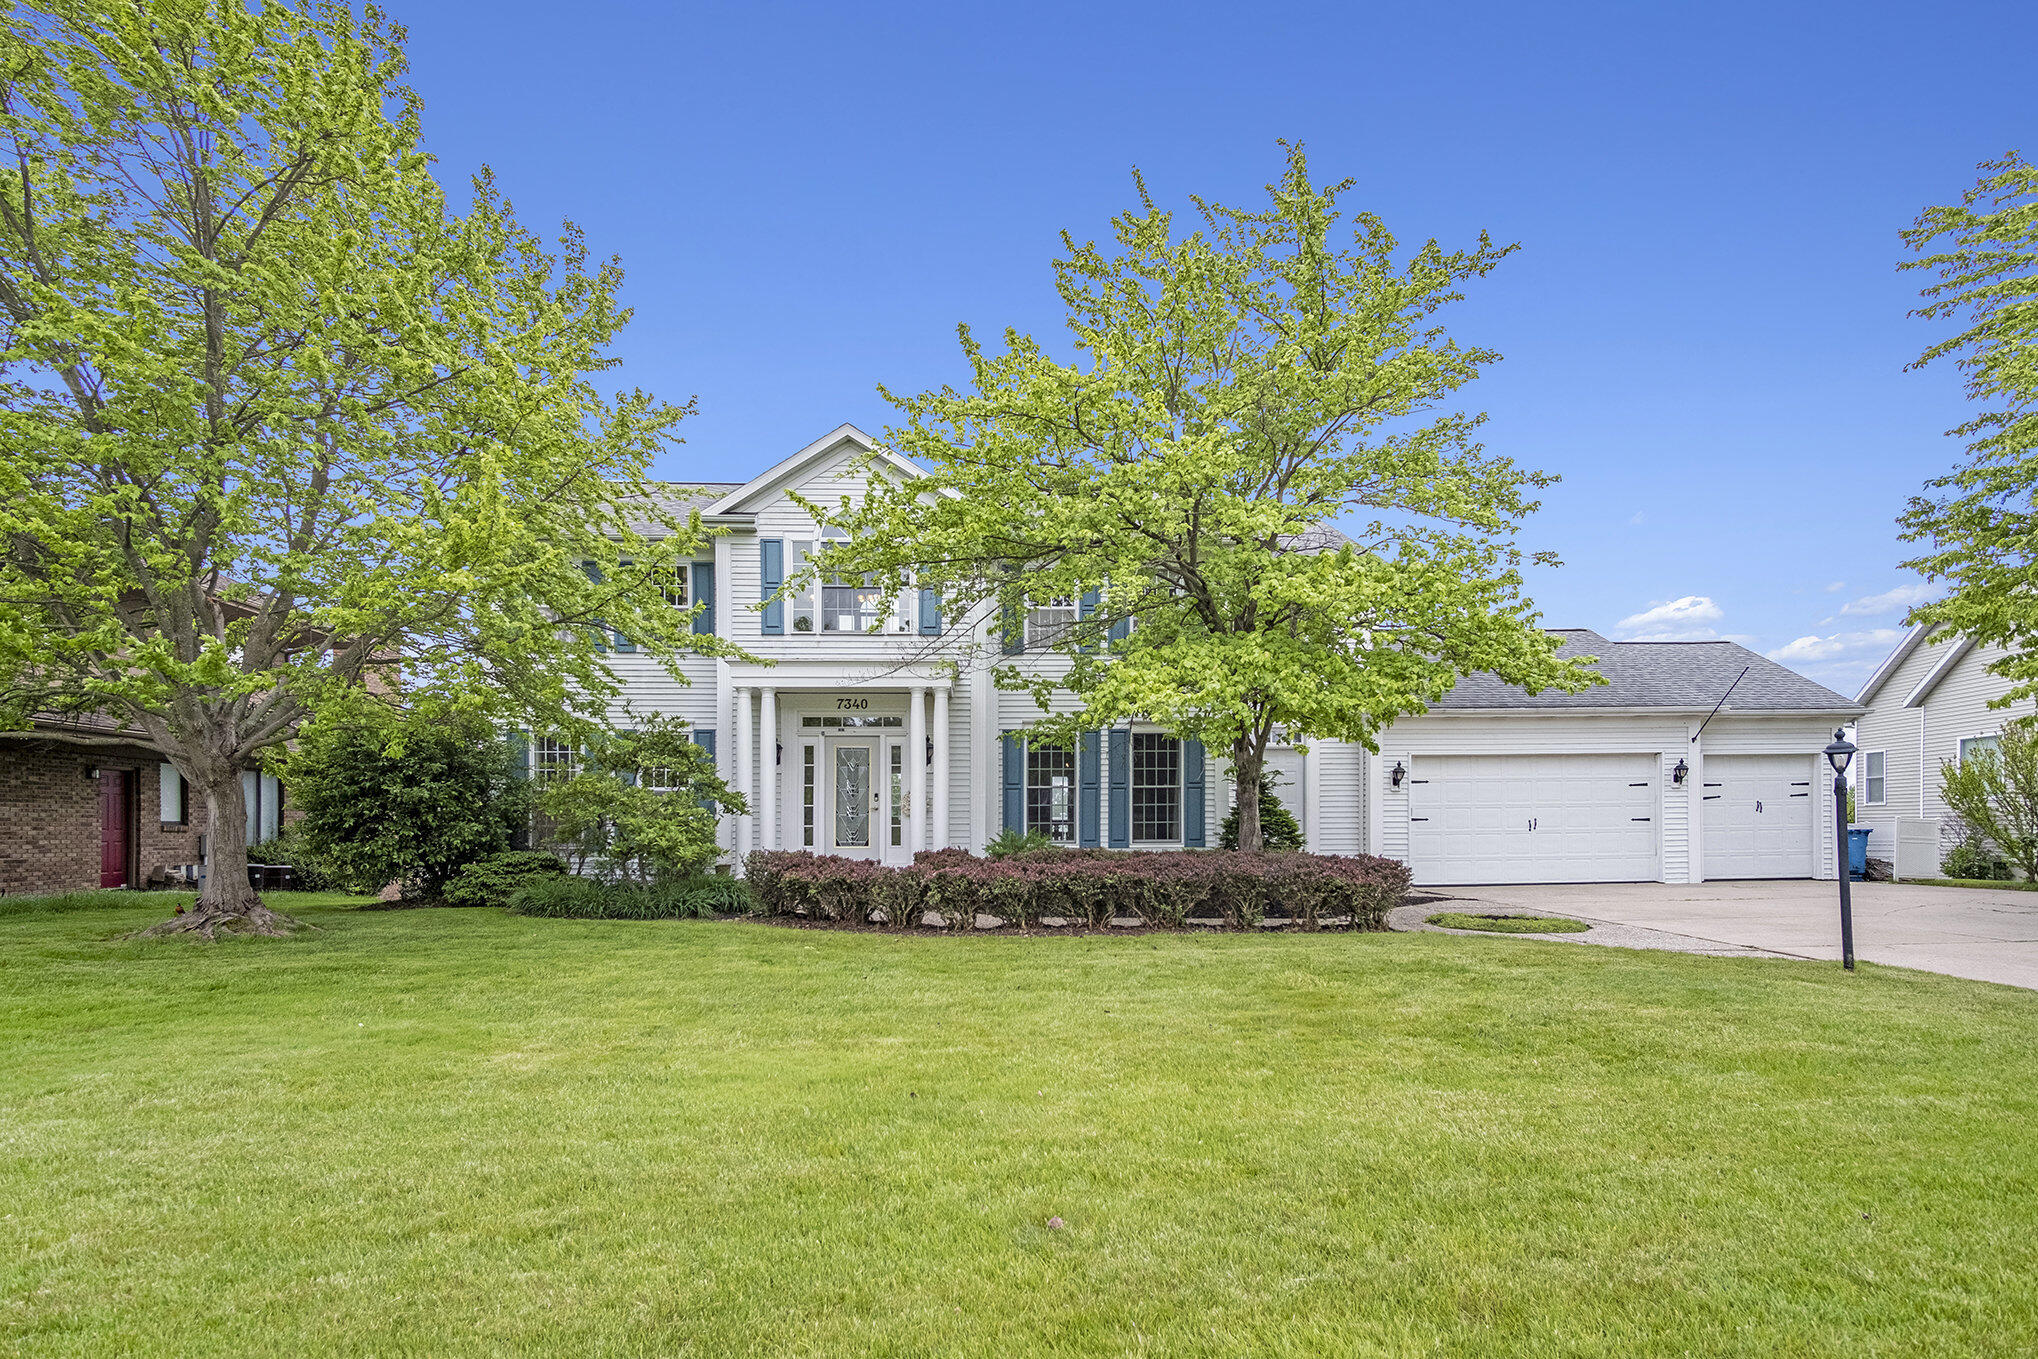
Active
$639,900
5
bds
|
5
ba
|
5,041
sqft
|
built
1990
7340 Royal Ridge Dr SE, Caledonia, MI 49316
$-1,260
Cash flow
-10.3%
Cash-on-Cash Return
3.8%
Cap rate
0.6%
Rent to Value Ratio

Active
$699,900
4
bds
|
4
ba
|
3,440
sqft
|
built
2014
1506 Providence Cove Ct, Byron Center, MI 49315
$-1,620
Cash flow
-12.1%
Cash-on-Cash Return
3.4%
Cap rate
0.6%
Rent to Value Ratio
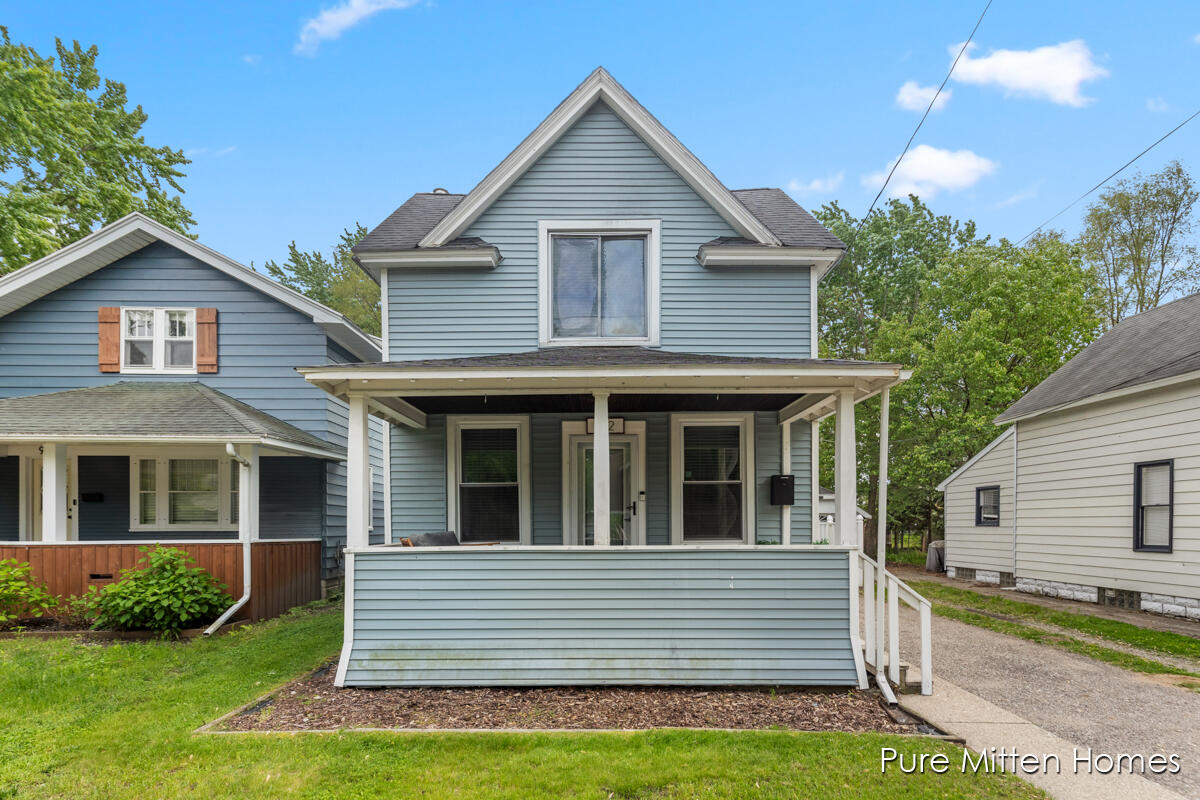
Active
$300,000
3
bds
|
2
ba
|
1,600
sqft
|
built
1900
912 Arianna St NW, Grand Rapids, MI 49504
$-569
Cash flow
-9.9%
Cash-on-Cash Return
3.9%
Cap rate
0.6%
Rent to Value Ratio
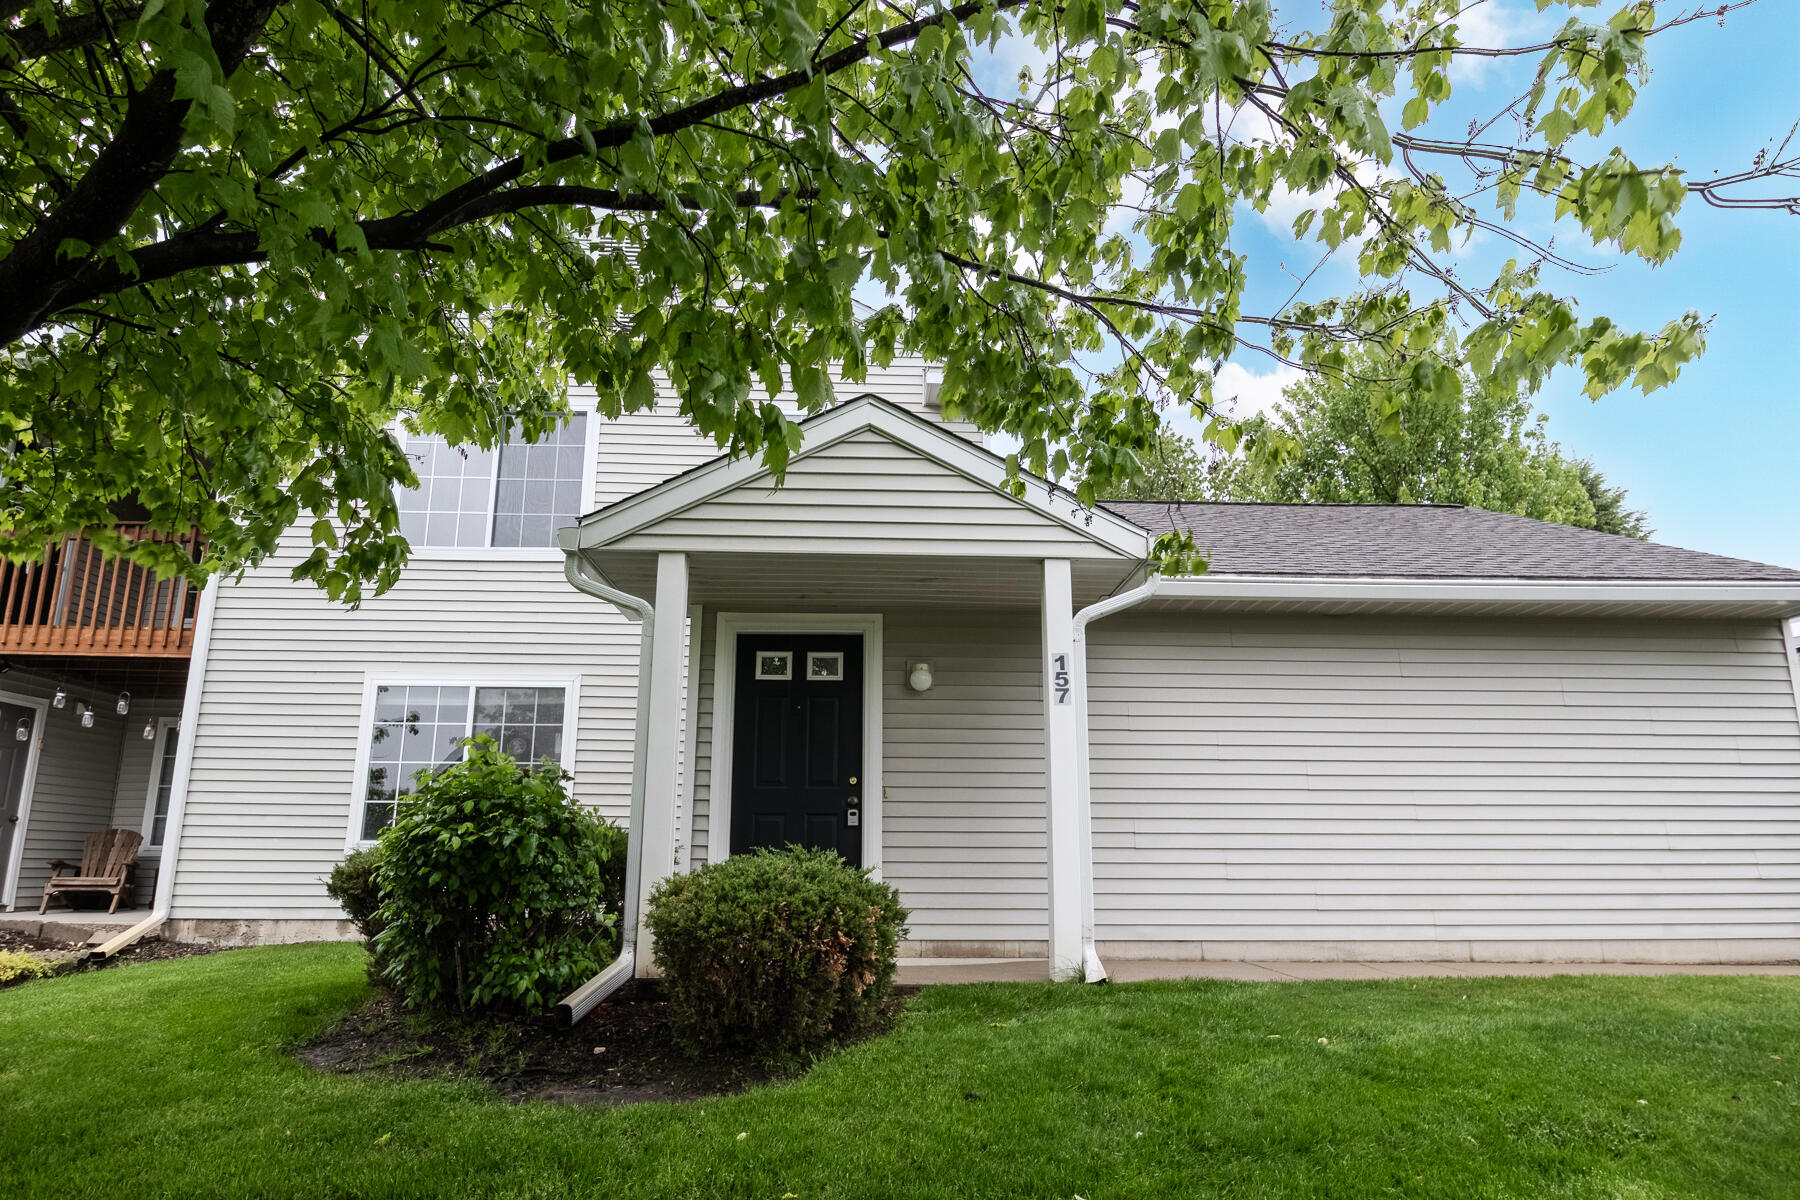
Active
$219,000
1
bds
|
1
ba
|
926
sqft
|
built
1995
157 Hunters Ln NE, Rockford, MI 49341
$-405
Cash flow
-9.6%
Cash-on-Cash Return
3.9%
Cap rate
0.7%
Rent to Value Ratio
Active
$699,900
4
bds
|
3
ba
|
2,746
sqft
|
built
2022
1130 Haven Dr SE, Byron Center, MI 49315
$-2,996
Cash flow
-22.3%
Cash-on-Cash Return
1.0%
Cap rate
0.3%
Rent to Value Ratio
Pending
$225,000
2
bds
|
1
ba
|
850
sqft
|
built
1940
834 34th St SW, Wyoming, MI 49509
$-266
Cash flow
-6.2%
Cash-on-Cash Return
4.7%
Cap rate
0.7%
Rent to Value Ratio
Active
$950,000
6
bds
|
4
ba
|
4,319
sqft
|
built
2001
7701 Sunset Ct SE, Caledonia, MI 49316
$-2,681
Cash flow
-14.7%
Cash-on-Cash Return
2.8%
Cap rate
0.4%
Rent to Value Ratio
Active
$227,900
2
bds
|
2
ba
|
929
sqft
|
built
1967
2463 Abbington Dr SE, Grand Rapids, MI 49506
$-366
Cash flow
-8.4%
Cash-on-Cash Return
4.2%
Cap rate
0.8%
Rent to Value Ratio
Active
$450,000
4
bds
|
2
ba
|
1,392
sqft
|
built
1960
9555 Eastern Ave SE, Byron Center, MI 49315
$-883
Cash flow
-10.2%
Cash-on-Cash Return
3.8%
Cap rate
0.5%
Rent to Value Ratio
Active
$459,000
4
bds
|
3
ba
|
2,341
sqft
|
built
1997
2511 Bowenton Pl SW, Wyoming, MI 49519
$-804
Cash flow
-9.1%
Cash-on-Cash Return
4.0%
Cap rate
0.6%
Rent to Value Ratio

Pending
$369,000
3
bds
|
3
ba
|
1,976
sqft
|
built
2004
1712 Lisa Dr SW, Byron Center, MI 49315
$-703
Cash flow
-9.9%
Cash-on-Cash Return
3.9%
Cap rate
0.7%
Rent to Value Ratio
Pending
$595,000
4
bds
|
3
ba
|
2,469
sqft
|
built
1890
522 Paris Ave SE, Grand Rapids, MI 49503
$-1,679
Cash flow
-14.7%
Cash-on-Cash Return
2.8%
Cap rate
0.4%
Rent to Value Ratio
Active
$239,900
bds
|
0
ba
|
0
sqft
|
built
1925
1300 Cass Ave SE, Grand Rapids, MI 49507
$8
Cash flow
0.2%
Cash-on-Cash Return
6.2%
Cap rate
0.8%
Rent to Value Ratio

Active
$319,900
3
bds
|
2
ba
|
1,387
sqft
|
built
1999
313 Pioneer Trl, Cedar Springs, MI 49319
$-429
Cash flow
-7.0%
Cash-on-Cash Return
4.5%
Cap rate
0.7%
Rent to Value Ratio
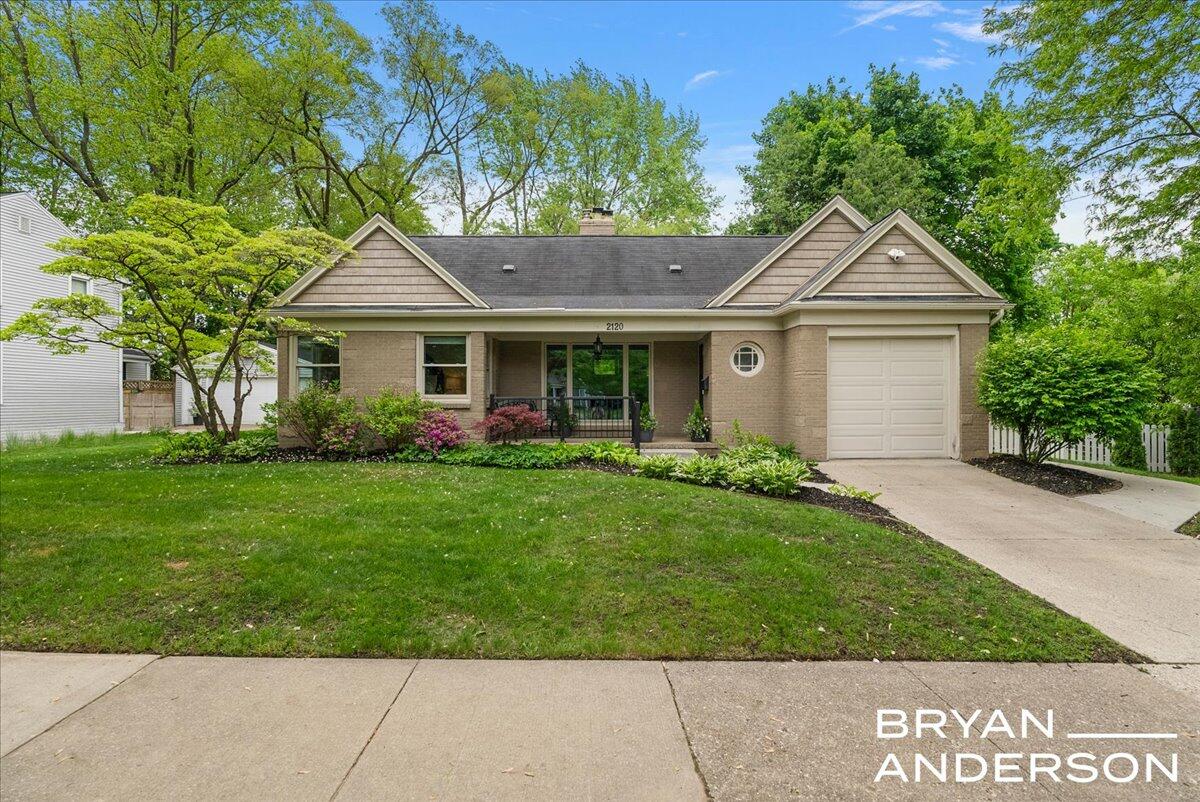
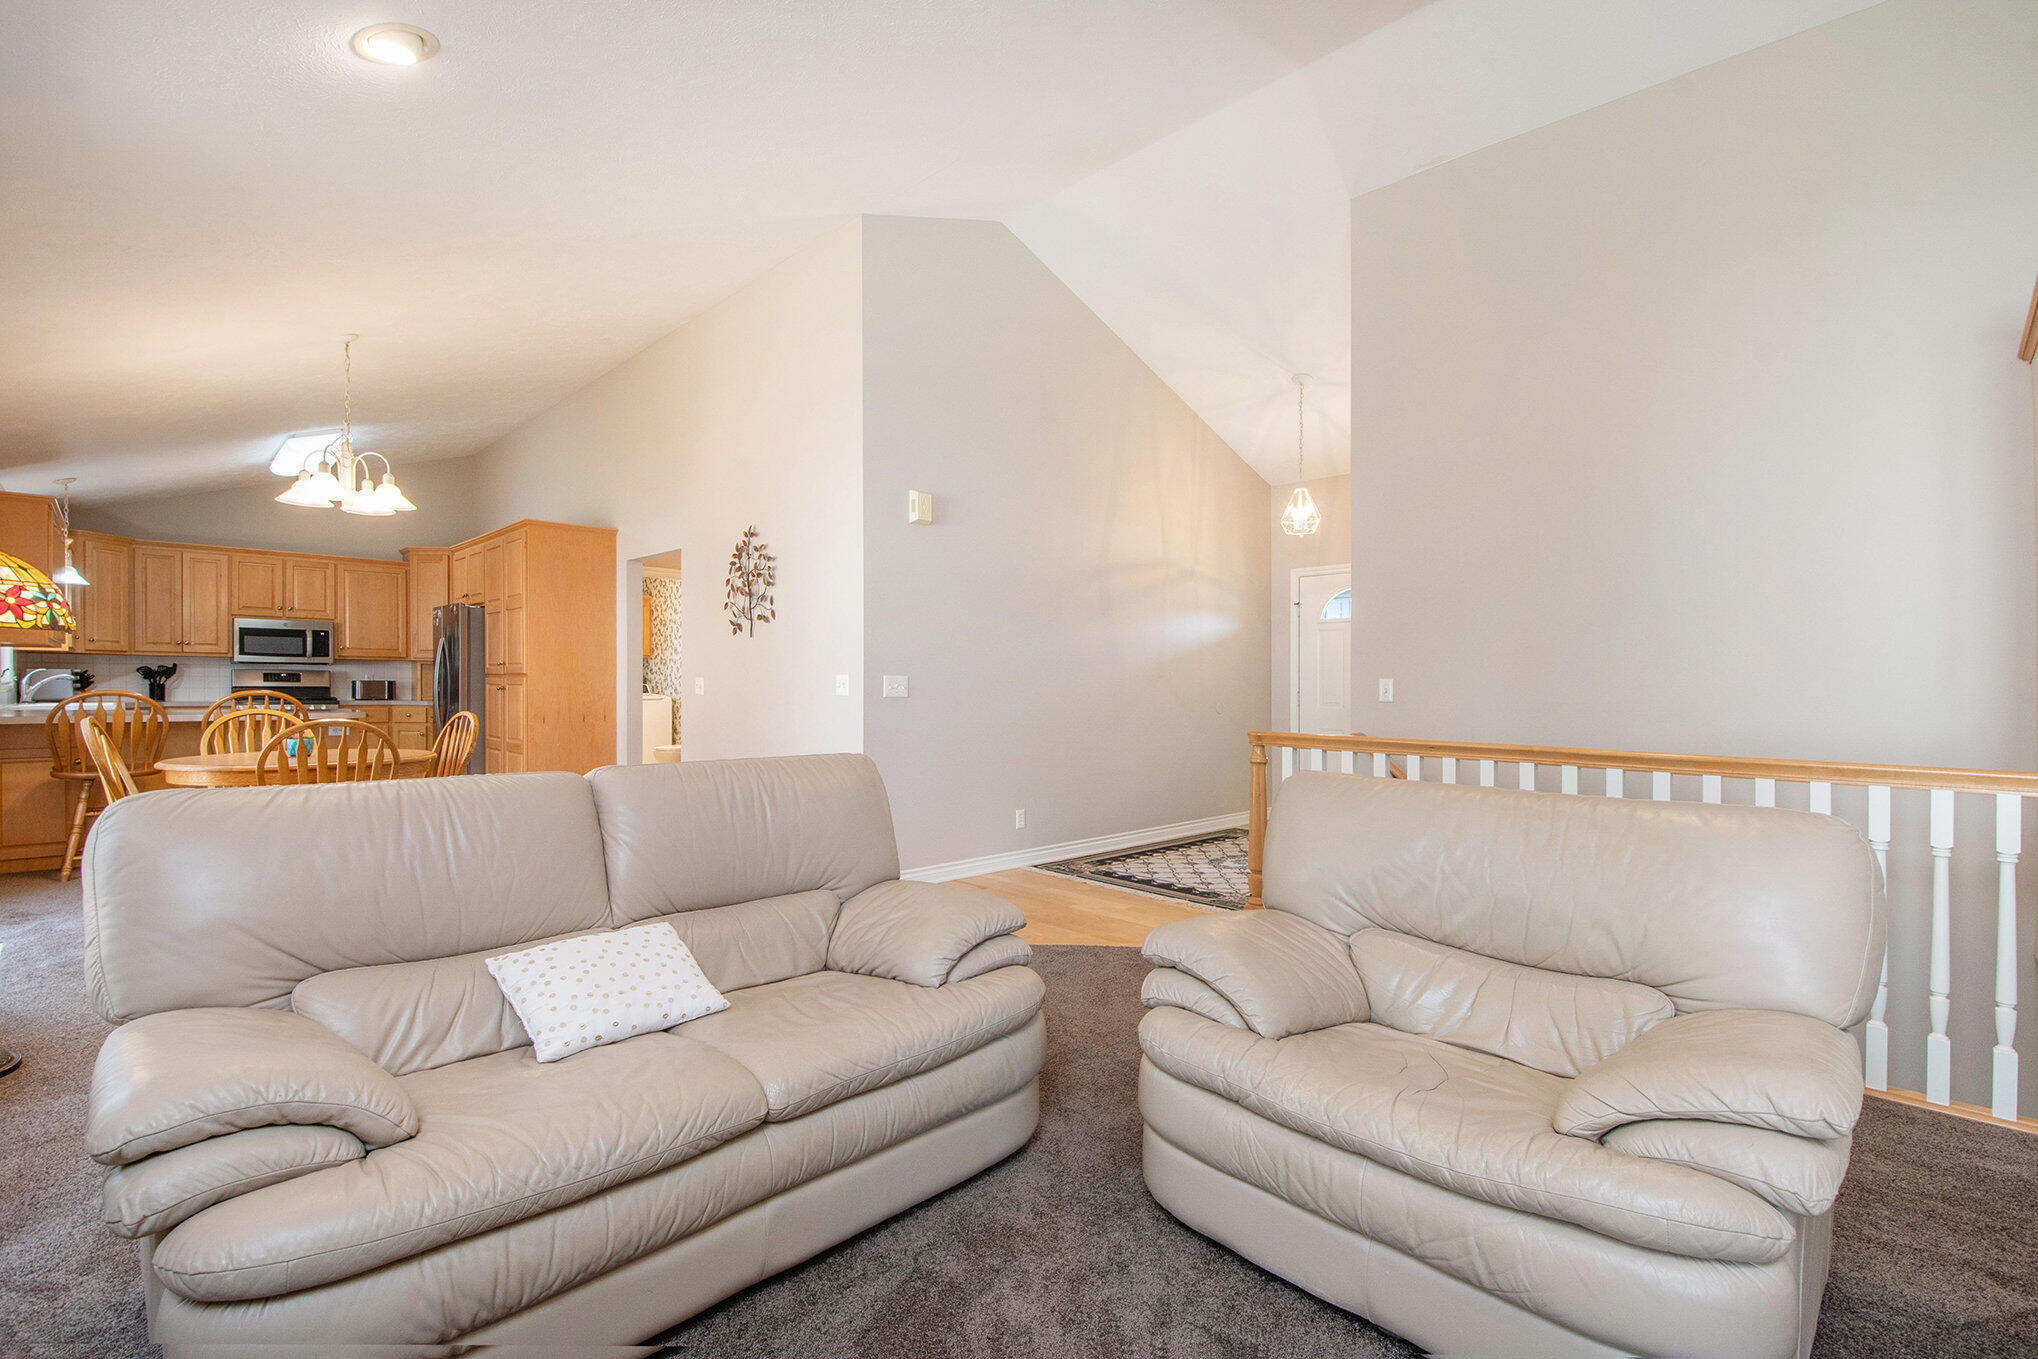
Active
$524,900
3
bds
|
2
ba
|
2,554
sqft
|
built
1948
2120 Englewood Dr SE, Grand Rapids, MI 49506
$-1,206
Cash flow
-12.0%
Cash-on-Cash Return
3.4%
Cap rate
0.6%
Rent to Value Ratio
Active
$950,000
6
bds
|
4
ba
|
4,096
sqft
|
built
1880
455 Madison Ave SE, Grand Rapids, MI 49503
$-2,964
Cash flow
-16.3%
Cash-on-Cash Return
2.4%
Cap rate
0.4%
Rent to Value Ratio

Active
$699,000
2
bds
|
3
ba
|
4,324
sqft
|
built
1953
1710 Kreft St NE, Grand Rapids, MI 49525
$-200
Cash flow
-1.5%
Cash-on-Cash Return
5.8%
Cap rate
0.7%
Rent to Value Ratio
Active
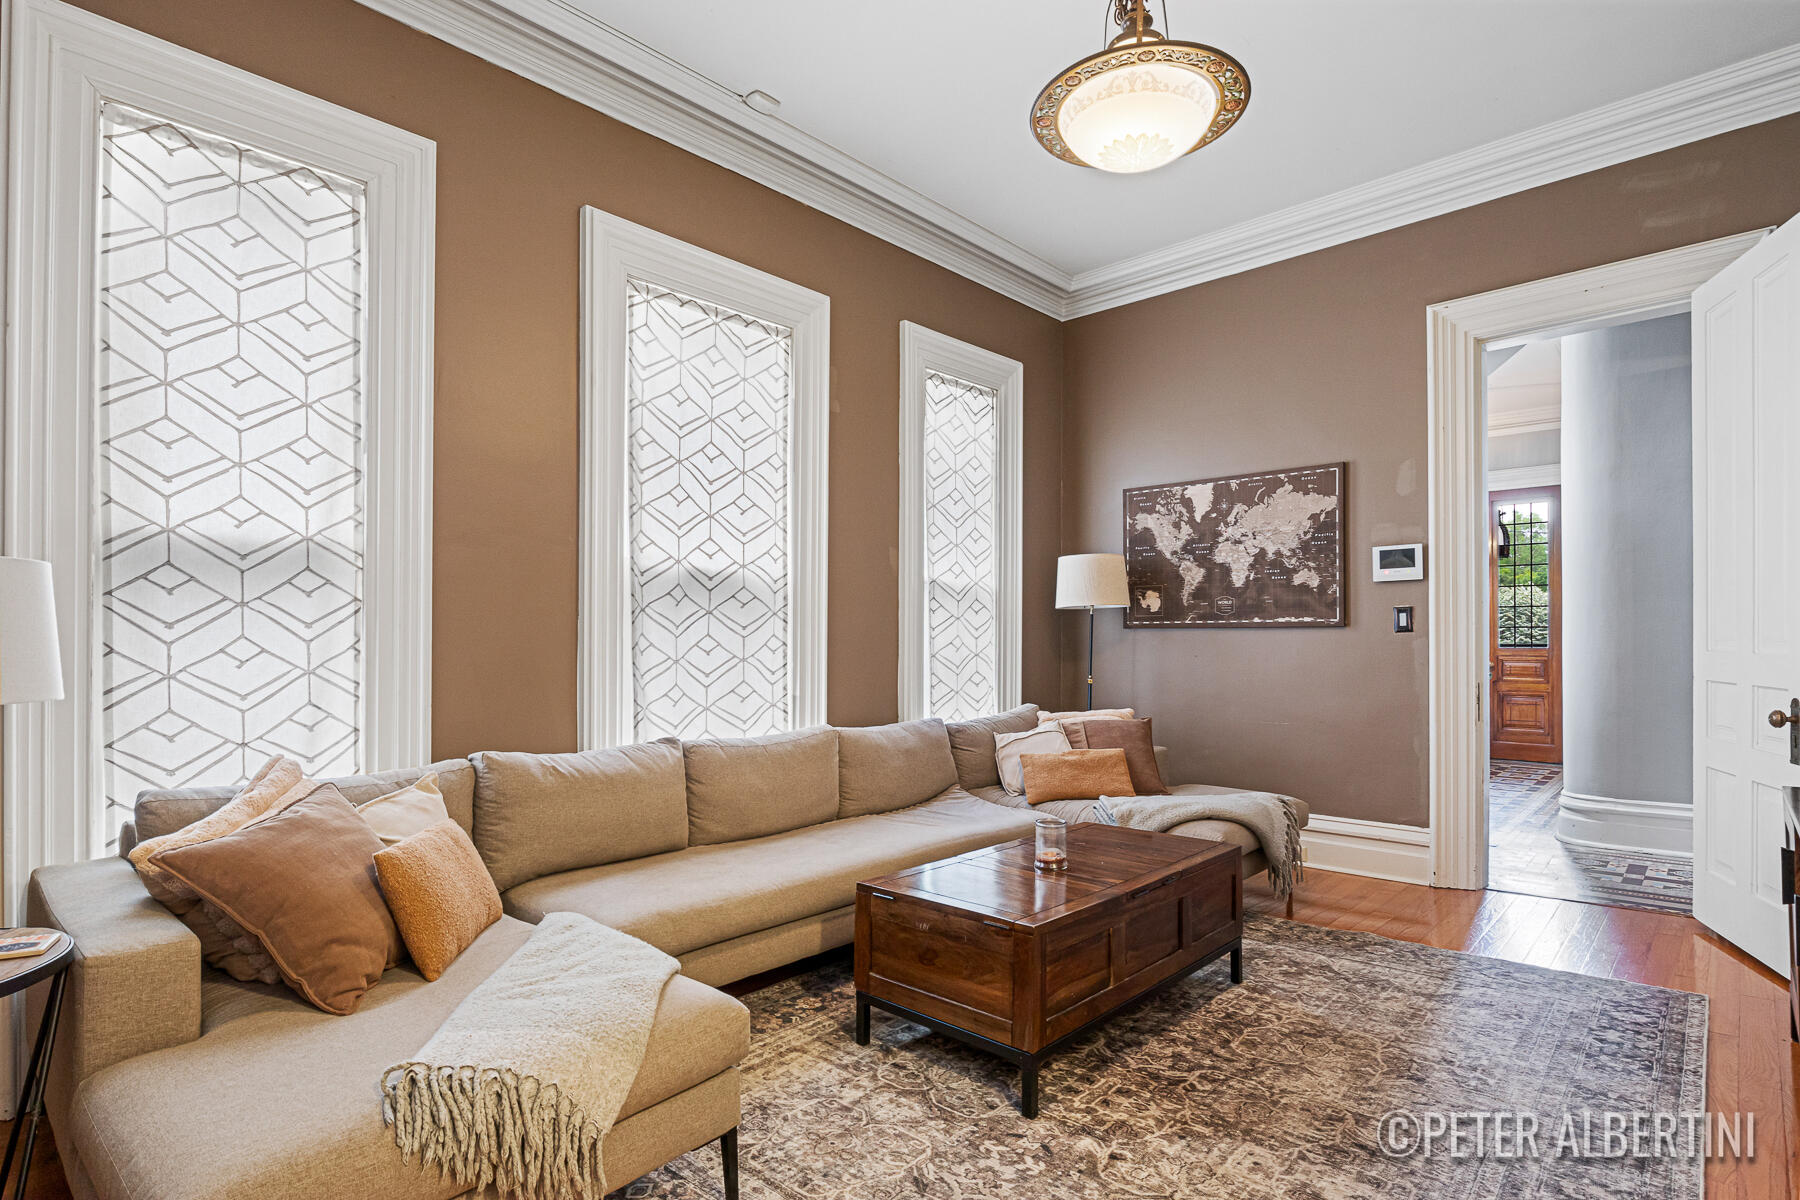
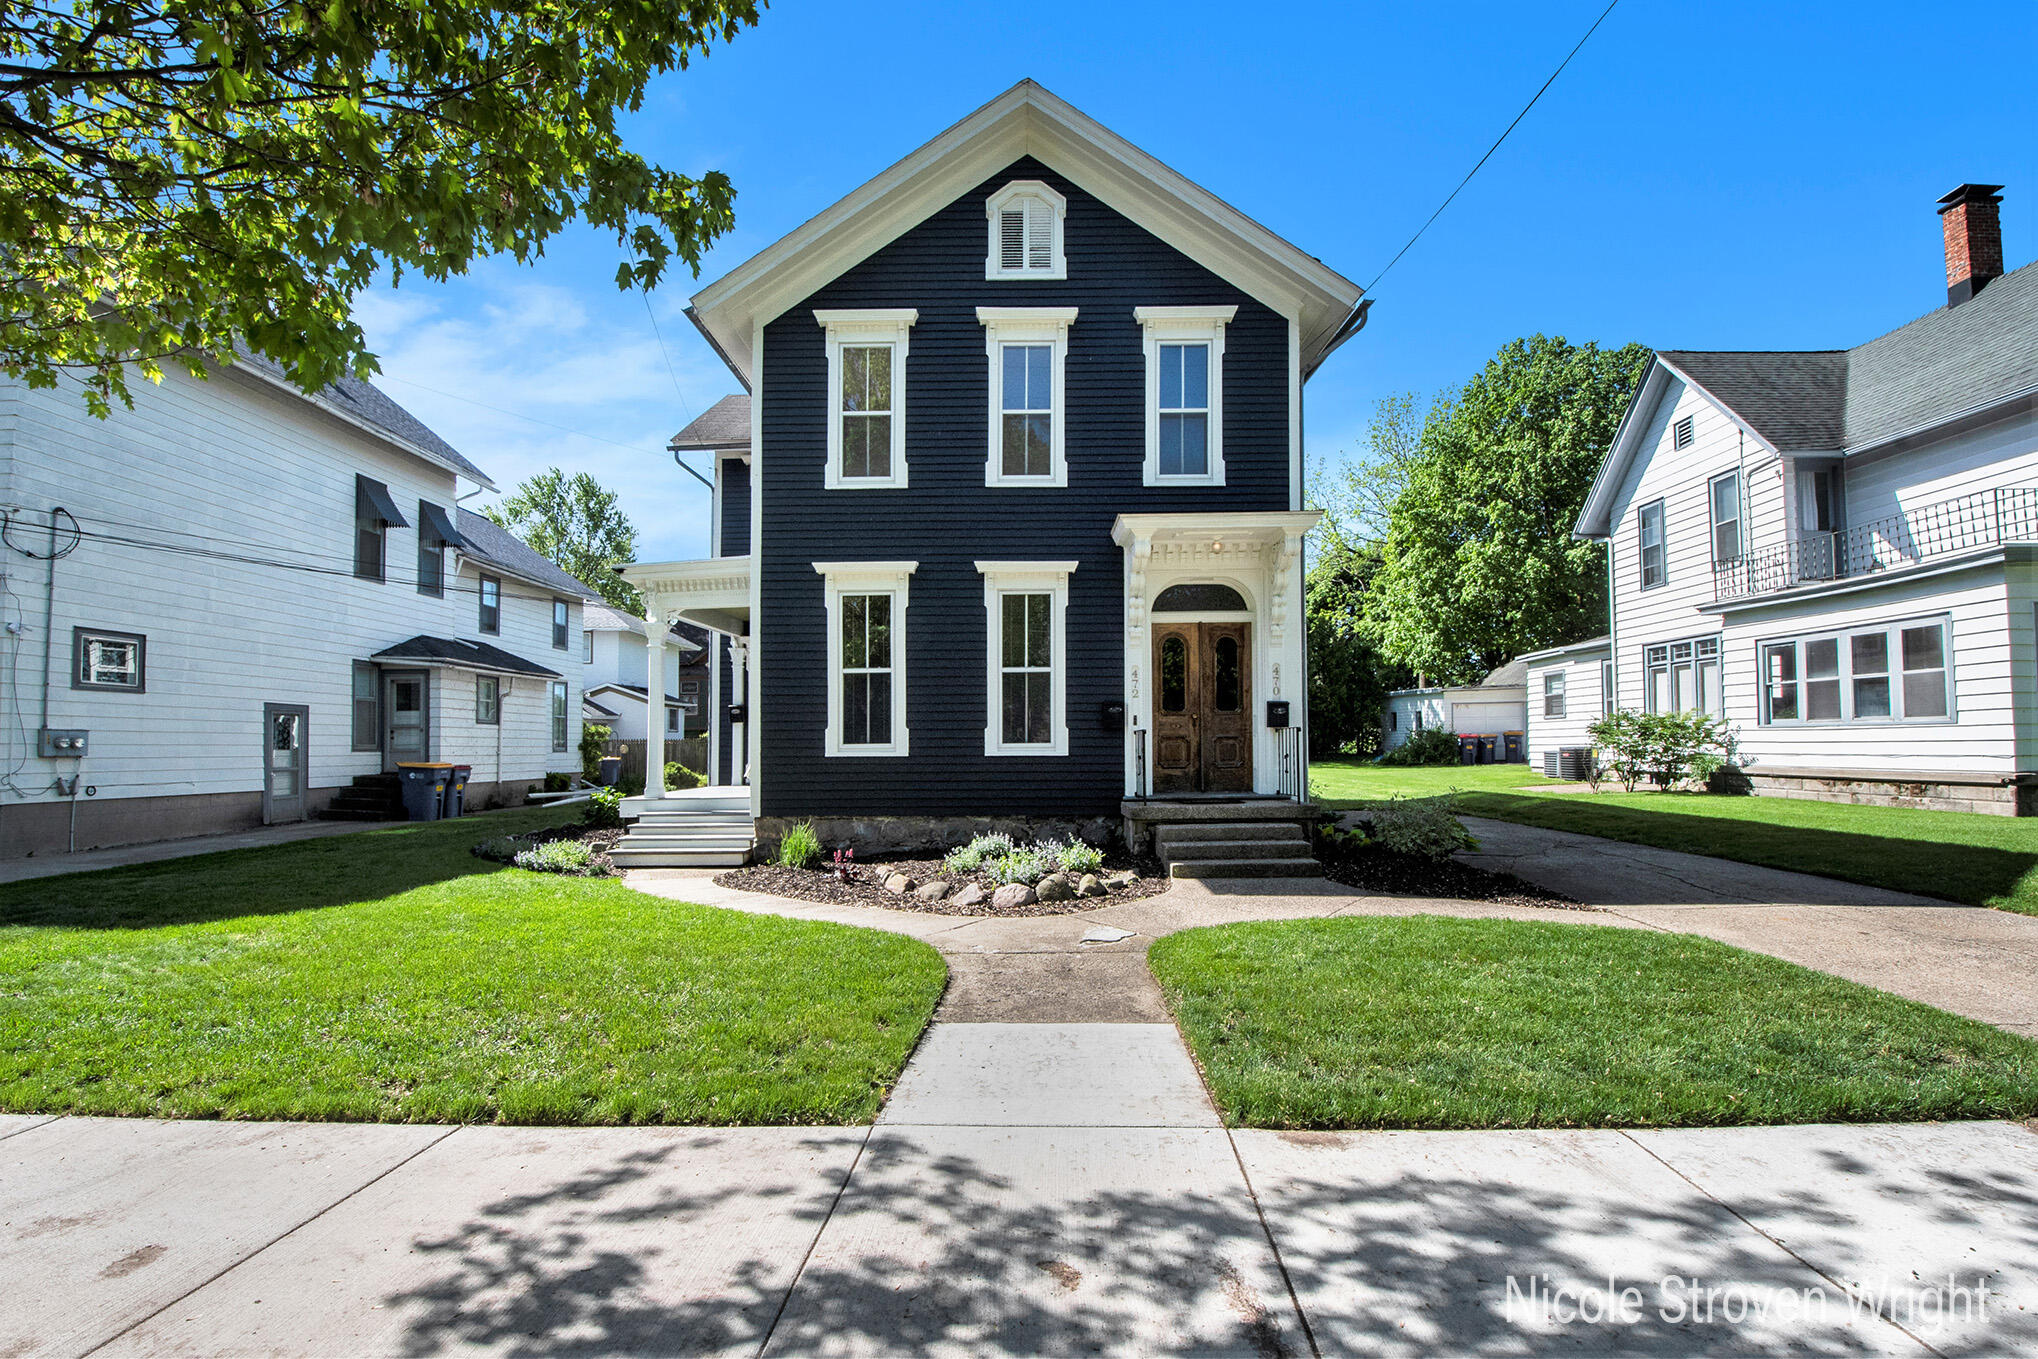
$575,000
bds
|
0
ba
|
0
sqft
|
built
1875
470 Crescent St NE, Grand Rapids, MI 49503
$-1,924
Cash flow
-17.5%
Cash-on-Cash Return
2.1%
Cap rate
0.3%
Rent to Value Ratio
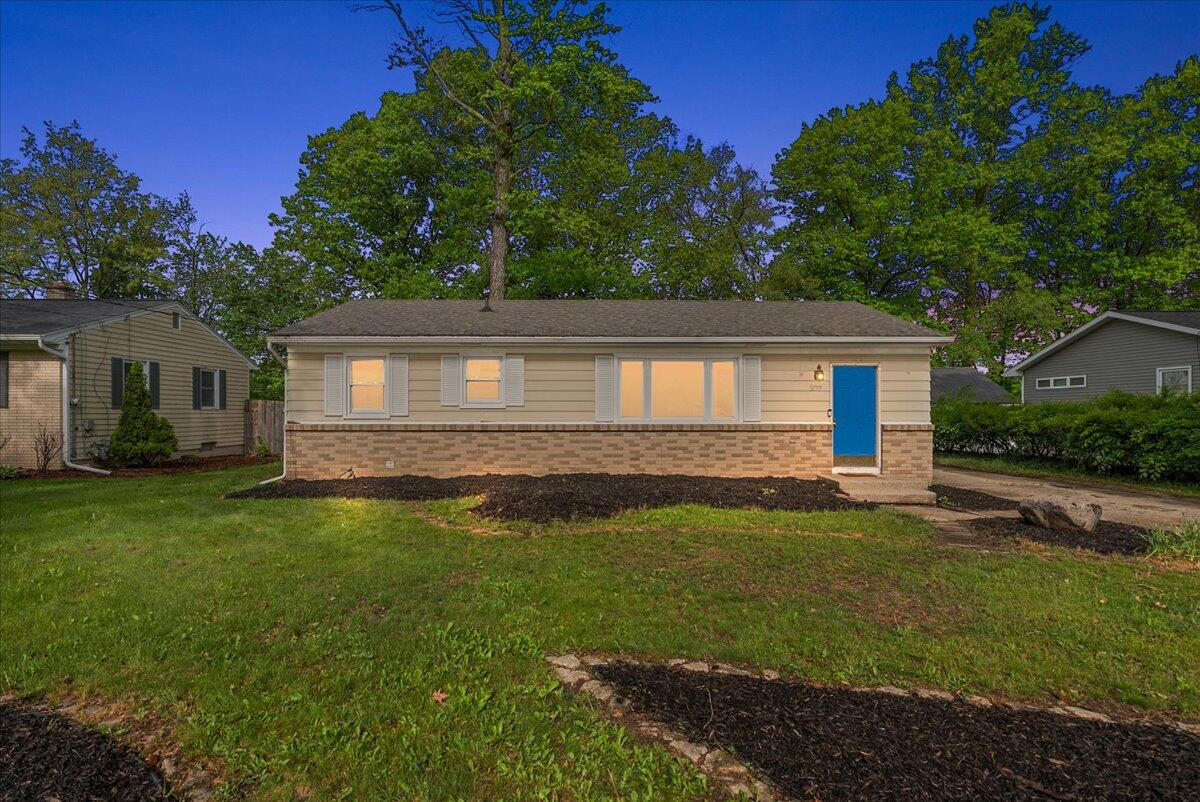
Active
$315,000
4
bds
|
2
ba
|
1,805
sqft
|
built
1964
5759 Blaine Ave SE, Kentwood, MI 49508
$-518
Cash flow
-8.6%
Cash-on-Cash Return
4.2%
Cap rate
0.7%
Rent to Value Ratio
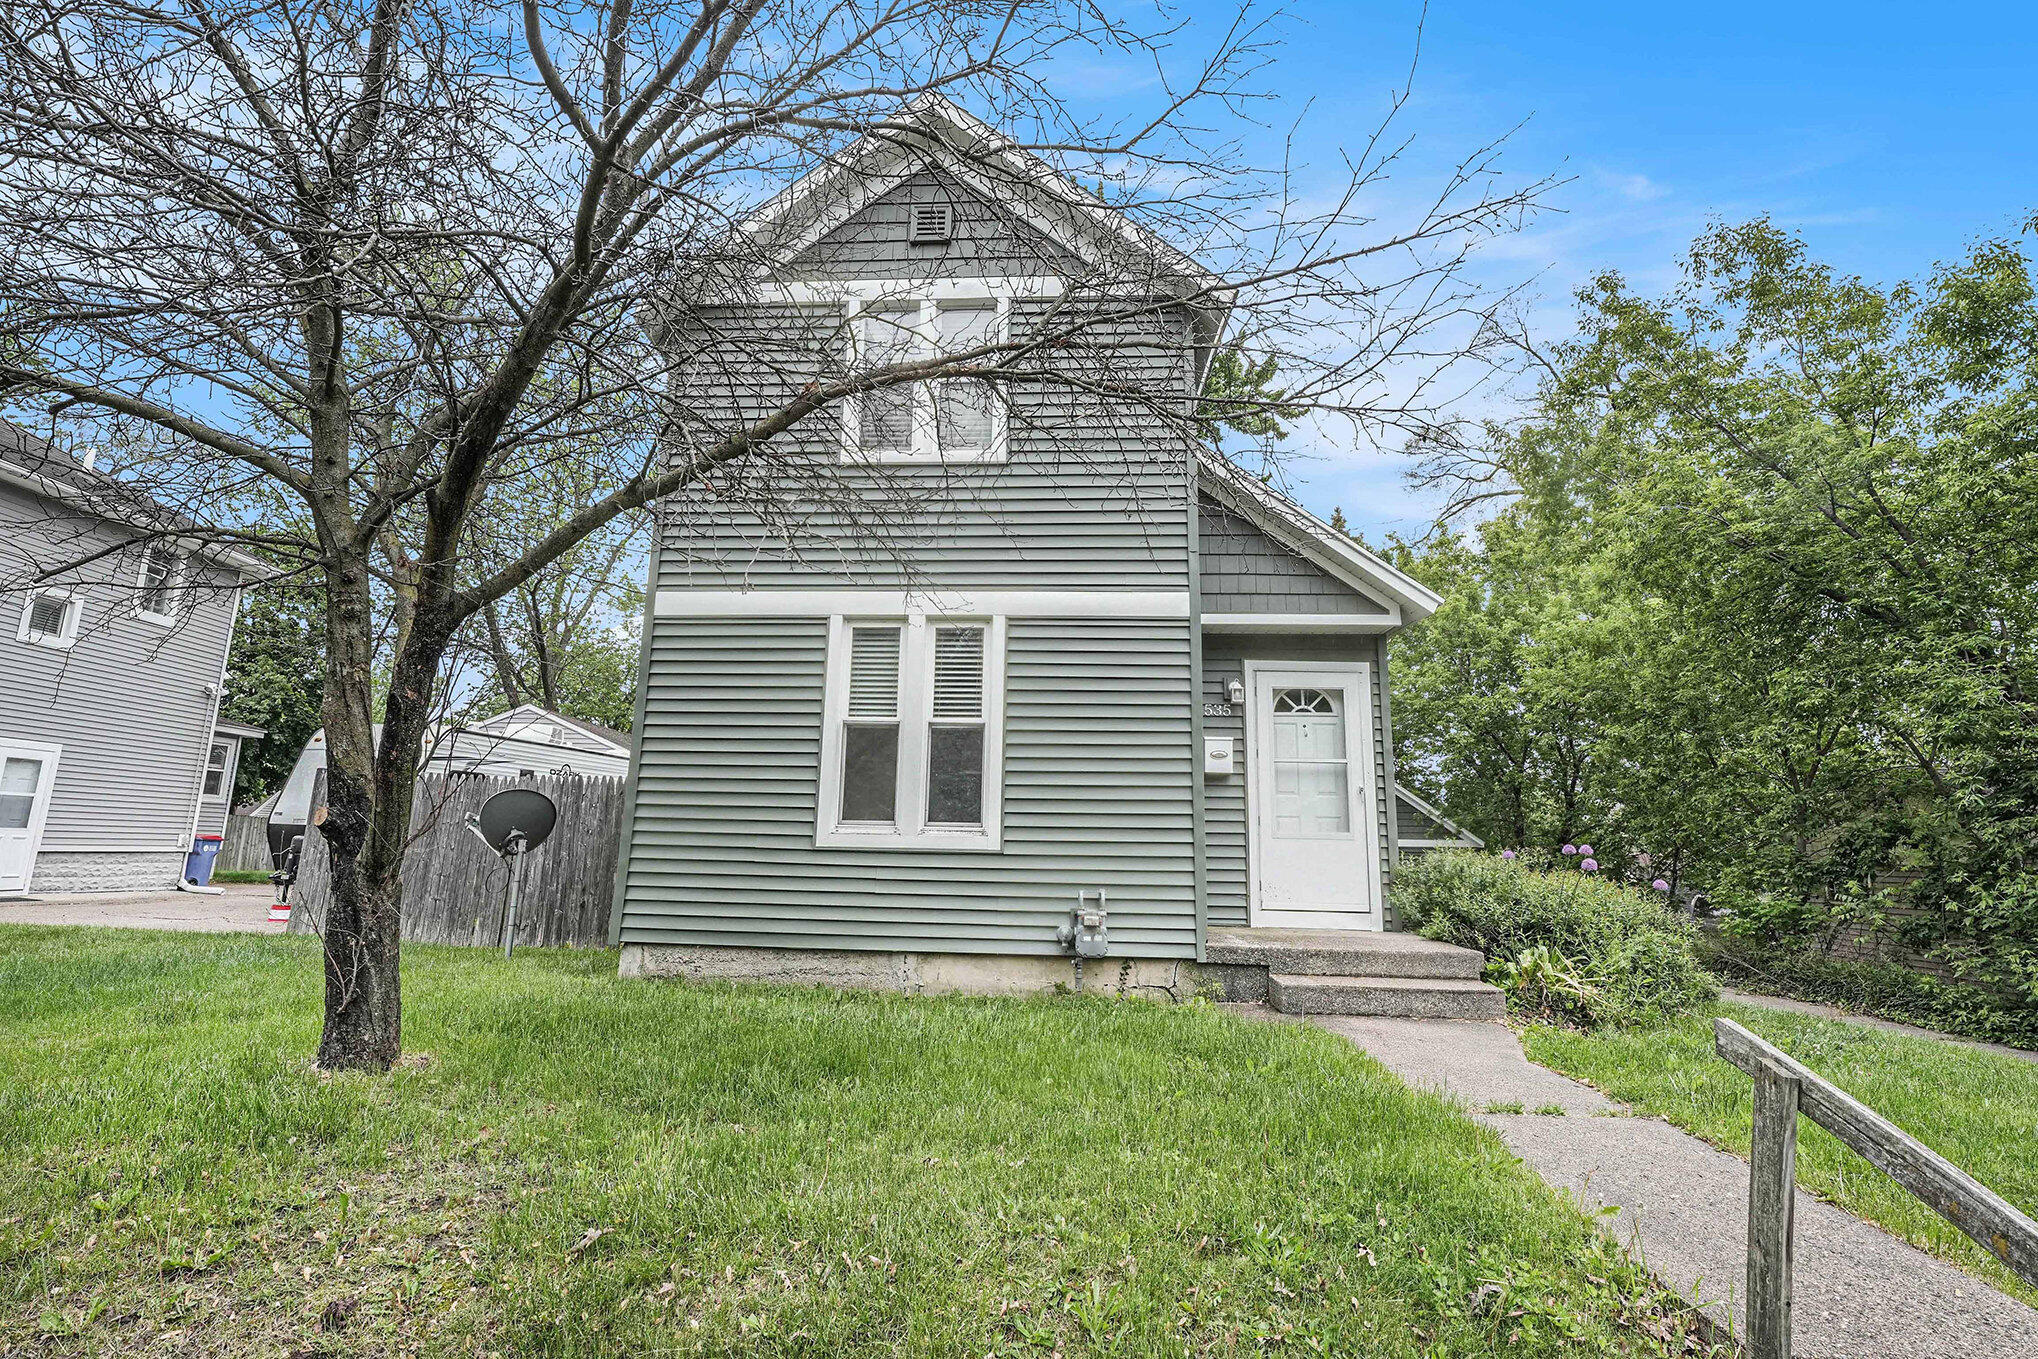
Pending
$239,900
3
bds
|
2
ba
|
1,208
sqft
|
built
1897
1535 Colorado Ave SE, Grand Rapids, MI 49507
$-55
Cash flow
-1.2%
Cash-on-Cash Return
5.9%
Cap rate
0.8%
Rent to Value Ratio
Active
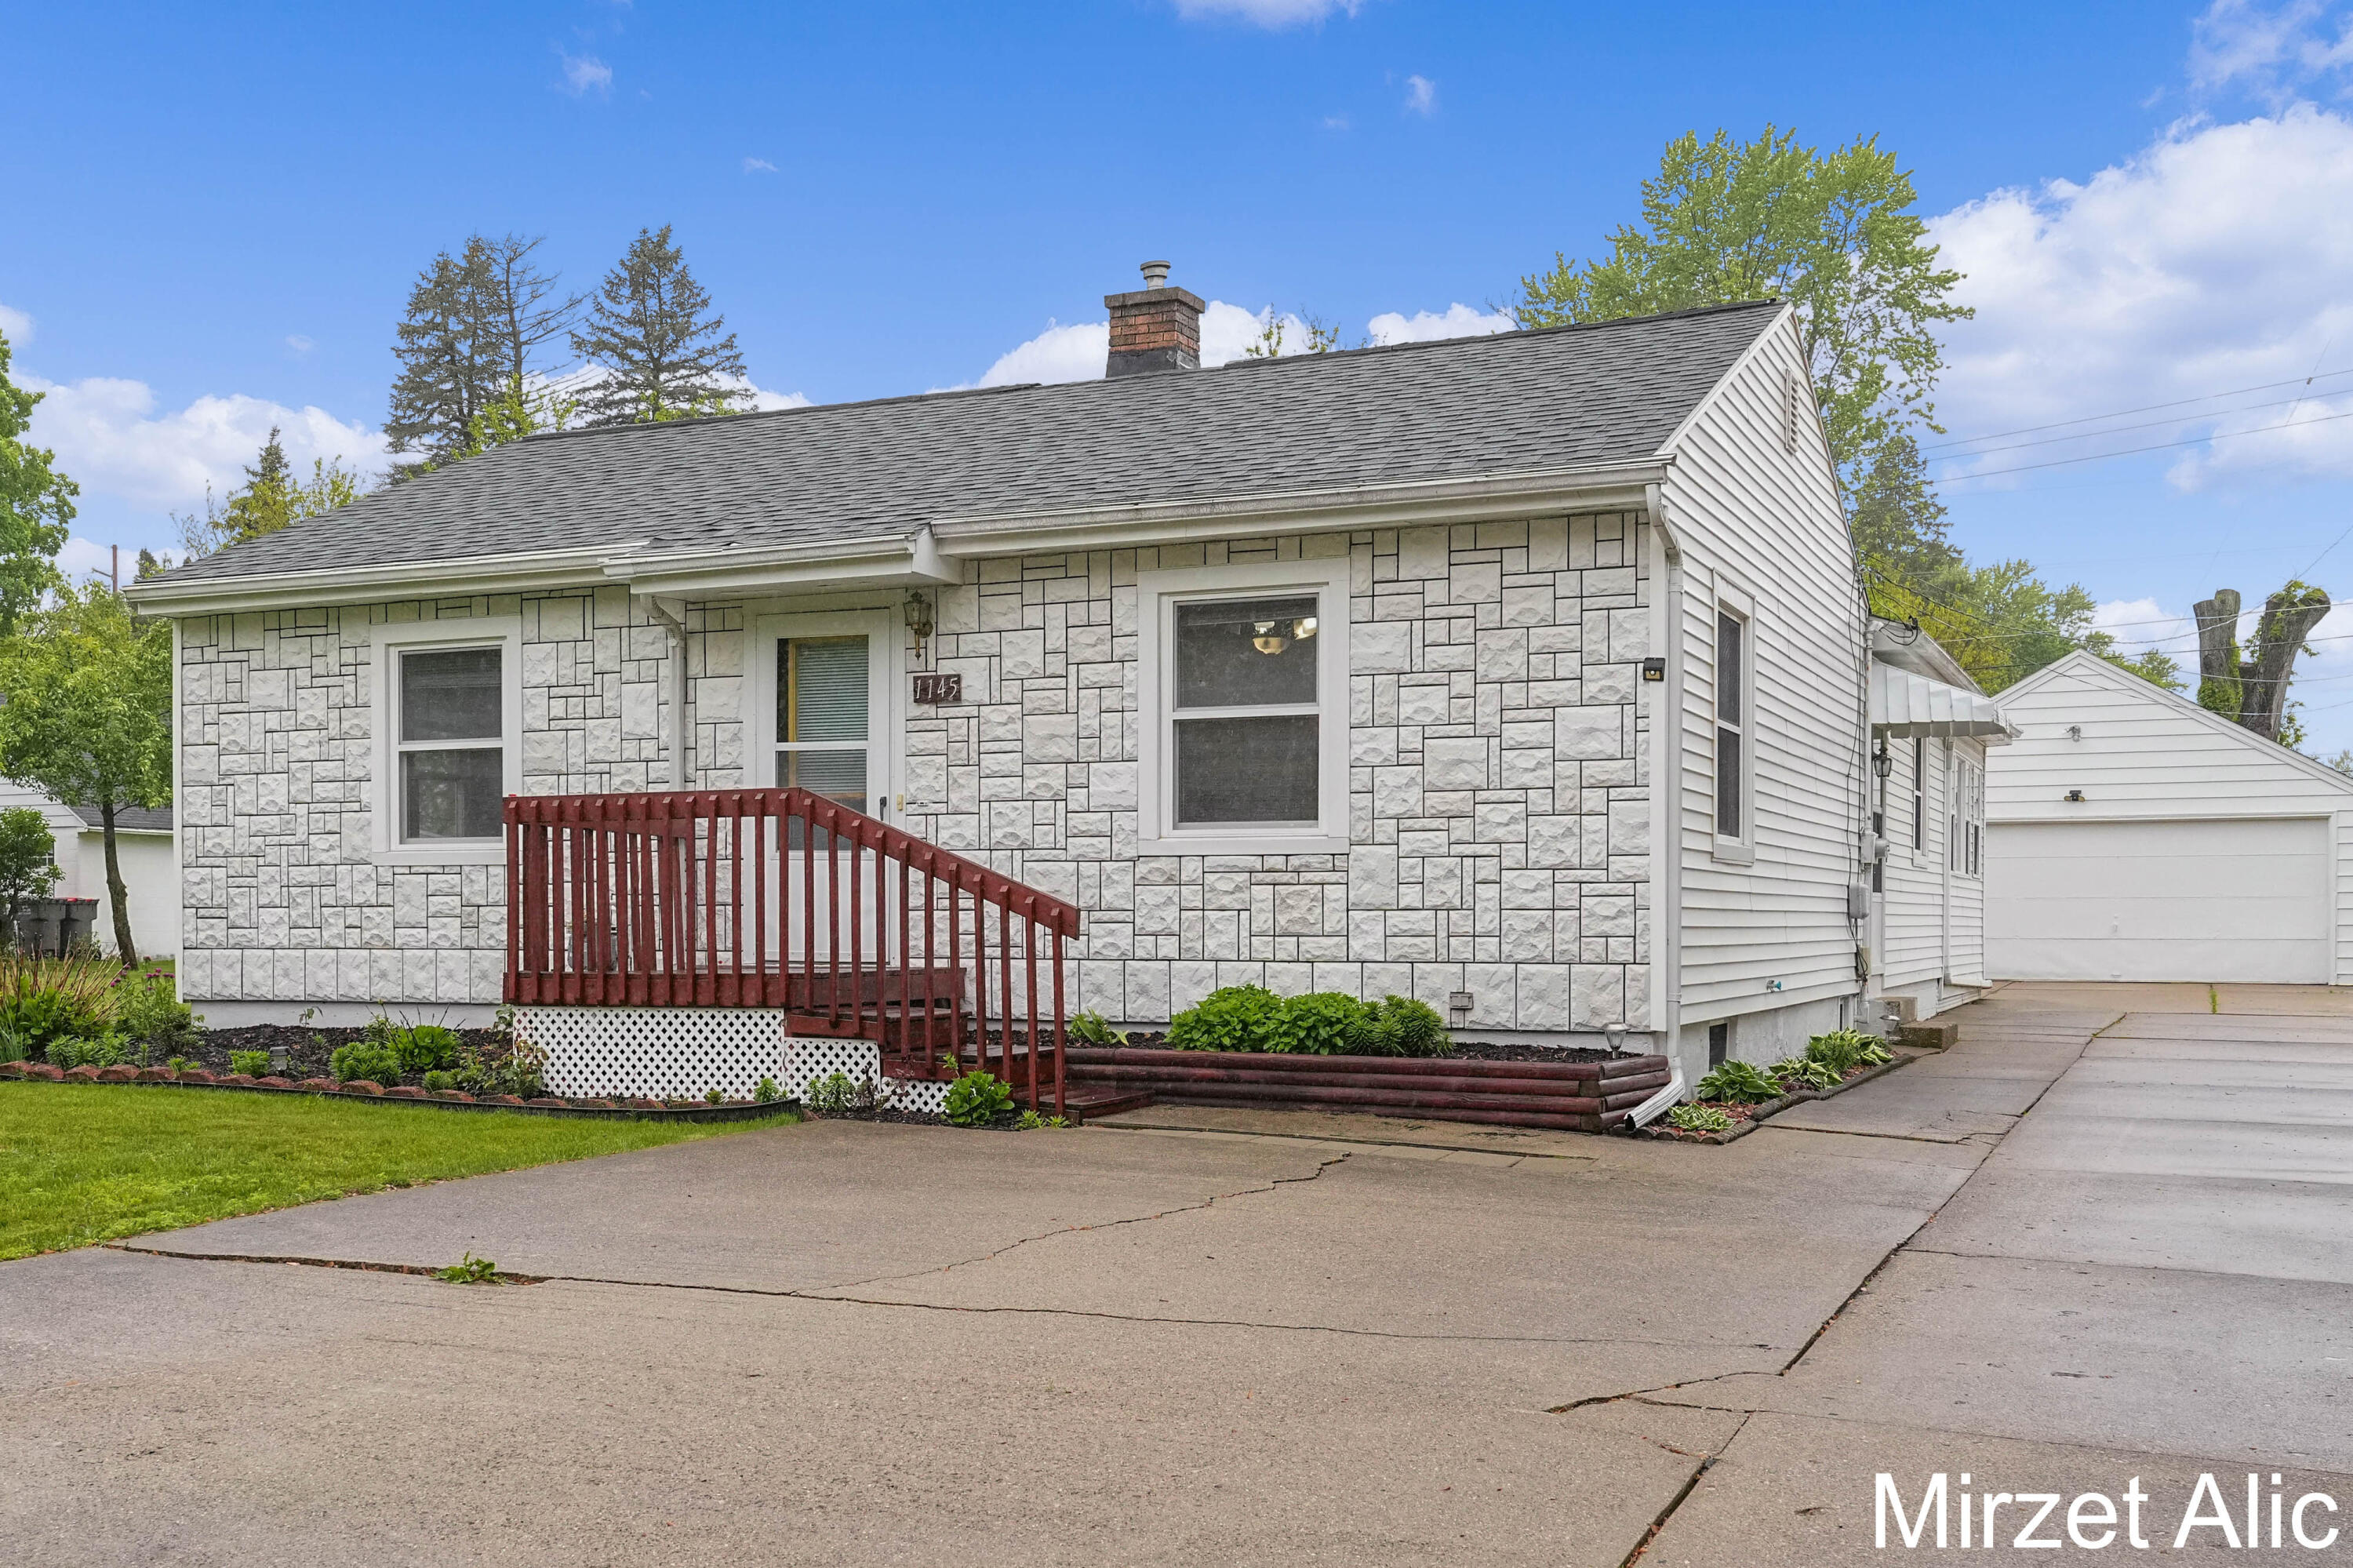
$525,000
4
bds
|
3
ba
|
2,068
sqft
|
built
1950
1145 Eastmont Dr SE, Grand Rapids, MI 49546
$-1,134
Cash flow
-11.3%
Cash-on-Cash Return
3.6%
Cap rate
0.5%
Rent to Value Ratio

Active
$454,900
3
bds
|
2
ba
|
1,484
sqft
|
built
1947
2052 Gorham Dr SE, Grand Rapids, MI 49506
$-1,034
Cash flow
-11.9%
Cash-on-Cash Return
3.4%
Cap rate
0.6%
Rent to Value Ratio

Active
$524,900
5
bds
|
4
ba
|
2,702
sqft
|
built
1994
5348 Cristo Dr NE, Rockford, MI 49341
$-884
Cash flow
-8.8%
Cash-on-Cash Return
4.1%
Cap rate
0.6%
Rent to Value Ratio
Active
$674,900
5
bds
|
4
ba
|
3,509
sqft
|
built
1997
9953 10 Mile Rd NE, Rockford, MI 49341
$-2,062
Cash flow
-15.9%
Cash-on-Cash Return
2.5%
Cap rate
0.4%
Rent to Value Ratio
Active
$465,000
2
bds
|
2
ba
|
1,311
sqft
|
built
1990
33 Campau Cir NW, Grand Rapids, MI 49503
$-2,051
Cash flow
-23.0%
Cash-on-Cash Return
0.9%
Cap rate
0.7%
Rent to Value Ratio
Active
$425,000
4
bds
|
2
ba
|
1,945
sqft
|
built
1908
11087 Phelps Ave, Sparta, MI 49345
$-446
Cash flow
-5.5%
Cash-on-Cash Return
4.9%
Cap rate
0.7%
Rent to Value Ratio
Active
$309,900
3
bds
|
2
ba
|
1,100
sqft
|
built
1964
12110 Edgerton Ave, Cedar Springs, MI 49319
$-285
Cash flow
-4.8%
Cash-on-Cash Return
5.0%
Cap rate
0.7%
Rent to Value Ratio
Pending
$635,000
3
bds
|
3
ba
|
3,094
sqft
|
built
1999
2176 Teal Ct SE, Grand Rapids, MI 49546
$-2,255
Cash flow
-18.5%
Cash-on-Cash Return
1.9%
Cap rate
0.5%
Rent to Value Ratio
Active
$425,000
2
bds
|
2
ba
|
1,061
sqft
|
built
1915
27 Library St NE, Grand Rapids, MI 49503
$-1,225
Cash flow
-15.0%
Cash-on-Cash Return
2.7%
Cap rate
0.7%
Rent to Value Ratio

Active
$585,000
3
bds
|
3
ba
|
3,086
sqft
|
built
2007
7708 Stations Dr SW, Byron Center, MI 49315
$-1,909
Cash flow
-17.0%
Cash-on-Cash Return
2.2%
Cap rate
0.5%
Rent to Value Ratio

Pending
$295,000
1
bds
|
2
ba
|
829
sqft
|
built
2024
633 Fairview Ave NE, Grand Rapids, MI 49503
$-1,078
Cash flow
-19.1%
Cash-on-Cash Return
1.8%
Cap rate
0.5%
Rent to Value Ratio
Active
$405,000
3
bds
|
3
ba
|
2,509
sqft
|
built
1985
3051 Lantana Ct SE, Kentwood, MI 49512
$-578
Cash flow
-7.4%
Cash-on-Cash Return
4.4%
Cap rate
0.7%
Rent to Value Ratio

Active
$339,000
4
bds
|
3
ba
|
2,068
sqft
|
built
1956
756 66th St SE, Grand Rapids, MI 49548
$-328
Cash flow
-5.0%
Cash-on-Cash Return
5.0%
Cap rate
0.6%
Rent to Value Ratio
Active
$129,900
2
bds
|
1
ba
|
806
sqft
|
built
1912
427 Highland St SE, Grand Rapids, MI 49507
$258
Cash flow
10.4%
Cash-on-Cash Return
8.5%
Cap rate
1.1%
Rent to Value Ratio
Active
$975,000
5
bds
|
5
ba
|
4,371
sqft
|
built
2021
8182 Country Rail Dr SW, Byron Center, MI 49315
$-4,414
Cash flow
-23.6%
Cash-on-Cash Return
0.7%
Cap rate
0.2%
Rent to Value Ratio