Kent County Investment Properties for Sale
Browse homes for sale and investment properties in Kent County. Refine your search by price, property type, or more.
Best cash flowing properties in Kent County

Active
$239,900
bds
|
0
ba
|
0
sqft
|
built
1925
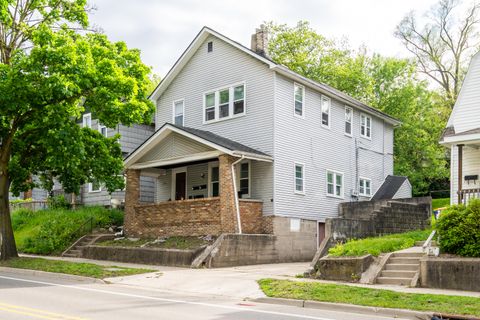
1300 Cass Ave SE, Grand Rapids, MI 49507
$-15
Cash flow
-0.3%
Cash-on-Cash Return
6.2%
Cap rate
0.8%
Rent to Value Ratio
Active
$259,900
bds
|
0
ba
|
0
sqft
|
built
1885
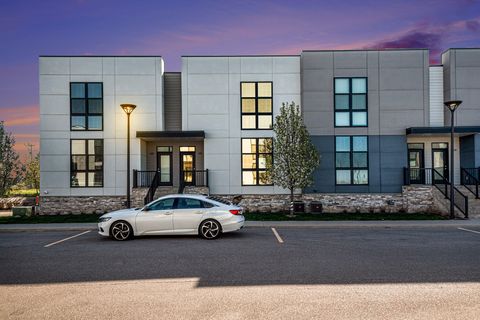
1154 Jefferson Ave SE, Grand Rapids, MI 49507
$-51
Cash flow
-1.0%
Cash-on-Cash Return
6.0%
Cap rate
0.8%
Rent to Value Ratio
421 out of 666 properties for sale in Kent County
Limited Results Shown
Create a free account, or log in to reveal all property listings and enjoy the complete experience.
Active
$579,900
4
bds
|
3
ba
|
2,468
sqft
|
built
1986
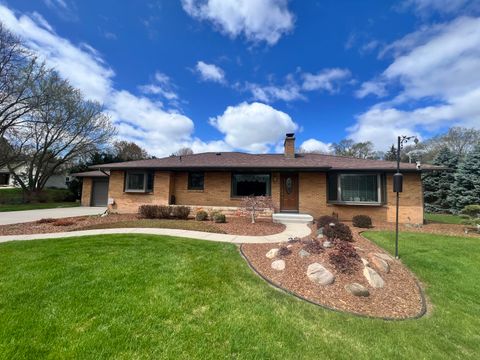
4470 Peach Ridge Ave NW, Grand Rapids, MI 49544
$-1,213
Cash flow
-10.9%
Cash-on-Cash Return
3.8%
Cap rate
0.5%
Rent to Value Ratio
Active
$235,000
3
bds
|
2
ba
|
1,820
sqft
|
built
1915
26 Banner St SW, Grand Rapids, MI 49507
$-85
Cash flow
-1.9%
Cash-on-Cash Return
5.8%
Cap rate
0.9%
Rent to Value Ratio
Active
$384,900
bds
|
0
ba
|
0
sqft
|
built
1890
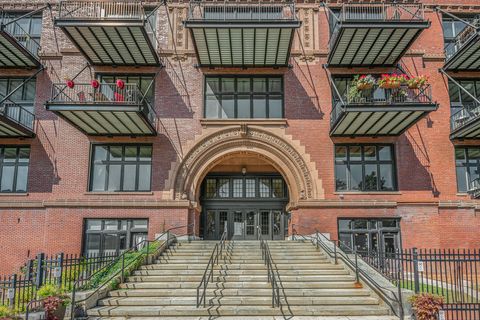
232 Oakley Pl NE, Grand Rapids, MI 49503
$-1,171
Cash flow
-15.9%
Cash-on-Cash Return
2.6%
Cap rate
0.5%
Rent to Value Ratio

Active
$550,000
5
bds
|
4
ba
|
2,696
sqft
|
built
2002
4160 Knapp Valley Dr NE, Grand Rapids, MI 49525
$-1,123
Cash flow
-10.7%
Cash-on-Cash Return
3.8%
Cap rate
0.6%
Rent to Value Ratio
Active
$497,500
4
bds
|
4
ba
|
2,971
sqft
|
built
1996
2658 Golfridge Dr SE, Grand Rapids, MI 49546
$-930
Cash flow
-9.8%
Cash-on-Cash Return
4.0%
Cap rate
0.6%
Rent to Value Ratio
Active
$250,000
2
bds
|
2
ba
|
806
sqft
|
built
2014
600 Douglas St NW, Grand Rapids, MI 49504
$-742
Cash flow
-15.5%
Cash-on-Cash Return
2.7%
Cap rate
0.9%
Rent to Value Ratio
Active
$379,900
4
bds
|
3
ba
|
2,320
sqft
|
built
1953
4175 Huntington Ave NE, Grand Rapids, MI 49525
$-516
Cash flow
-7.1%
Cash-on-Cash Return
4.6%
Cap rate
0.7%
Rent to Value Ratio
Active
$259,900
bds
|
0
ba
|
0
sqft
|
built
1885
1154 Jefferson Ave SE, Grand Rapids, MI 49507
$-51
Cash flow
-1.0%
Cash-on-Cash Return
6.0%
Cap rate
0.8%
Rent to Value Ratio

Active
$449,900
4
bds
|
4
ba
|
2,509
sqft
|
built
1991
5540 Koster Dr SW, Wyoming, MI 49418
$-803
Cash flow
-9.3%
Cash-on-Cash Return
4.1%
Cap rate
0.6%
Rent to Value Ratio

Active
$399,900
3
bds
|
2
ba
|
1,608
sqft
|
built
1973
11630 Myers Lake Ave NE, Cedar Springs, MI 49319
$-605
Cash flow
-7.9%
Cash-on-Cash Return
4.5%
Cap rate
0.6%
Rent to Value Ratio

Active
$250,000
2
bds
|
1
ba
|
922
sqft
|
built
1949
505 Cherry St SE, Grand Rapids, MI 49503
$-688
Cash flow
-14.4%
Cash-on-Cash Return
3.0%
Cap rate
0.8%
Rent to Value Ratio
Active
$270,000
4
bds
|
2
ba
|
1,583
sqft
|
built
1948
853 California St NW, Grand Rapids, MI 49504
$-244
Cash flow
-4.7%
Cash-on-Cash Return
5.2%
Cap rate
0.7%
Rent to Value Ratio

Active
$345,000
4
bds
|
2
ba
|
1,896
sqft
|
built
1989
6284 Kuttshill Dr NE, Rockford, MI 49341
$-383
Cash flow
-5.8%
Cash-on-Cash Return
4.9%
Cap rate
0.7%
Rent to Value Ratio
Active
$299,000
bds
|
0
ba
|
0
sqft
|
built
1900
733 Lafayette Ave NE, Grand Rapids, MI 49503
$-700
Cash flow
-12.2%
Cash-on-Cash Return
3.5%
Cap rate
0.7%
Rent to Value Ratio
Active
$324,900
3
bds
|
3
ba
|
1,542
sqft
|
built
2022
6016 Port View Dr SE, Grand Rapids, MI 49512
$-657
Cash flow
-10.6%
Cash-on-Cash Return
3.8%
Cap rate
0.8%
Rent to Value Ratio
Active
$649,900
2
bds
|
3
ba
|
3,232
sqft
|
built
1960
3817 Butterworth St SW, Grand Rapids, MI 49534
$-1,876
Cash flow
-15.1%
Cash-on-Cash Return
2.8%
Cap rate
0.4%
Rent to Value Ratio
Active
$309,900
2
bds
|
1
ba
|
1,110
sqft
|
built
1900
600 Broadway Ave NW, Grand Rapids, MI 49504
$-995
Cash flow
-16.8%
Cash-on-Cash Return
2.4%
Cap rate
0.7%
Rent to Value Ratio

Active
$775,000
4
bds
|
2
ba
|
1,657
sqft
|
built
1931
8779 Je Ne Be Dr NE, Rockford, MI 49341
$-2,463
Cash flow
-16.6%
Cash-on-Cash Return
2.5%
Cap rate
0.5%
Rent to Value Ratio

Active
$679,900
3
bds
|
3
ba
|
1,614
sqft
|
built
2023
1819 Gloryfield Dr SW, Byron Center, MI 49315
$-2,458
Cash flow
-18.9%
Cash-on-Cash Return
1.9%
Cap rate
0.4%
Rent to Value Ratio

Active
$215,975
3
bds
|
1
ba
|
1,255
sqft
|
built
1865
911 Muskegon Ave NW, Grand Rapids, MI 49504
$-215
Cash flow
-5.2%
Cash-on-Cash Return
5.1%
Cap rate
0.8%
Rent to Value Ratio

Active
$239,900
4
bds
|
1
ba
|
1,296
sqft
|
built
1900
258 Ann St NE, Grand Rapids, MI 49505
$-111
Cash flow
-2.4%
Cash-on-Cash Return
5.7%
Cap rate
0.8%
Rent to Value Ratio

Active
$725,000
4
bds
|
4
ba
|
3,487
sqft
|
built
2022
1757 Julienne Ct SW, Byron Center, MI 49315
$-2,194
Cash flow
-15.8%
Cash-on-Cash Return
2.6%
Cap rate
0.5%
Rent to Value Ratio

Active
$639,900
5
bds
|
5
ba
|
5,041
sqft
|
built
1990
7340 Royal Ridge Dr SE, Caledonia, MI 49316
$-1,323
Cash flow
-10.8%
Cash-on-Cash Return
3.8%
Cap rate
0.6%
Rent to Value Ratio

Active
$699,900
4
bds
|
4
ba
|
3,440
sqft
|
built
2014
1506 Providence Cove Ct, Byron Center, MI 49315
$-1,689
Cash flow
-12.6%
Cash-on-Cash Return
3.4%
Cap rate
0.6%
Rent to Value Ratio

Active
$950,000
6
bds
|
4
ba
|
4,319
sqft
|
built
2001
7701 Sunset Ct SE, Caledonia, MI 49316
$-2,775
Cash flow
-15.2%
Cash-on-Cash Return
2.8%
Cap rate
0.4%
Rent to Value Ratio

Active
$219,000
1
bds
|
1
ba
|
926
sqft
|
built
1995
157 Hunters Ln NE, Rockford, MI 49341
$-426
Cash flow
-10.1%
Cash-on-Cash Return
3.9%
Cap rate
0.7%
Rent to Value Ratio

Active
$699,900
4
bds
|
3
ba
|
2,746
sqft
|
built
2022
1130 Haven Dr SE, Byron Center, MI 49315
$-3,065
Cash flow
-22.8%
Cash-on-Cash Return
1.0%
Cap rate
0.3%
Rent to Value Ratio

Active
$300,000
3
bds
|
2
ba
|
1,600
sqft
|
built
1900
912 Arianna St NW, Grand Rapids, MI 49504
$-598
Cash flow
-10.4%
Cash-on-Cash Return
3.9%
Cap rate
0.6%
Rent to Value Ratio

Active
$227,900
2
bds
|
2
ba
|
929
sqft
|
built
1967
2463 Abbington Dr SE, Grand Rapids, MI 49506
$-389
Cash flow
-8.9%
Cash-on-Cash Return
4.2%
Cap rate
0.8%
Rent to Value Ratio
Active
$450,000
4
bds
|
2
ba
|
1,392
sqft
|
built
1960
9555 Eastern Ave SE, Byron Center, MI 49315
$-927
Cash flow
-10.7%
Cash-on-Cash Return
3.8%
Cap rate
0.5%
Rent to Value Ratio
Active
$239,900
bds
|
0
ba
|
0
sqft
|
built
1925
1300 Cass Ave SE, Grand Rapids, MI 49507
$-15
Cash flow
-0.3%
Cash-on-Cash Return
6.2%
Cap rate
0.8%
Rent to Value Ratio

Active
$459,000
4
bds
|
3
ba
|
2,341
sqft
|
built
1997
2511 Bowenton Pl SW, Wyoming, MI 49519
$-849
Cash flow
-9.7%
Cash-on-Cash Return
4.0%
Cap rate
0.6%
Rent to Value Ratio

Active
$319,900
3
bds
|
2
ba
|
1,387
sqft
|
built
1999
313 Pioneer Trl, Cedar Springs, MI 49319
$-460
Cash flow
-7.5%
Cash-on-Cash Return
4.5%
Cap rate
0.7%
Rent to Value Ratio

Active
$299,000
4
bds
|
2
ba
|
1,805
sqft
|
built
1964
5759 Blaine Ave SE, Kentwood, MI 49508
$-465
Cash flow
-8.1%
Cash-on-Cash Return
4.4%
Cap rate
0.7%
Rent to Value Ratio

Active
$575,000
bds
|
0
ba
|
0
sqft
|
built
1875
470 Crescent St NE, Grand Rapids, MI 49503
$-1,981
Cash flow
-18.0%
Cash-on-Cash Return
2.1%
Cap rate
0.3%
Rent to Value Ratio

Active
$699,000
2
bds
|
3
ba
|
4,324
sqft
|
built
1953
1710 Kreft St NE, Grand Rapids, MI 49525
$-268
Cash flow
-2.0%
Cash-on-Cash Return
5.8%
Cap rate
0.7%
Rent to Value Ratio

Active
$950,000
6
bds
|
4
ba
|
4,096
sqft
|
built
1880
455 Madison Ave SE, Grand Rapids, MI 49503
$-3,058
Cash flow
-16.8%
Cash-on-Cash Return
2.4%
Cap rate
0.4%
Rent to Value Ratio

Active
$524,900
3
bds
|
2
ba
|
2,554
sqft
|
built
1948
2120 Englewood Dr SE, Grand Rapids, MI 49506
$-1,257
Cash flow
-12.5%
Cash-on-Cash Return
3.4%
Cap rate
0.6%
Rent to Value Ratio

Active
$525,000
4
bds
|
3
ba
|
2,068
sqft
|
built
1950
1145 Eastmont Dr SE, Grand Rapids, MI 49546
$-1,186
Cash flow
-11.8%
Cash-on-Cash Return
3.6%
Cap rate
0.5%
Rent to Value Ratio

Active
$454,900
3
bds
|
2
ba
|
1,484
sqft
|
built
1947
2052 Gorham Dr SE, Grand Rapids, MI 49506
$-1,079
Cash flow
-12.4%
Cash-on-Cash Return
3.4%
Cap rate
0.6%
Rent to Value Ratio