Macomb County Investment Properties for Sale
Browse homes for sale and investment properties in Macomb County. Refine your search by price, property type, or more.
Best cash flowing properties in Macomb County
Active
$110,000
2
bds
|
1
ba
|
1,638
sqft
|
built
1950
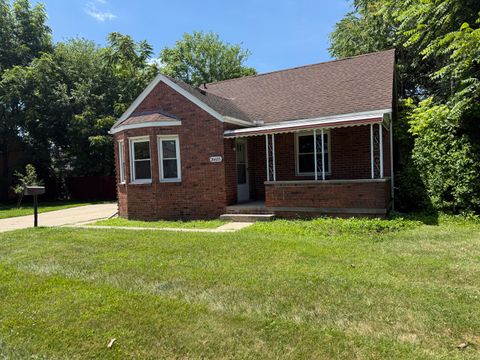
7551 Hudson Ave, Warren, MI 48091
$342
Cash flow
16.2%
Cash-on-Cash Return
9.9%
Cap rate
1.5%
Rent to Value Ratio

Active
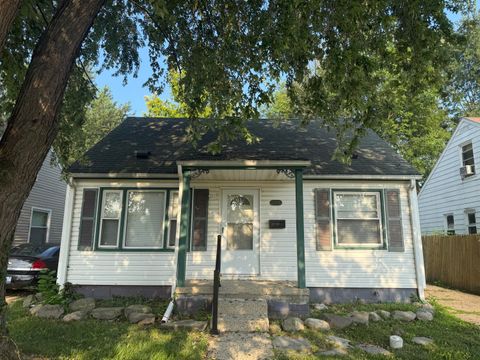
$90,000
3
bds
|
1
ba
|
922
sqft
|
built
1940
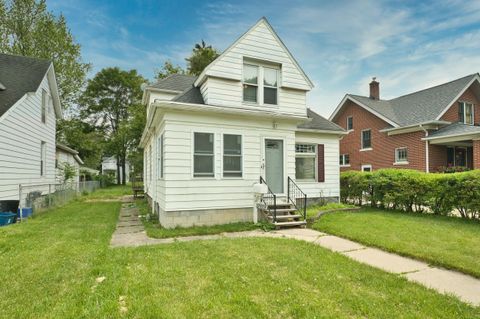
21706 Rausch Ave, Eastpointe, MI 48021
$339
Cash flow
19.7%
Cash-on-Cash Return
10.7%
Cap rate
1.6%
Rent to Value Ratio
30 out of 42 properties for sale in Macomb County
Limited Results Shown
Create a free account, or log in to reveal all property listings and enjoy the complete experience.
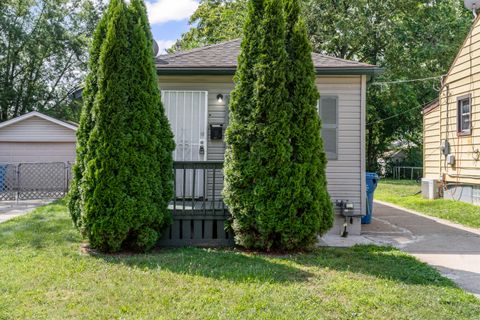
Active
$82,500
2
bds
|
1
ba
|
696
sqft
|
built
1953
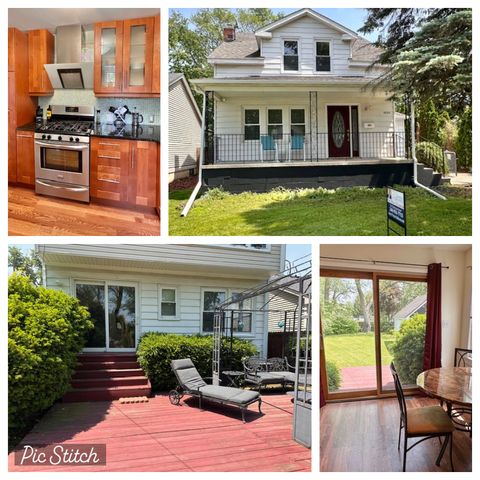
13407 Sherman Ave, Warren, MI 48089
$296
Cash flow
18.7%
Cash-on-Cash Return
10.5%
Cap rate
1.5%
Rent to Value Ratio
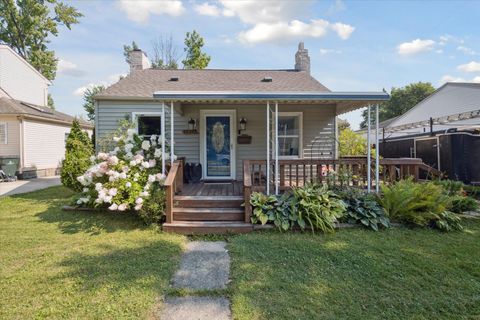
Active
$179,900
4
bds
|
2
ba
|
2,002
sqft
|
built
1969
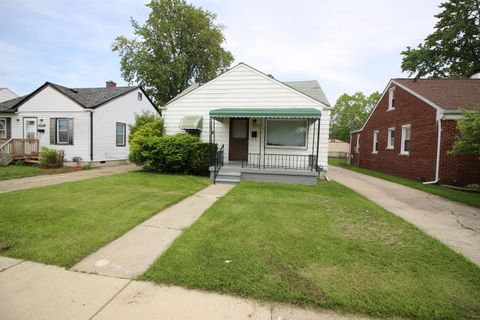
8268 Essex Ave, Warren, MI 48089
$-62
Cash flow
-1.8%
Cash-on-Cash Return
5.7%
Cap rate
0.8%
Rent to Value Ratio
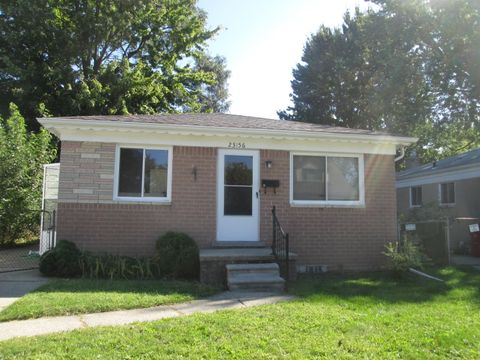
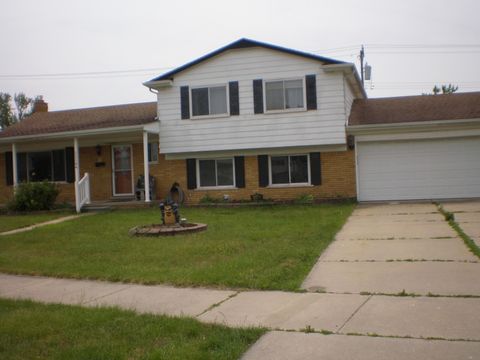
Active
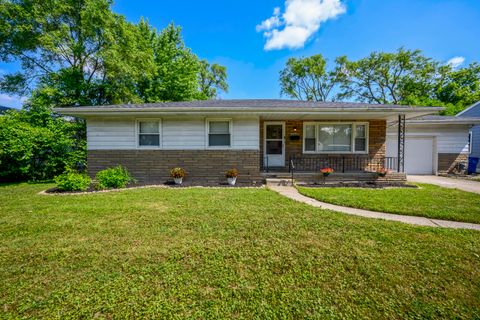
$115,000
3
bds
|
1
ba
|
893
sqft
|
built
1971
23156 Donald Ave, Eastpointe, MI 48021
$80
Cash flow
3.6%
Cash-on-Cash Return
7.0%
Cap rate
1.2%
Rent to Value Ratio
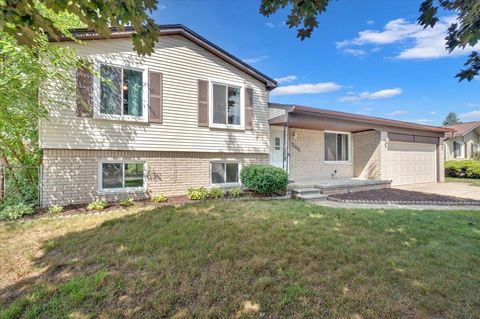
Active
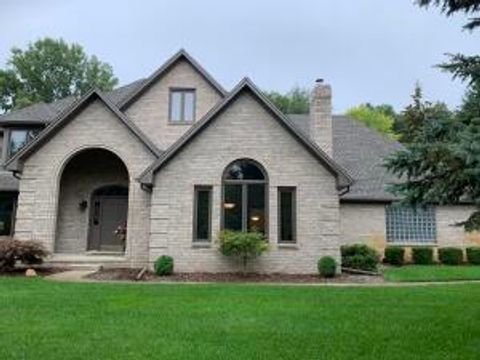
$895,000
4
bds
|
5
ba
|
5,894
sqft
|
built
1992
2032 Dean Dr, Washington, MI 48094
$-2,450
Cash flow
-14.3%
Cash-on-Cash Return
2.9%
Cap rate
0.4%
Rent to Value Ratio
Active
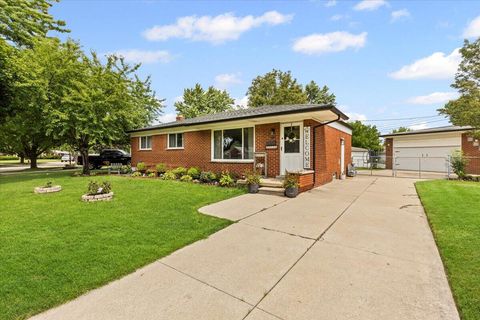
$125,000
3
bds
|
1
ba
|
1,124
sqft
|
built
1953
22436 Cushing Ave, Eastpointe, MI 48021
$-64
Cash flow
-2.7%
Cash-on-Cash Return
5.5%
Cap rate
1.1%
Rent to Value Ratio
Active
$290,000
3
bds
|
2
ba
|
1,030
sqft
|
built
1960
29266 Moulin Ave, Warren, MI 48088
$-554
Cash flow
-10.0%
Cash-on-Cash Return
3.9%
Cap rate
0.7%
Rent to Value Ratio
Active
$149,000
3
bds
|
2
ba
|
0
sqft
|
built
1960
11245 Maxwell Ave, Warren, MI 48089
$205
Cash flow
7.2%
Cash-on-Cash Return
7.8%
Cap rate
1.1%
Rent to Value Ratio
Active
$86,900
3
bds
|
1
ba
|
700
sqft
|
built
1938
11036 Republic Ave, Warren, MI 48089
$286
Cash flow
17.2%
Cash-on-Cash Return
10.1%
Cap rate
1.4%
Rent to Value Ratio
Active
$160,000
2
bds
|
1
ba
|
829
sqft
|
built
1946
22225 Lange St, Saint Clair Shores, MI 48080
$68
Cash flow
2.2%
Cash-on-Cash Return
6.7%
Cap rate
0.9%
Rent to Value Ratio
Active
$258,800
5
bds
|
4
ba
|
1,991
sqft
|
built
1962
11104 Irene Ave, Warren, MI 48093
$-217
Cash flow
-4.4%
Cash-on-Cash Return
5.1%
Cap rate
0.9%
Rent to Value Ratio
Active
$274,900
4
bds
|
2
ba
|
1,619
sqft
|
built
1978
29205 E Nottingham Cir, Warren, MI 48092
$-297
Cash flow
-5.6%
Cash-on-Cash Return
4.8%
Cap rate
0.8%
Rent to Value Ratio
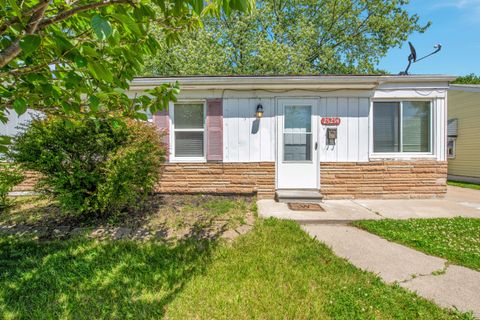
Active
$146,900
3
bds
|
1
ba
|
895
sqft
|
built
1950
25294 Wiseman St, Roseville, MI 48066
$38
Cash flow
1.3%
Cash-on-Cash Return
6.5%
Cap rate
1.0%
Rent to Value Ratio
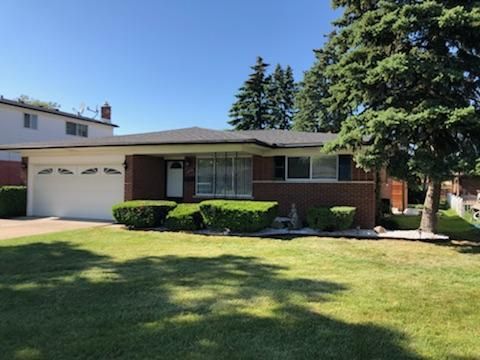
Active
$319,900
3
bds
|
2
ba
|
1,436
sqft
|
built
1967
11053 Lorman Dr, Sterling Heights, MI 48312
$-630
Cash flow
-10.3%
Cash-on-Cash Return
3.8%
Cap rate
0.7%
Rent to Value Ratio
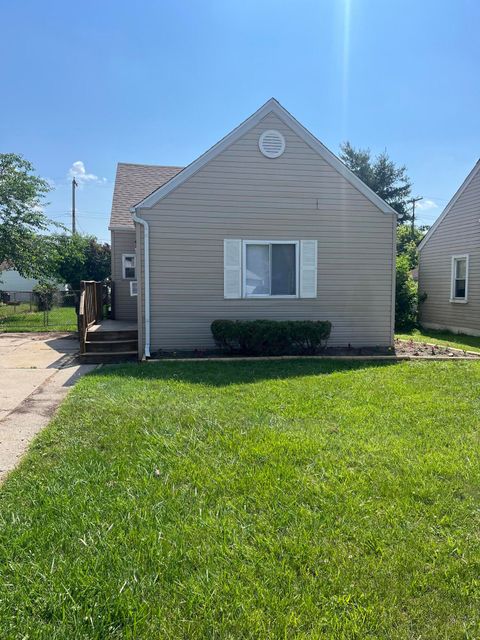
Active
$159,000
2
bds
|
1
ba
|
1,500
sqft
|
built
1940
25230 Ford St, Roseville, MI 48066
$27
Cash flow
0.9%
Cash-on-Cash Return
6.3%
Cap rate
0.9%
Rent to Value Ratio
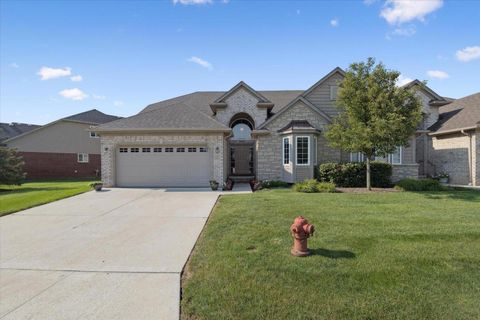
Active
$377,000
3
bds
|
3
ba
|
1,587
sqft
|
built
2016
30466 Berghway Trl, Warren, MI 48092
$-600
Cash flow
-8.3%
Cash-on-Cash Return
4.2%
Cap rate
0.6%
Rent to Value Ratio
Active
$189,900
3
bds
|
1
ba
|
1,666
sqft
|
built
1946
26655 Rosewood St, Roseville, MI 48066
$-195
Cash flow
-5.4%
Cash-on-Cash Return
4.9%
Cap rate
0.8%
Rent to Value Ratio
Active
$184,000
4
bds
|
2
ba
|
1,642
sqft
|
built
1920
269 Euclid St, Mount Clemens, MI 48043
$-593
Cash flow
-16.8%
Cash-on-Cash Return
2.3%
Cap rate
0.8%
Rent to Value Ratio
Active
$254,500
3
bds
|
2
ba
|
1,466
sqft
|
built
1927
26314 E St, Saint Clair Shores, MI 48081
$89
Cash flow
1.8%
Cash-on-Cash Return
6.6%
Cap rate
0.9%
Rent to Value Ratio
Active
$110,000
3
bds
|
1
ba
|
1,092
sqft
|
built
1949
24648 Wilmot Ave, Eastpointe, MI 48021
$137
Cash flow
6.5%
Cash-on-Cash Return
7.6%
Cap rate
1.3%
Rent to Value Ratio
Active
$95,000
2
bds
|
1
ba
|
672
sqft
|
built
1937
23135 Melrose Ave, Eastpointe, MI 48021
$193
Cash flow
10.6%
Cash-on-Cash Return
8.6%
Cap rate
1.3%
Rent to Value Ratio

Active
$138,000
3
bds
|
1
ba
|
1,472
sqft
|
built
1948
22779 Almond Ave, Eastpointe, MI 48021
$29
Cash flow
1.1%
Cash-on-Cash Return
6.4%
Cap rate
1.1%
Rent to Value Ratio
Active
$159,900
3
bds
|
1
ba
|
1,520
sqft
|
built
1928
23077 Piper Ave, Eastpointe, MI 48021
$-272
Cash flow
-8.9%
Cash-on-Cash Return
4.1%
Cap rate
0.8%
Rent to Value Ratio
Active
$333,500
2
bds
|
3
ba
|
1,600
sqft
|
built
2001
141 Paton Way, Romeo, MI 48065
$-768
Cash flow
-12.0%
Cash-on-Cash Return
3.4%
Cap rate
0.7%
Rent to Value Ratio

Active
$139,900
3
bds
|
1
ba
|
1,063
sqft
|
built
1951
25173 Rosenbusch Blvd, Warren, MI 48089
$-10
Cash flow
-0.4%
Cash-on-Cash Return
6.1%
Cap rate
1.0%
Rent to Value Ratio
Active
$180,000
4
bds
|
1
ba
|
1,768
sqft
|
built
1954
23822 Wellington Ave, Warren, MI 48089
$-116
Cash flow
-3.4%
Cash-on-Cash Return
5.4%
Cap rate
0.9%
Rent to Value Ratio

Active
$125,000
3
bds
|
1
ba
|
0
sqft
|
built
1947
17728 Toepfer Dr, Eastpointe, MI 48021
$170
Cash flow
7.1%
Cash-on-Cash Return
7.8%
Cap rate
1.2%
Rent to Value Ratio
Active
$125,000
3
bds
|
1
ba
|
0
sqft
|
built
1957
22458 Hillock Ave, Warren, MI 48089
$110
Cash flow
4.6%
Cash-on-Cash Return
7.2%
Cap rate
1.1%
Rent to Value Ratio
Active
$130,000
3
bds
|
2
ba
|
1,559
sqft
|
built
1950
13996 Hobart Ave, Warren, MI 48089
$159
Cash flow
6.4%
Cash-on-Cash Return
7.6%
Cap rate
1.2%
Rent to Value Ratio