Montcalm County Investment Properties for Sale
Browse homes for sale and investment properties in Montcalm County. Refine your search by price, property type, or more.
Best cash flowing properties in Montcalm County
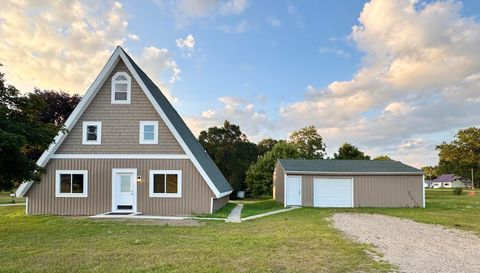
Active
$79,800
3
bds
|
2
ba
|
960
sqft
|
built
1995
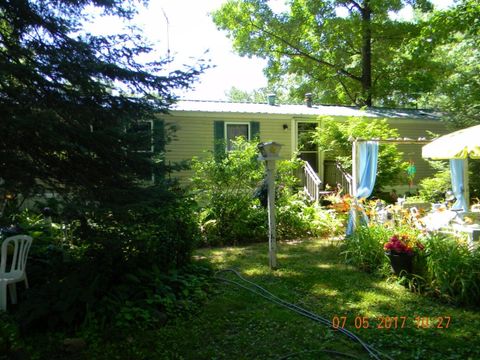
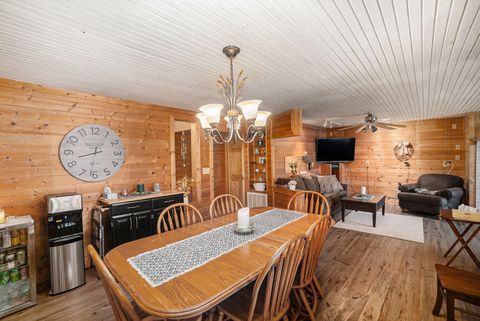
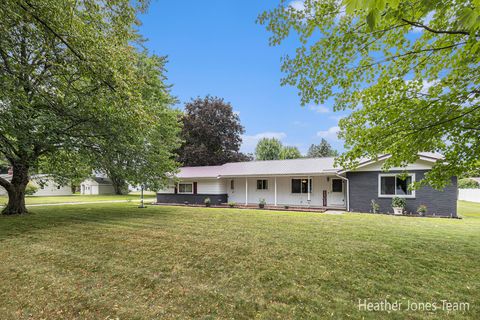
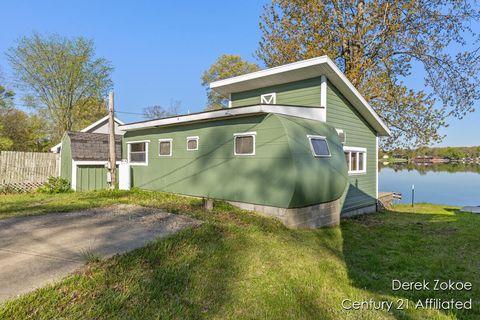
11670 Thrush Dr, Lakeview, MI 48850
$679
Cash flow
44.4%
Cash-on-Cash Return
16.4%
Cap rate
2.0%
Rent to Value Ratio
Active
$119,900
3
bds
|
1
ba
|
1,152
sqft
|
built
1982
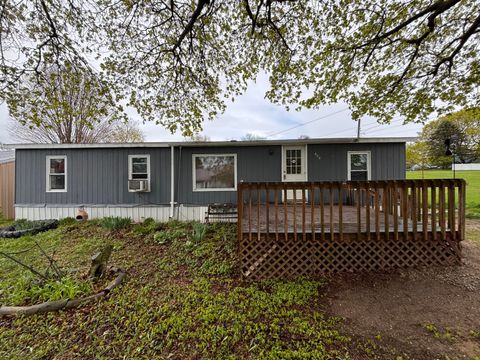
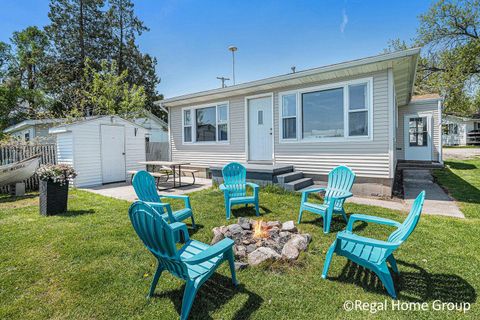
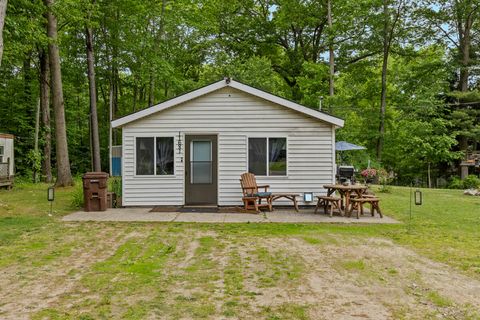
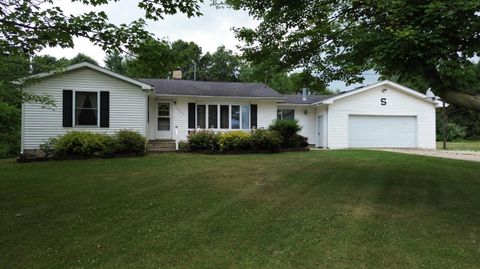
208 Clark St, Lakeview, MI 48850
$359
Cash flow
15.6%
Cash-on-Cash Return
9.7%
Cap rate
1.3%
Rent to Value Ratio
36 out of 47 properties for sale in Montcalm County
Limited Results Shown
Create a free account, or log in to reveal all property listings and enjoy the complete experience.

Active
$189,900
3
bds
|
1
ba
|
1,300
sqft
|
built
1950
2617 Dale Dr, Six Lakes, MI 48886
$133
Cash flow
3.7%
Cash-on-Cash Return
7.0%
Cap rate
0.9%
Rent to Value Ratio
Active
$185,000
3
bds
|
2
ba
|
1,452
sqft
|
built
1900
15808 Sherman St, Coral, MI 49322
$77
Cash flow
2.2%
Cash-on-Cash Return
6.6%
Cap rate
0.9%
Rent to Value Ratio
Active
$269,000
3
bds
|
2
ba
|
1,756
sqft
|
built
1876
522 W Cass St, Greenville, MI 48838
$-439
Cash flow
-8.5%
Cash-on-Cash Return
4.2%
Cap rate
0.6%
Rent to Value Ratio

Active
$274,900
3
bds
|
2
ba
|
1,344
sqft
|
built
2018
820 Emory St, Howard City, MI 49329
$-236
Cash flow
-4.5%
Cash-on-Cash Return
5.1%
Cap rate
0.7%
Rent to Value Ratio

Active
$165,000
2
bds
|
1
ba
|
1,081
sqft
|
built
1930
1015 Pearl St, Lakeview, MI 48850
$-4
Cash flow
-0.1%
Cash-on-Cash Return
6.1%
Cap rate
0.8%
Rent to Value Ratio
Active
$227,500
3
bds
|
2
ba
|
1,820
sqft
|
built
1992
7292 Avenue F, Vestaburg, MI 48891
$-68
Cash flow
-1.6%
Cash-on-Cash Return
5.8%
Cap rate
0.8%
Rent to Value Ratio
Active
$225,000
4
bds
|
2
ba
|
1,680
sqft
|
built
1930
5060 N Neff Rd, Edmore, MI 48829
$49
Cash flow
1.1%
Cash-on-Cash Return
6.4%
Cap rate
0.9%
Rent to Value Ratio
Active
$459,900
4
bds
|
2
ba
|
1,632
sqft
|
built
2019
23877 Almy Rd, Howard City, MI 49329
$-907
Cash flow
-10.3%
Cash-on-Cash Return
3.8%
Cap rate
0.5%
Rent to Value Ratio

Active
$189,900
4
bds
|
1
ba
|
1,638
sqft
|
built
1910
214 W Montcalm St, Greenville, MI 48838
$94
Cash flow
2.6%
Cash-on-Cash Return
6.7%
Cap rate
0.9%
Rent to Value Ratio
Active
$150,000
1
bds
|
1
ba
|
636
sqft
|
built
1960
4059 W Stanton Rd, Stanton, MI 48888
$-86
Cash flow
-3.0%
Cash-on-Cash Return
5.5%
Cap rate
0.7%
Rent to Value Ratio

Active
$299,999
5
bds
|
2
ba
|
1,800
sqft
|
built
1900
615 S Webster St, Greenville, MI 48838
$-569
Cash flow
-9.9%
Cash-on-Cash Return
3.9%
Cap rate
0.6%
Rent to Value Ratio

Active
$895,000
3
bds
|
1
ba
|
1,650
sqft
|
built
1950
2207 Strait Tow Blvd, Crystal, MI 48818
$-3,601
Cash flow
-21.0%
Cash-on-Cash Return
1.3%
Cap rate
0.3%
Rent to Value Ratio

Active
$160,000
2
bds
|
1
ba
|
1,338
sqft
|
built
1900
111 E Union St, Greenville, MI 48838
$6
Cash flow
0.2%
Cash-on-Cash Return
6.2%
Cap rate
0.9%
Rent to Value Ratio

Active
$449,000
4
bds
|
3
ba
|
3,220
sqft
|
built
1998
20111 Church Rd, Howard City, MI 49329
$-832
Cash flow
-9.7%
Cash-on-Cash Return
3.9%
Cap rate
0.6%
Rent to Value Ratio

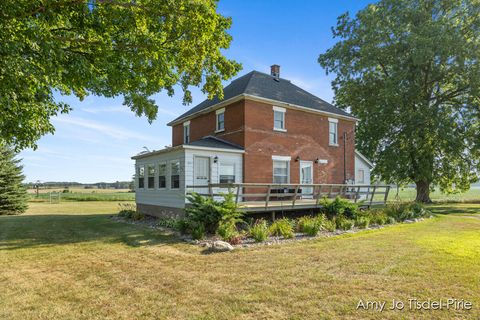
Active
$224,900
3
bds
|
1
ba
|
1,108
sqft
|
built
1956
206 Walnut St, Howard City, MI 49329
$124
Cash flow
2.9%
Cash-on-Cash Return
6.8%
Cap rate
0.9%
Rent to Value Ratio
Active
$450,000
4
bds
|
2
ba
|
2,460
sqft
|
built
1974
11422 Lakeshore Dr, Lakeview, MI 48850
$-1,146
Cash flow
-13.3%
Cash-on-Cash Return
3.1%
Cap rate
0.5%
Rent to Value Ratio
Active
$274,900
3
bds
|
1
ba
|
988
sqft
|
built
1963
271 Pine Dr, Greenville, MI 48838
$-345
Cash flow
-6.5%
Cash-on-Cash Return
4.6%
Cap rate
0.7%
Rent to Value Ratio
Active
$299,000
4
bds
|
3
ba
|
1,823
sqft
|
built
1958
503 W Gilson St, Edmore, MI 48829
$-508
Cash flow
-8.9%
Cash-on-Cash Return
4.1%
Cap rate
0.6%
Rent to Value Ratio
Active
$190,000
5
bds
|
2
ba
|
1,605
sqft
|
built
1930
340 W Main St, Stanton, MI 48888
$37
Cash flow
1.0%
Cash-on-Cash Return
6.4%
Cap rate
0.8%
Rent to Value Ratio

Active
$800,000
4
bds
|
3
ba
|
3,405
sqft
|
built
2024
6130 N Arbogast Rd, Howard City, MI 49329
$-2,933
Cash flow
-19.1%
Cash-on-Cash Return
1.7%
Cap rate
0.2%
Rent to Value Ratio
Active
$264,900
2
bds
|
2
ba
|
1,491
sqft
|
built
1966
800 E Judd St, Greenville, MI 48838
$-273
Cash flow
-5.4%
Cash-on-Cash Return
4.9%
Cap rate
0.7%
Rent to Value Ratio

Active
$150,000
bds
|
2
ba
|
3,694
sqft
|
built
1945
814 E Coffren St, Greenville, MI 48838
$336
Cash flow
11.7%
Cash-on-Cash Return
8.8%
Cap rate
1.1%
Rent to Value Ratio

Active
$315,000
3
bds
|
2
ba
|
1,800
sqft
|
built
1976
19843 Almy Rd, Howard City, MI 49329
$-322
Cash flow
-5.3%
Cash-on-Cash Return
4.9%
Cap rate
0.6%
Rent to Value Ratio

Active
$2,300,000
4
bds
|
4
ba
|
3,073
sqft
|
built
1930
2625 Elmwood Dr, Pierson, MI 49339
$-11,167
Cash flow
-25.3%
Cash-on-Cash Return
0.3%
Cap rate
0.1%
Rent to Value Ratio
Active
$185,000
3
bds
|
1
ba
|
1,000
sqft
|
built
1966
11681 Heron Dr, Lakeview, MI 48850
$-51
Cash flow
-1.4%
Cash-on-Cash Return
5.8%
Cap rate
0.7%
Rent to Value Ratio

Active
$399,900
3
bds
|
3
ba
|
3,863
sqft
|
built
1995
23375 W Howard City Edmore Rd, Howard City, MI 49329
$-833
Cash flow
-10.9%
Cash-on-Cash Return
3.6%
Cap rate
0.5%
Rent to Value Ratio

Active
$364,900
3
bds
|
2
ba
|
1,070
sqft
|
built
2019
1034 Thompson Dr, Stanton, MI 48888
$-591
Cash flow
-8.5%
Cash-on-Cash Return
4.2%
Cap rate
0.6%
Rent to Value Ratio

Active
$294,000
2
bds
|
1
ba
|
830
sqft
|
built
1950
6026 Keeney Dr, Six Lakes, MI 48886
$-195
Cash flow
-3.5%
Cash-on-Cash Return
5.4%
Cap rate
0.6%
Rent to Value Ratio
Active
$750,000
6
bds
|
3
ba
|
4,000
sqft
|
built
2017
550 E North St, Edmore, MI 48829
$-3,086
Cash flow
-21.5%
Cash-on-Cash Return
1.2%
Cap rate
0.3%
Rent to Value Ratio
Active
$359,000
2
bds
|
1
ba
|
800
sqft
|
built
1954
4142 N Masters Rd, Coral, MI 49322
$-1,063
Cash flow
-15.4%
Cash-on-Cash Return
2.6%
Cap rate
0.4%
Rent to Value Ratio
Active
$110,000
1
bds
|
1
ba
|
392
sqft
|
built
1974
771 Sunny Trl, Greenville, MI 48838
$109
Cash flow
5.2%
Cash-on-Cash Return
7.3%
Cap rate
1.0%
Rent to Value Ratio
Active
$259,900
3
bds
|
2
ba
|
2,900
sqft
|
built
1962
4085 N Cedar Lake Rd, Edmore, MI 48829
$-208
Cash flow
-4.2%
Cash-on-Cash Return
5.2%
Cap rate
0.7%
Rent to Value Ratio

Active
$1,600,000
4
bds
|
4
ba
|
3,399
sqft
|
built
1991
2765 Elmwood Dr, Pierson, MI 49339
$-7,285
Cash flow
-23.8%
Cash-on-Cash Return
0.7%
Cap rate
0.1%
Rent to Value Ratio
Active
$181,500
5
bds
|
2
ba
|
2,880
sqft
|
built
1947
215 W Grove St, Greenville, MI 48838
$223
Cash flow
6.4%
Cash-on-Cash Return
7.6%
Cap rate
1.1%
Rent to Value Ratio