Ottawa County Investment Properties for Sale
Browse homes for sale and investment properties in Ottawa County. Refine your search by price, property type, or more.
Best cash flowing properties in Ottawa County

Active
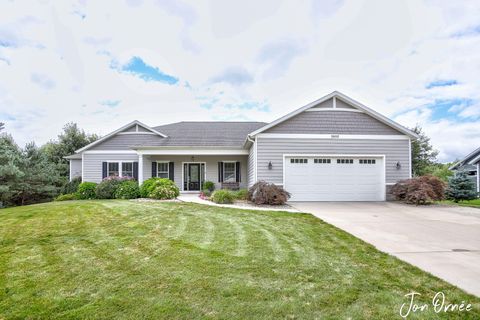
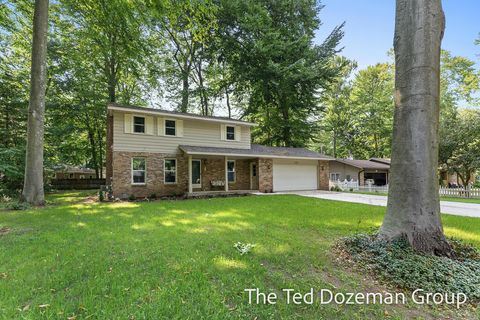
$244,900
2
bds
|
2
ba
|
1,106
sqft
|
built
1979
17462 Dunewood Ct, Spring Lake, MI 49456
$-207
Cash flow
-4.4%
Cash-on-Cash Return
5.1%
Cap rate
0.8%
Rent to Value Ratio
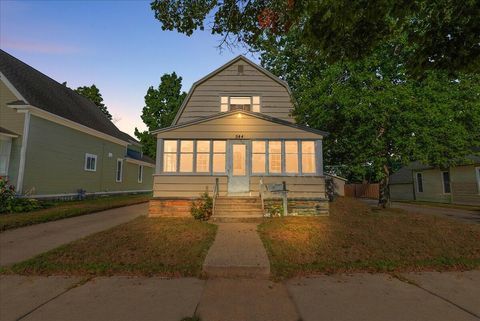
Active
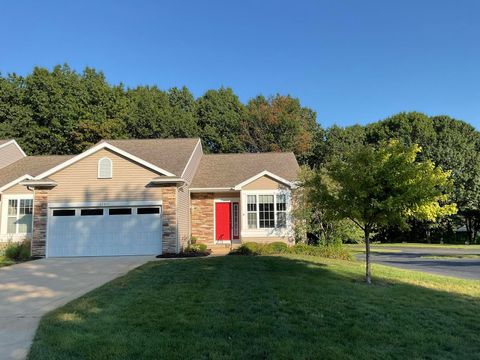
$299,900
3
bds
|
2
ba
|
1,680
sqft
|
built
1910
544 College Ave, Holland, MI 49423
$-233
Cash flow
-4.1%
Cash-on-Cash Return
5.2%
Cap rate
0.7%
Rent to Value Ratio
243 out of 272 properties for sale in Ottawa County
Limited Results Shown
Create a free account, or log in to reveal all property listings and enjoy the complete experience.

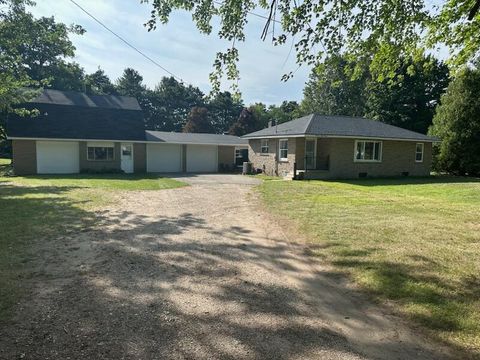
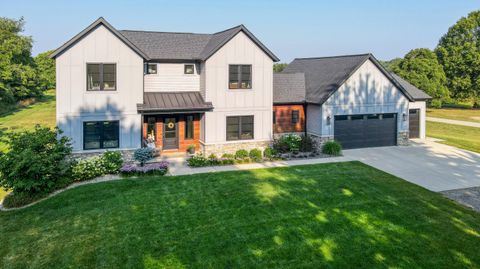
Active
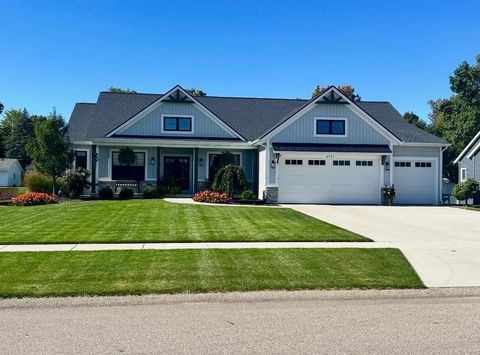
$560,900
4
bds
|
4
ba
|
2,501
sqft
|
built
1994
975 Bluff Lake Dr, Zeeland, MI 49464
$-1,265
Cash flow
-11.8%
Cash-on-Cash Return
3.0%
Cap rate
0.5%
Rent to Value Ratio

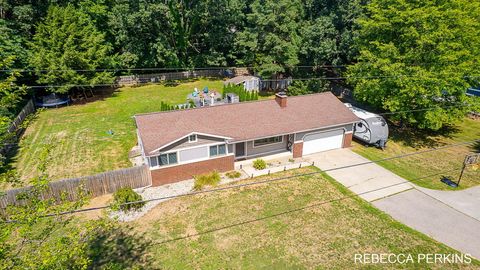
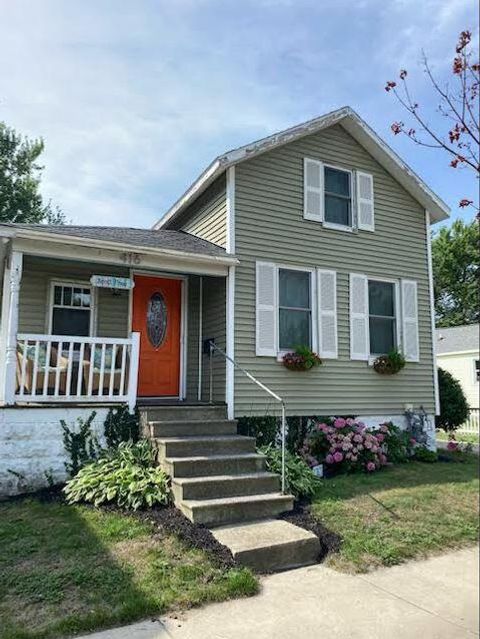
Active
$899,000
4
bds
|
3
ba
|
2,118
sqft
|
built
1977
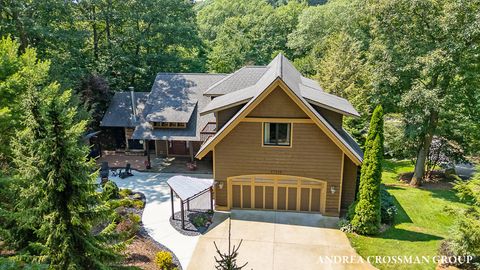
9410 Whispering Sands Dr, West Olive, MI 49460
$-2,597
Cash flow
-15.1%
Cash-on-Cash Return
2.7%
Cap rate
0.5%
Rent to Value Ratio
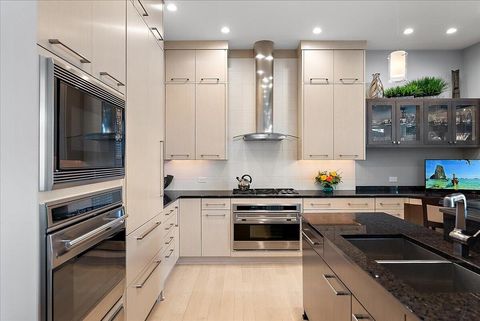
Active
$549,900
4
bds
|
2
ba
|
1,680
sqft
|
built
1996
18780 112th Ave, Nunica, MI 49448
$-1,365
Cash flow
-13.0%
Cash-on-Cash Return
3.2%
Cap rate
0.5%
Rent to Value Ratio
Active
$374,900
3
bds
|
3
ba
|
1,550
sqft
|
built
1900
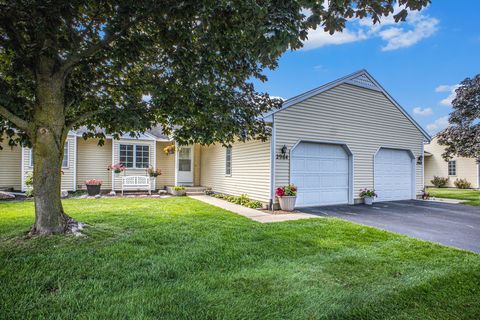
3054 Sehler St, Conklin, MI 49403
$-678
Cash flow
-9.4%
Cash-on-Cash Return
4.0%
Cap rate
0.5%
Rent to Value Ratio
Active
$699,900
4
bds
|
3
ba
|
3,224
sqft
|
built
2013
13480 141st Ave, Grand Haven, MI 49417
$-1,737
Cash flow
-12.9%
Cash-on-Cash Return
3.2%
Cap rate
0.4%
Rent to Value Ratio
Active
$644,900
5
bds
|
4
ba
|
3,303
sqft
|
built
2016
15012 Copperwood Dr, Grand Haven, MI 49417
$-2,024
Cash flow
-16.4%
Cash-on-Cash Return
2.4%
Cap rate
0.4%
Rent to Value Ratio

Active
$530,000
5
bds
|
4
ba
|
2,911
sqft
|
built
2021
5842 Lynn Dr, Allendale, MI 49401
$-1,095
Cash flow
-10.8%
Cash-on-Cash Return
3.7%
Cap rate
0.6%
Rent to Value Ratio
Active
$379,999
4
bds
|
2
ba
|
2,051
sqft
|
built
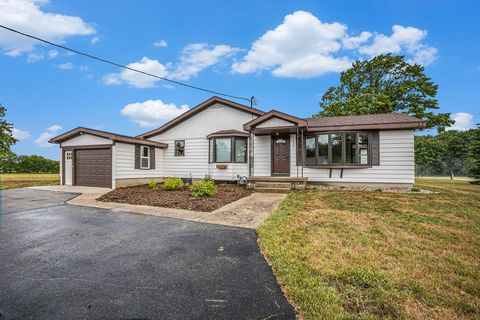
1958
19811 32nd Ave, Conklin, MI 49403
$-992
Cash flow
-13.6%
Cash-on-Cash Return
3.0%
Cap rate
0.5%
Rent to Value Ratio
Active
$339,900
3
bds
|
2
ba
|
1,175
sqft
|
built
1977
7079 Fillmore St, Allendale, MI 49401
$-451
Cash flow
-6.9%
Cash-on-Cash Return
4.6%
Cap rate
0.6%
Rent to Value Ratio

Active
$329,900
3
bds
|
2
ba
|
1,938
sqft
|
built
1968
790 Mayfield St, Holland, MI 49424
$-576
Cash flow
-9.1%
Cash-on-Cash Return
4.1%
Cap rate
0.6%
Rent to Value Ratio

Active
$1,095,000
5
bds
|
4
ba
|
3,073
sqft
|
built
2018
7010 Riley St, Zeeland, MI 49464
$-2,376
Cash flow
-11.3%
Cash-on-Cash Return
3.5%
Cap rate
0.6%
Rent to Value Ratio
Active
$3,990,000
4
bds
|
6
ba
|
6,462
sqft
|
built
2008
11647 Garnsey Ave, Grand Haven, MI 49417
$-19,687
Cash flow
-25.7%
Cash-on-Cash Return
0.2%
Cap rate
0.1%
Rent to Value Ratio

Active
$385,000
3
bds
|
3
ba
|
1,850
sqft
|
built
1971
241 Woodlawn Ct, Zeeland, MI 49464
$-838
Cash flow
-11.4%
Cash-on-Cash Return
3.5%
Cap rate
0.6%
Rent to Value Ratio

Active
$949,900
6
bds
|
4
ba
|
4,457
sqft
|
built
2017
14112 Georgian Bay Dr, Holland, MI 49424
$-3,090
Cash flow
-17.0%
Cash-on-Cash Return
2.2%
Cap rate
0.4%
Rent to Value Ratio

Active
$480,000
4
bds
|
3
ba
|
2,785
sqft
|
built
2021
6620 Sheldon Crossing Dr, Hudsonville, MI 49426
$-1,279
Cash flow
-13.9%
Cash-on-Cash Return
2.9%
Cap rate
0.6%
Rent to Value Ratio

Active
$295,000
3
bds
|
1
ba
|
1,161
sqft
|
built
1916
299 W 18th St, Holland, MI 49423
$-790
Cash flow
-14.0%
Cash-on-Cash Return
2.9%
Cap rate
0.6%
Rent to Value Ratio

Active
$369,900
4
bds
|
3
ba
|
1,904
sqft
|
built
1905
59 W 17th St, Holland, MI 49423
$-590
Cash flow
-8.3%
Cash-on-Cash Return
4.2%
Cap rate
0.7%
Rent to Value Ratio
Active
$447,500
4
bds
|
3
ba
|
2,076
sqft
|
built
1972
338 Roosevelt Ave, Holland, MI 49424
$-1,498
Cash flow
-17.5%
Cash-on-Cash Return
2.1%
Cap rate
0.4%
Rent to Value Ratio
Active
$365,000
2
bds
|
3
ba
|
1,926
sqft
|
built
2013
12611 Broadmoor Pl, Grand Haven, MI 49417
$-817
Cash flow
-11.7%
Cash-on-Cash Return
3.5%
Cap rate
0.6%
Rent to Value Ratio
Active
$649,000
5
bds
|
4
ba
|
3,402
sqft
|
built
2020
6721 Alward Dr, Hudsonville, MI 49426
$-1,972
Cash flow
-15.9%
Cash-on-Cash Return
2.5%
Cap rate
0.4%
Rent to Value Ratio
Active
$379,900
3
bds
|
2
ba
|
1,420
sqft
|
built
1880
416 Jackson Ave, Grand Haven, MI 49417
$-861
Cash flow
-11.8%
Cash-on-Cash Return
3.4%
Cap rate
0.5%
Rent to Value Ratio

Active
$349,900
3
bds
|
2
ba
|
1,413
sqft
|
built
1991
205 Jennifer Ln, Holland, MI 49423
$-705
Cash flow
-10.5%
Cash-on-Cash Return
3.7%
Cap rate
0.6%
Rent to Value Ratio
Active
$884,900
5
bds
|
5
ba
|
3,584
sqft
|
built
2019
6441 64th Ave, Hudsonville, MI 49426
$-1,467
Cash flow
-8.6%
Cash-on-Cash Return
4.2%
Cap rate
0.6%
Rent to Value Ratio
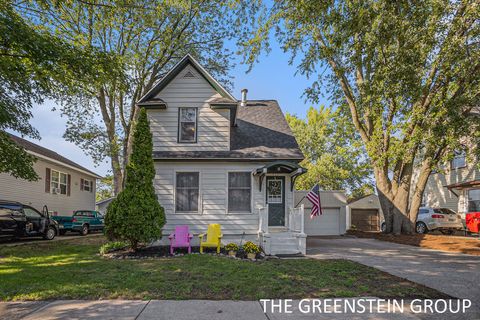
Active
$339,000
4
bds
|
3
ba
|
1,933
sqft
|
built
1911
1313 Washington Ave, Grand Haven, MI 49417
$-469
Cash flow
-7.2%
Cash-on-Cash Return
4.5%
Cap rate
0.6%
Rent to Value Ratio
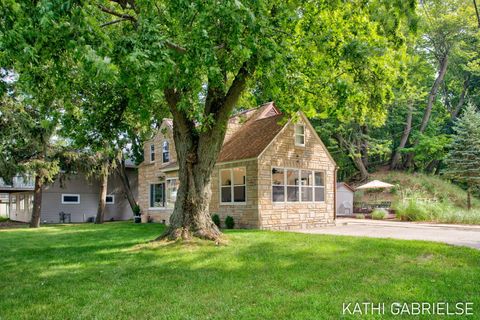
Active
$670,000
3
bds
|
2
ba
|
1,734
sqft
|
built
1931
19196 N Shore Dr, Spring Lake, MI 49456
$-1,956
Cash flow
-15.2%
Cash-on-Cash Return
2.6%
Cap rate
0.5%
Rent to Value Ratio

Active
$699,900
3
bds
|
4
ba
|
2,276
sqft
|
built
1961
860 Allen Dr, Holland, MI 49423
$-2,180
Cash flow
-16.3%
Cash-on-Cash Return
2.4%
Cap rate
0.4%
Rent to Value Ratio
Active
$319,900
4
bds
|
1
ba
|
1,640
sqft
|
built
1921
563 W 23rd St, Holland, MI 49423
$-259
Cash flow
-4.2%
Cash-on-Cash Return
5.2%
Cap rate
0.6%
Rent to Value Ratio
Active
$950,000
3
bds
|
3
ba
|
3,234
sqft
|
built
2007
17110 Pimento Hl, West Olive, MI 49460
$-2,788
Cash flow
-15.3%
Cash-on-Cash Return
2.6%
Cap rate
0.4%
Rent to Value Ratio

Active
$2,699,000
6
bds
|
5
ba
|
4,196
sqft
|
built
1957
833 Allen Dr, Holland, MI 49423
$-13,805
Cash flow
-26.7%
Cash-on-Cash Return
0.0%
Cap rate
0.1%
Rent to Value Ratio

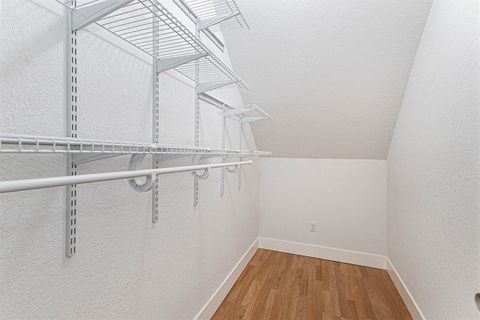
Active
$549,900
bds
|
0
ba
|
0
sqft
|
built
1986
403 Stratford Way, Holland, MI 49423
$-2,826
Cash flow
-26.8%
Cash-on-Cash Return
0.0%
Cap rate
0.3%
Rent to Value Ratio
Active
$275,000
3
bds
|
2
ba
|
1,731
sqft
|
built
1990
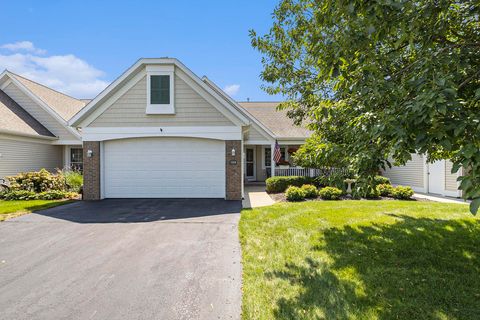
2964 Parkside Dr, Jenison, MI 49428
$-794
Cash flow
-15.1%
Cash-on-Cash Return
2.7%
Cap rate
0.7%
Rent to Value Ratio

Active
$475,000
4
bds
|
4
ba
|
2,266
sqft
|
built
1999
270 Silver Ridge Dr, Holland, MI 49424
$-1,092
Cash flow
-12.0%
Cash-on-Cash Return
3.4%
Cap rate
0.5%
Rent to Value Ratio

Active
$425,000
3
bds
|
2
ba
|
1,418
sqft
|
built
1972
566 Wind Drift Ln, Spring Lake, MI 49456
$-1,242
Cash flow
-15.2%
Cash-on-Cash Return
2.6%
Cap rate
0.7%
Rent to Value Ratio
Active
$515,000
3
bds
|
2
ba
|
2,095
sqft
|
built
1925
10261 96th Ave, Zeeland, MI 49464
$-1,363
Cash flow
-13.8%
Cash-on-Cash Return
3.0%
Cap rate
0.5%
Rent to Value Ratio
Active
$389,000
2
bds
|
3
ba
|
2,159
sqft
|
built
2004
1324 Timber Xing, Holland, MI 49424
$-1,206
Cash flow
-16.2%
Cash-on-Cash Return
2.4%
Cap rate
0.6%
Rent to Value Ratio
Active
$429,900
3
bds
|
2
ba
|
1,808
sqft
|
built
1900
11529 168th Ave, Grand Haven, MI 49417
$-698
Cash flow
-8.5%
Cash-on-Cash Return
4.2%
Cap rate
0.6%
Rent to Value Ratio

Active
$590,000
5
bds
|
3
ba
|
3,330
sqft
|
built
1908
663 Lugers Rd, Holland, MI 49423
$-1,470
Cash flow
-13.0%
Cash-on-Cash Return
3.2%
Cap rate
0.5%
Rent to Value Ratio

Active
$550,000
3
bds
|
2
ba
|
2,935
sqft
|
built
1975
1254 S Shore Dr, Holland, MI 49423
$-1,538
Cash flow
-14.6%
Cash-on-Cash Return
2.8%
Cap rate
0.5%
Rent to Value Ratio