Michigan Investment Properties for Sale
Browse homes for sale and investment properties in Michigan. Refine your search by price, property type, or more.
Best cash flowing properties in Michigan
Active
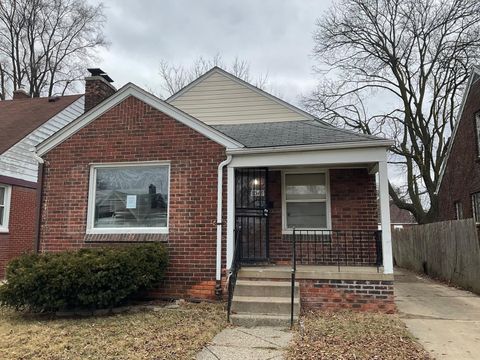
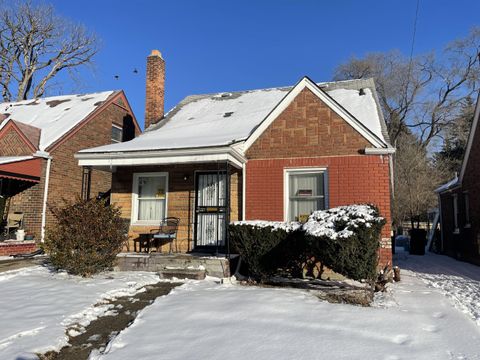
$70,000
2
bds
|
1
ba
|
832
sqft
|
built
1940
8518 Sussex St, Detroit, MI 48228
$689
Cash flow
11.5%
Cash-on-Cash Return
11.8%
Cap rate
1.7%
Rent to Value Ratio
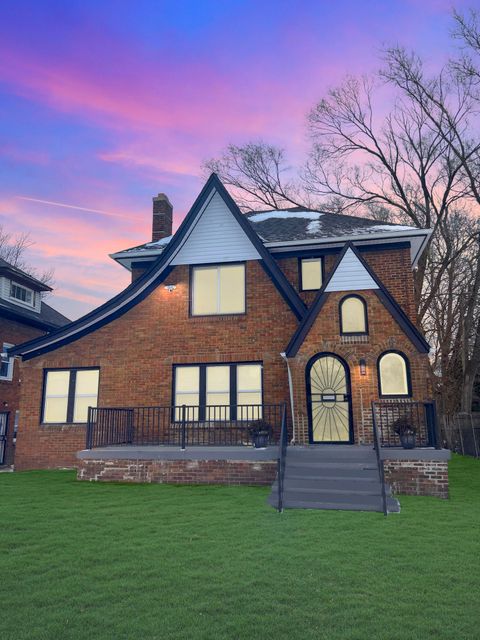
Active
$299,000
4
bds
|
3
ba
|
2,174
sqft
|
built
1927
16864 Linwood St, Detroit, MI 48221
$440
Cash flow
7.7%
Cash-on-Cash Return
7.9%
Cap rate
1.0%
Rent to Value Ratio
2,793 out of 5,191 properties for sale in Michigan
Limited Results Shown
Create a free account, or log in to reveal all property listings and enjoy the complete experience.
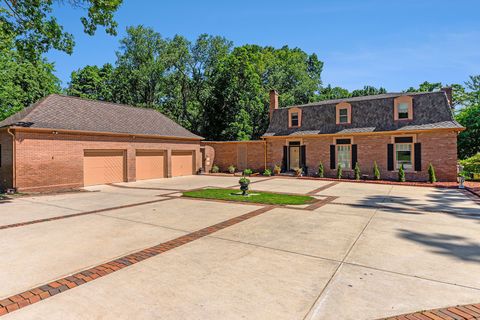
Active
$644,900
6
bds
|
5
ba
|
5,435
sqft
|
built
1965
1818 Greenbriar Dr, Portage, MI 49024
$-1,808
Cash flow
-14.6%
Cash-on-Cash Return
2.8%
Cap rate
0.6%
Rent to Value Ratio
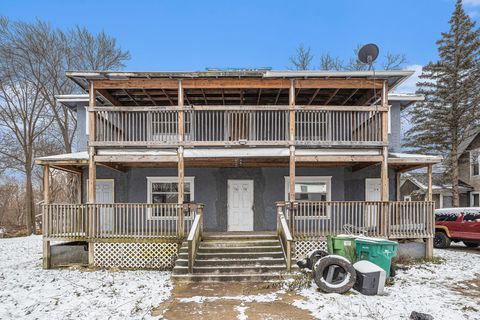
Active
$145,000
bds
|
0
ba
|
0
sqft
|
built
1890
174 Cherry St, Battle Creek, MI 49017
$-194
Cash flow
-7.0%
Cash-on-Cash Return
4.5%
Cap rate
1.0%
Rent to Value Ratio
Active
$650,000
3
bds
|
3
ba
|
1,920
sqft
|
built
2018
3850 Diuble Rd, Ann Arbor, MI 48103
$-1,539
Cash flow
-12.4%
Cash-on-Cash Return
3.3%
Cap rate
0.5%
Rent to Value Ratio
Active
$319,000
4
bds
|
2
ba
|
2,546
sqft
|
built
1920
10145 W Kl Ave, Kalamazoo, MI 49009
$-264
Cash flow
-4.3%
Cash-on-Cash Return
5.2%
Cap rate
0.7%
Rent to Value Ratio
Active
$129,900
3
bds
|
1
ba
|
1,200
sqft
|
built
1926
1211 S Jackson St, Jackson, MI 49203
$192
Cash flow
7.7%
Cash-on-Cash Return
7.9%
Cap rate
1.1%
Rent to Value Ratio

Active
$254,000
3
bds
|
1
ba
|
864
sqft
|
built
1950
320 East Dr, Marshall, MI 49068
$-483
Cash flow
-9.9%
Cash-on-Cash Return
3.9%
Cap rate
0.6%
Rent to Value Ratio
Active
$75,000
3
bds
|
1
ba
|
908
sqft
|
built
1943
19303 Fairport St, Detroit, MI 48205
$325
Cash flow
22.6%
Cash-on-Cash Return
11.3%
Cap rate
1.6%
Rent to Value Ratio
Active
$388,800
4
bds
|
4
ba
|
1,802
sqft
|
built
2000
8181 Fawn Meadow Trl, Galesburg, MI 49053
$-782
Cash flow
-10.5%
Cash-on-Cash Return
3.7%
Cap rate
0.6%
Rent to Value Ratio
Active
$2,285,000
4
bds
|
6
ba
|
6,904
sqft
|
built
1927
2010 Devonshire Rd, Ann Arbor, MI 48104
$-9,831
Cash flow
-22.4%
Cash-on-Cash Return
1.0%
Cap rate
0.4%
Rent to Value Ratio
Active
$189,000
3
bds
|
2
ba
|
1,406
sqft
|
built
1946
19209 Hartwell St, Detroit, MI 48235
$-126
Cash flow
-3.5%
Cash-on-Cash Return
5.3%
Cap rate
0.7%
Rent to Value Ratio
Active
$499,000
1
bds
|
1
ba
|
570
sqft
|
built
2007
111 N Ashley St, Ann Arbor, MI 48104
$-2,045
Cash flow
-21.4%
Cash-on-Cash Return
1.2%
Cap rate
0.4%
Rent to Value Ratio
Active
$379,900
4
bds
|
1
ba
|
1,938
sqft
|
built
1955
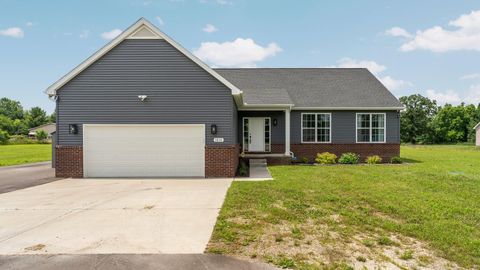
4209 92nd St SW, Byron Center, MI 49315
$-568
Cash flow
-7.8%
Cash-on-Cash Return
4.4%
Cap rate
0.6%
Rent to Value Ratio
Active
$349,900
3
bds
|
2
ba
|
2,001
sqft
|
built
1952
3330 Bradford St NE, Grand Rapids, MI 49525
$-565
Cash flow
-8.4%
Cash-on-Cash Return
4.2%
Cap rate
0.6%
Rent to Value Ratio

Active
$1,659,240
3
bds
|
2
ba
|
2,983
sqft
|
built
1950
15665 Portage Rd, Vicksburg, MI 49097
$-8,651
Cash flow
-27.2%
Cash-on-Cash Return
-0.1%
Cap rate
0.1%
Rent to Value Ratio
Active
$359,900
3
bds
|
2
ba
|
1,431
sqft
|
built
1952
6750 Walters Rd, Clarkston, MI 48346
$-586
Cash flow
-8.5%
Cash-on-Cash Return
4.2%
Cap rate
0.8%
Rent to Value Ratio
Active
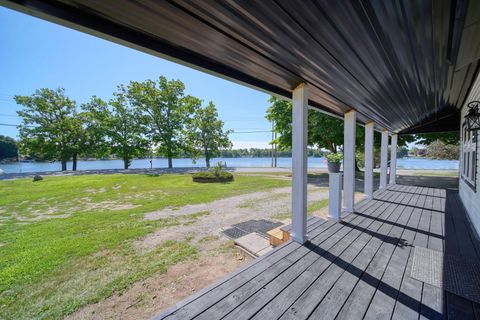
$429,900
5
bds
|
2
ba
|
2,288
sqft
|
built
1950
15008 Lakeshore Dr, Grand Haven, MI 49417
$-161
Cash flow
-2.0%
Cash-on-Cash Return
5.2%
Cap rate
0.7%
Rent to Value Ratio
Active
$995,000
2
bds
|
3
ba
|
2,292
sqft
|
built
2021
2063 Ottawa Beach Rd, Holland, MI 49424
$-4,205
Cash flow
-22.0%
Cash-on-Cash Return
1.1%
Cap rate
0.4%
Rent to Value Ratio
Active
$1,095,000
4
bds
|
4
ba
|
4,525
sqft
|
built
1975
8201 Cherry Valley Ave SE, Caledonia, MI 49316
$-3,722
Cash flow
-17.7%
Cash-on-Cash Return
2.1%
Cap rate
0.3%
Rent to Value Ratio
Active
$145,000
4
bds
|
2
ba
|
1,549
sqft
|
built
1946
19721 Hartwell St, Detroit, MI 48235
$241
Cash flow
8.7%
Cash-on-Cash Return
8.1%
Cap rate
1.1%
Rent to Value Ratio
Active
$325,000
2
bds
|
3
ba
|
1,558
sqft
|
built
2022
1003 Saltsprings Dr, Saline, MI 48176
$-185
Cash flow
-3.0%
Cash-on-Cash Return
5.5%
Cap rate
0.8%
Rent to Value Ratio
Active
$224,900
4
bds
|
0
ba
|
0
sqft
|
built
1910
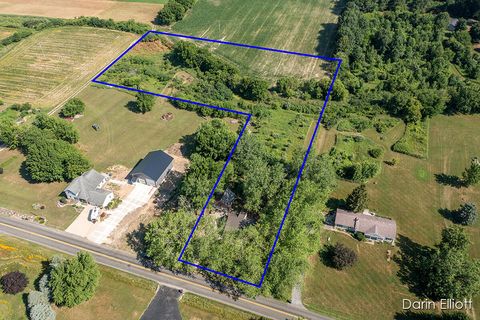
525 E Pine Rd, Edmore, MI 48829
$-381
Cash flow
-8.8%
Cash-on-Cash Return
4.1%
Cap rate
0.7%
Rent to Value Ratio

Active
$180,000
bds
|
0
ba
|
0
sqft
|
built
1900
107 W Center St, Belding, MI 48809
$61
Cash flow
1.8%
Cash-on-Cash Return
6.6%
Cap rate
1.1%
Rent to Value Ratio

Active
$350,000
4
bds
|
4
ba
|
2,700
sqft
|
built
1967
8257 2nd St, Mattawan, MI 49071
$-350
Cash flow
-5.2%
Cash-on-Cash Return
4.9%
Cap rate
0.7%
Rent to Value Ratio
Active
$579,900
5
bds
|
3
ba
|
2,036
sqft
|
built
1967
3666 Frederick Dr, Ann Arbor, MI 48105
$-1,984
Cash flow
-17.9%
Cash-on-Cash Return
2.0%
Cap rate
0.6%
Rent to Value Ratio
Active
$699,000
4
bds
|
5
ba
|
3,558
sqft
|
built
2005
49592 Garfield Ln, Canton, MI 48188
$-1,744
Cash flow
-13.0%
Cash-on-Cash Return
3.2%
Cap rate
0.6%
Rent to Value Ratio
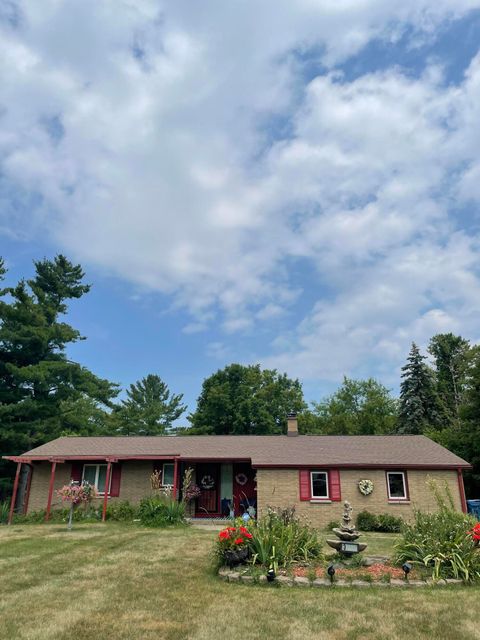
Active
$375,000
3
bds
|
1
ba
|
1,362
sqft
|
built
1954
1834 Bond St, Niles, MI 49120
$-940
Cash flow
-13.1%
Cash-on-Cash Return
3.1%
Cap rate
0.5%
Rent to Value Ratio
Active
$185,000
2
bds
|
1
ba
|
1,026
sqft
|
built
1953
2932 Green St, Lincoln Park, MI 48146
$-15
Cash flow
-0.4%
Cash-on-Cash Return
6.1%
Cap rate
0.9%
Rent to Value Ratio

Active
$1,125,000
5
bds
|
4
ba
|
4,759
sqft
|
built
1999
29750 Edwards Way, Niles, MI 49120
$-4,597
Cash flow
-21.3%
Cash-on-Cash Return
1.2%
Cap rate
0.2%
Rent to Value Ratio

Active
$160,000
3
bds
|
1
ba
|
1,181
sqft
|
built
1940
240 Stillwell Ave, Michigan Center, MI 49254
$135
Cash flow
4.4%
Cash-on-Cash Return
7.2%
Cap rate
1.0%
Rent to Value Ratio
Active
$95,000
1
bds
|
1
ba
|
720
sqft
|
built
1950
11758 Hartwell St, Detroit, MI 48227
$158
Cash flow
8.7%
Cash-on-Cash Return
8.1%
Cap rate
1.2%
Rent to Value Ratio
Active
$224,500
3
bds
|
2
ba
|
808
sqft
|
built
1922
400 Burton St SW, Grand Rapids, MI 49507
$-151
Cash flow
-3.5%
Cash-on-Cash Return
5.3%
Cap rate
0.7%
Rent to Value Ratio

Active
$679,000
3
bds
|
0
ba
|
0
sqft
|
built
1928
514 Pauline Blvd, Ann Arbor, MI 48103
$-2,443
Cash flow
-18.8%
Cash-on-Cash Return
1.8%
Cap rate
0.5%
Rent to Value Ratio
Active
$350,000
2
bds
|
1
ba
|
904
sqft
|
built
1960
8020 Greenes Dr, Jackson, MI 49201
$-1,302
Cash flow
-19.4%
Cash-on-Cash Return
1.7%
Cap rate
0.4%
Rent to Value Ratio
Active
$695,000
5
bds
|
4
ba
|
3,500
sqft
|
built
1964
3706 Northview Dr, Kalamazoo, MI 49004
$-2,392
Cash flow
-18.0%
Cash-on-Cash Return
2.0%
Cap rate
0.3%
Rent to Value Ratio

Active
$239,900
3
bds
|
2
ba
|
1,480
sqft
|
built
1920
187 Centennial St, Sparta, MI 49345
$-36
Cash flow
-0.8%
Cash-on-Cash Return
6.0%
Cap rate
0.8%
Rent to Value Ratio
Active
$449,900
3
bds
|
2
ba
|
2,016
sqft
|
built
1900
210 W Grove Ave, Michigan Center, MI 49254
$-1,287
Cash flow
-14.9%
Cash-on-Cash Return
2.7%
Cap rate
0.4%
Rent to Value Ratio
Active
$399,900
3
bds
|
3
ba
|
2,138
sqft
|
built
1945
3828 Grand Prairie Rd, Kalamazoo, MI 49006
$-891
Cash flow
-11.6%
Cash-on-Cash Return
3.5%
Cap rate
0.6%
Rent to Value Ratio
Active
$96,000
3
bds
|
1
ba
|
835
sqft
|
built
1941
9352 Hartwell St, Detroit, MI 48228
$173
Cash flow
9.4%
Cash-on-Cash Return
8.3%
Cap rate
1.3%
Rent to Value Ratio