Michigan Investment Properties for Sale
Browse homes for sale and investment properties in Michigan. Refine your search by price, property type, or more.
Best cash flowing properties in Michigan
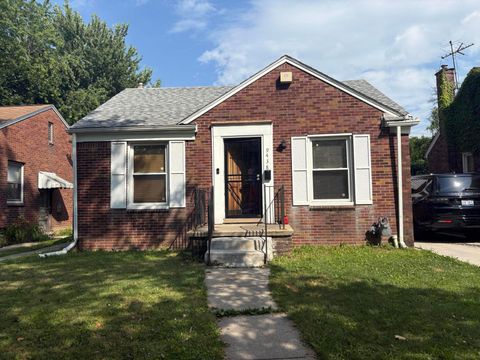
Active
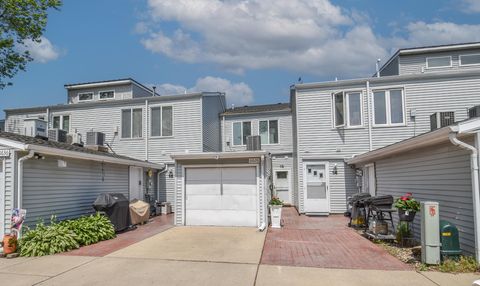
$95,000
4
bds
|
2
ba
|
1,458
sqft
|
built
1944
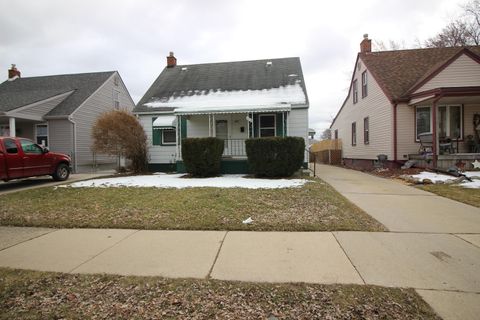
9403 Camley St, Detroit, MI 48224
$341
Cash flow
18.7%
Cash-on-Cash Return
10.5%
Cap rate
1.5%
Rent to Value Ratio
Active
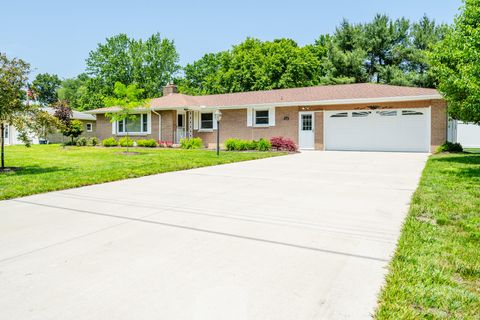
$85,000
2
bds
|
1
ba
|
1,440
sqft
|
built
1944
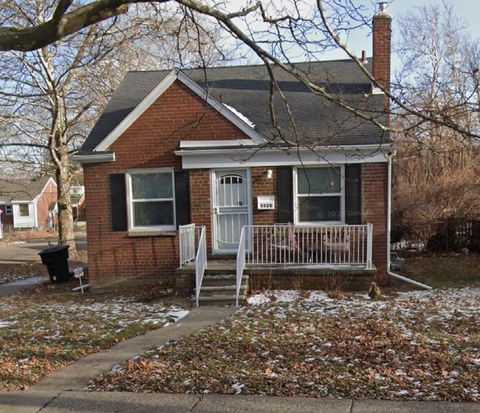
9327 Camley St, Detroit, MI 48224
$341
Cash flow
20.9%
Cash-on-Cash Return
11.0%
Cap rate
1.5%
Rent to Value Ratio
2,536 out of 4,780 properties for sale in Michigan
Limited Results Shown
Create a free account, or log in to reveal all property listings and enjoy the complete experience.

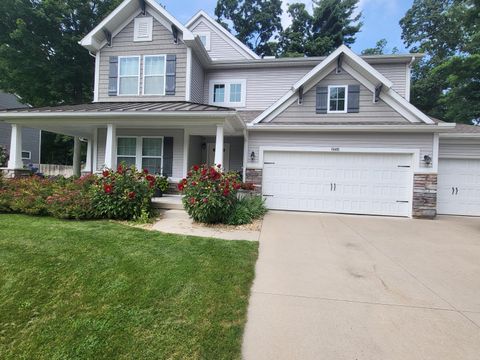
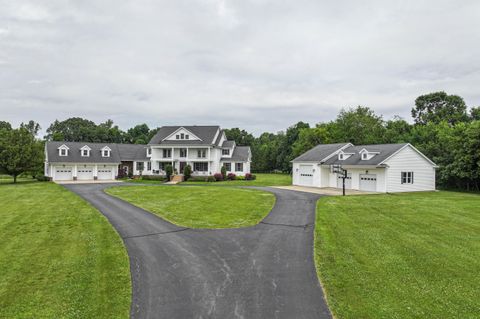
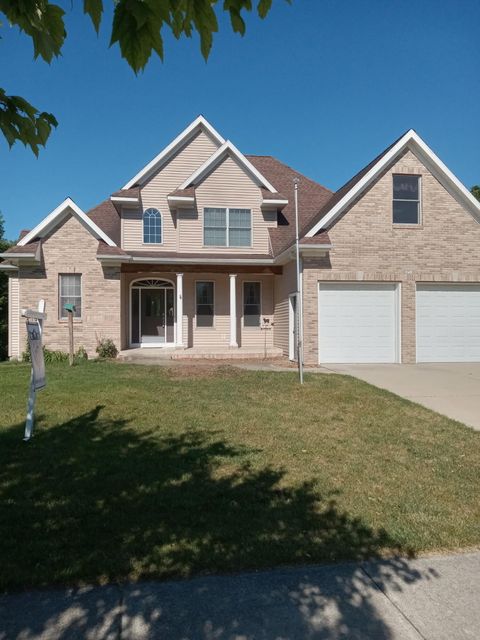
Active
$440,000
8
bds
|
7
ba
|
3,473
sqft
|
built
1970
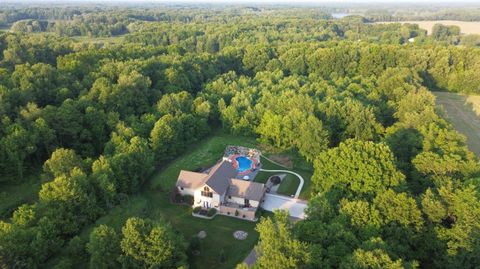
11303 W Dr N, Bellevue, MI 49021
$-860
Cash flow
-10.2%
Cash-on-Cash Return
3.8%
Cap rate
0.7%
Rent to Value Ratio
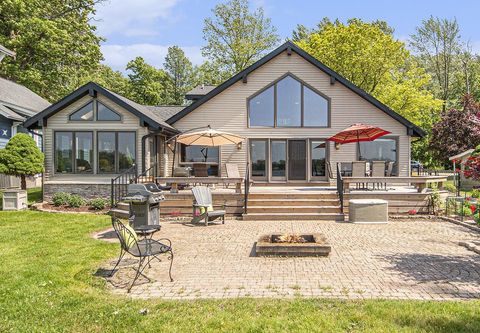
Active
$484,500
4
bds
|
4
ba
|
2,558
sqft
|
built
2002
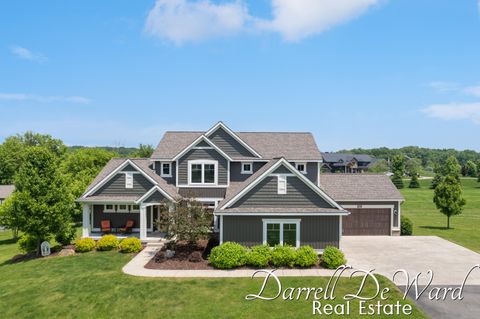
2223 Monica Rd, Stevensville, MI 49127
$-1,218
Cash flow
-13.1%
Cash-on-Cash Return
3.1%
Cap rate
0.6%
Rent to Value Ratio

Active
$1,550,000
3
bds
|
4
ba
|
3,284
sqft
|
built
1999
1256 Barron Lake Rd, Niles, MI 49120
$-6,953
Cash flow
-23.4%
Cash-on-Cash Return
0.8%
Cap rate
0.1%
Rent to Value Ratio

Active
$339,900
4
bds
|
3
ba
|
2,140
sqft
|
built
1971
68026 Union Rd S, Union, MI 49130
$-728
Cash flow
-11.2%
Cash-on-Cash Return
3.6%
Cap rate
0.5%
Rent to Value Ratio
Active
$1,099,000
1
bds
|
1
ba
|
676
sqft
|
built
1945
17078 Lake Michigan Dr, West Olive, MI 49460
$-4,375
Cash flow
-20.8%
Cash-on-Cash Return
1.4%
Cap rate
0.2%
Rent to Value Ratio
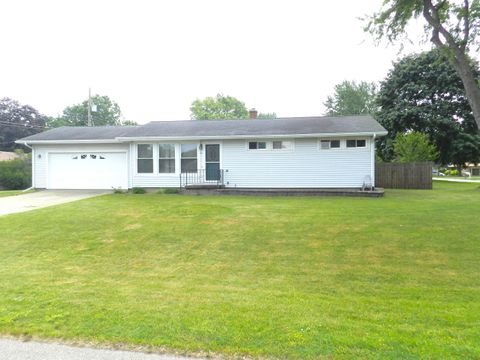
Active
$150,000
2
bds
|
1
ba
|
1,092
sqft
|
built
1946
573 Leblanc St, Lincoln Park, MI 48146
$19
Cash flow
0.7%
Cash-on-Cash Return
6.3%
Cap rate
1.1%
Rent to Value Ratio

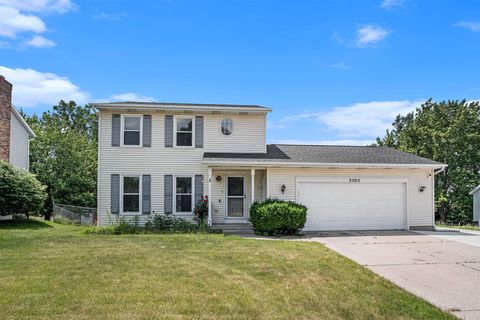
Active
$259,000
4
bds
|
1
ba
|
1,698
sqft
|
built
1930
4555 Charles St, Palo, MI 48870
$-154
Cash flow
-3.1%
Cash-on-Cash Return
5.4%
Cap rate
0.7%
Rent to Value Ratio

Active
$399,900
2
bds
|
2
ba
|
1,314
sqft
|
built
1990
43 Campau Cir NW, Grand Rapids, MI 49503
$-1,444
Cash flow
-18.8%
Cash-on-Cash Return
1.8%
Cap rate
0.8%
Rent to Value Ratio
Active
$1,250,000
3
bds
|
4
ba
|
4,376
sqft
|
built
2011
8874 1 Mile Rd, East Leroy, MI 49051
$-4,844
Cash flow
-20.2%
Cash-on-Cash Return
1.5%
Cap rate
0.2%
Rent to Value Ratio
Active
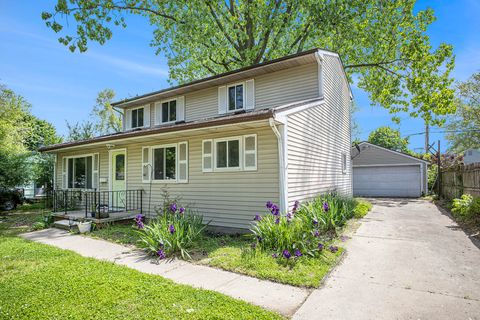
$85,000
2
bds
|
1
ba
|
1,429
sqft
|
built
1943
9424 Sanilac St, Detroit, MI 48224
$270
Cash flow
16.6%
Cash-on-Cash Return
10.0%
Cap rate
1.4%
Rent to Value Ratio
Active
$865,000
5
bds
|
4
ba
|
3,149
sqft
|
built
2019
3940 Egypt Valley Ave NE, Ada, MI 49301
$-2,225
Cash flow
-13.4%
Cash-on-Cash Return
3.1%
Cap rate
0.5%
Rent to Value Ratio
Active
$625,000
6
bds
|
5
ba
|
4,294
sqft
|
built
2016
14415 Manor Rd, Grand Haven, MI 49417
$-1,282
Cash flow
-10.7%
Cash-on-Cash Return
3.7%
Cap rate
0.6%
Rent to Value Ratio
Active
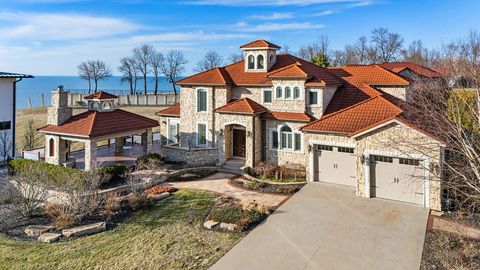
$1,595,000
4
bds
|
6
ba
|
4,520
sqft
|
built
2008
651 Sul Lago S, Benton Harbor, MI 49022
$-8,365
Cash flow
-27.4%
Cash-on-Cash Return
-0.1%
Cap rate
0.4%
Rent to Value Ratio
Active
$299,000
5
bds
|
3
ba
|
3,060
sqft
|
built
1915
1199 Atkinson St, Detroit, MI 48202
$-152
Cash flow
-2.7%
Cash-on-Cash Return
5.5%
Cap rate
0.7%
Rent to Value Ratio
Active
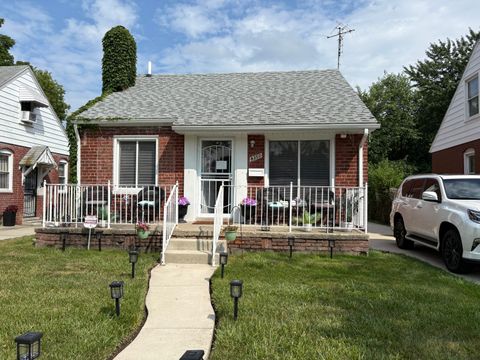
$85,000
2
bds
|
1
ba
|
1,458
sqft
|
built
1944
9438 Camley St, Detroit, MI 48224
$122
Cash flow
7.5%
Cash-on-Cash Return
7.9%
Cap rate
1.4%
Rent to Value Ratio
Active
$989,000
4
bds
|
3
ba
|
4,576
sqft
|
built
2004
2787 Moyer Rd, Williamston, MI 48895
$-2,770
Cash flow
-14.6%
Cash-on-Cash Return
2.8%
Cap rate
0.4%
Rent to Value Ratio
Active
$639,900
3
bds
|
2
ba
|
2,689
sqft
|
built
1979
8994 Lenhards Lndg, Clarksville, MI 48815
$-1,827
Cash flow
-14.9%
Cash-on-Cash Return
2.7%
Cap rate
0.5%
Rent to Value Ratio
Active
$378,000
4
bds
|
3
ba
|
1,448
sqft
|
built
1991
2502 Thorn Creek St SE, Kentwood, MI 49508
$-615
Cash flow
-8.5%
Cash-on-Cash Return
4.2%
Cap rate
0.6%
Rent to Value Ratio
Active
$283,000
3
bds
|
2
ba
|
2,000
sqft
|
built
1958
2865 Carrie Ln, Saint Joseph, MI 49085
$-281
Cash flow
-5.2%
Cash-on-Cash Return
5.0%
Cap rate
0.7%
Rent to Value Ratio
Active
$525,000
4
bds
|
4
ba
|
5,263
sqft
|
built
2001
150 Glen Carin Dr NE, Rockford, MI 49341
$-1,033
Cash flow
-10.3%
Cash-on-Cash Return
3.8%
Cap rate
0.6%
Rent to Value Ratio
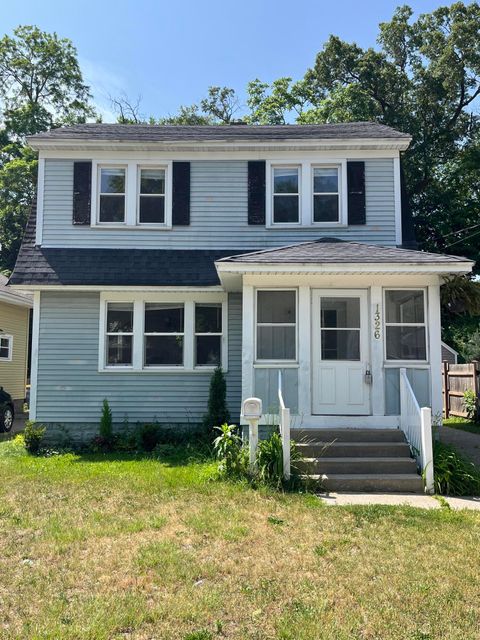
Active
$239,900
4
bds
|
2
ba
|
1,336
sqft
|
built
1929
1326 Dickinson St SE, Grand Rapids, MI 49507
$-146
Cash flow
-3.2%
Cash-on-Cash Return
5.4%
Cap rate
0.8%
Rent to Value Ratio
Active
$85,000
1
bds
|
1
ba
|
1,452
sqft
|
built
1944
9280 Camley St, Detroit, MI 48224
$221
Cash flow
13.6%
Cash-on-Cash Return
9.3%
Cap rate
1.4%
Rent to Value Ratio
Active
$925,000
3
bds
|
2
ba
|
2,040
sqft
|
built
1920
23675 N Shore Dr, Edwardsburg, MI 49112
$-3,387
Cash flow
-19.1%
Cash-on-Cash Return
1.8%
Cap rate
0.3%
Rent to Value Ratio
Active
$95,000
4
bds
|
2
ba
|
1,440
sqft
|
built
1944
9200 Camley St, Detroit, MI 48224
$192
Cash flow
10.5%
Cash-on-Cash Return
8.6%
Cap rate
1.3%
Rent to Value Ratio
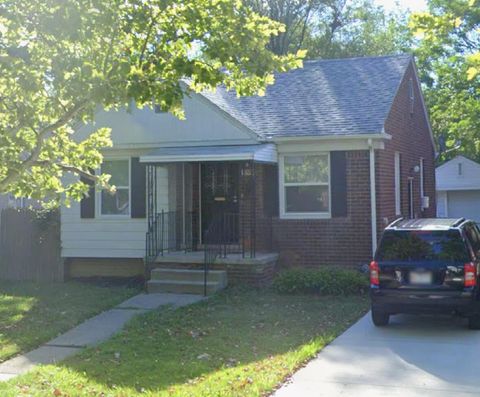
Active
$139,000
3
bds
|
3
ba
|
1,900
sqft
|
built
1928
14311 Forrer St, Detroit, MI 48227
$99
Cash flow
3.7%
Cash-on-Cash Return
7.0%
Cap rate
1.2%
Rent to Value Ratio
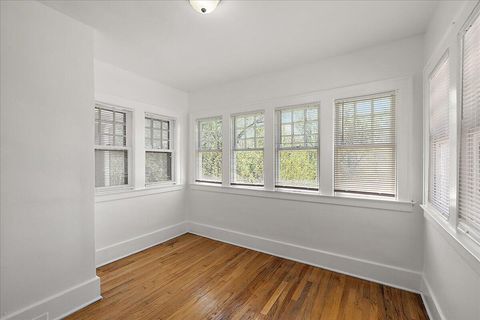
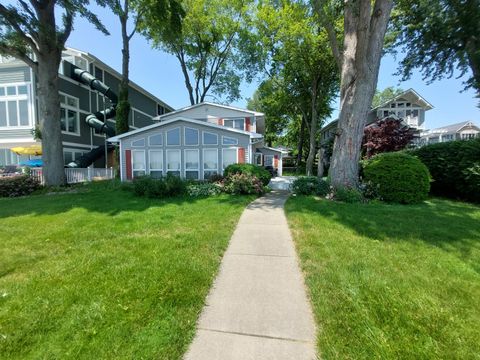
Active
$299,900
2
bds
|
1
ba
|
928
sqft
|
built
2005
17295 Stevens Forest Lake St, Cassopolis, MI 49031
$-887
Cash flow
-15.4%
Cash-on-Cash Return
2.6%
Cap rate
0.5%
Rent to Value Ratio
Active
$1,290,000
5
bds
|
6
ba
|
6,797
sqft
|
built
2000
5011 Rockaway Ln, Clarkston, MI 48348
$-5,292
Cash flow
-21.4%
Cash-on-Cash Return
1.2%
Cap rate
0.3%
Rent to Value Ratio
Active
$520,000
4
bds
|
2
ba
|
1,389
sqft
|
built
1974
61626 Colony Bay Dr, Cassopolis, MI 49031
$-1,980
Cash flow
-19.9%
Cash-on-Cash Return
1.6%
Cap rate
0.4%
Rent to Value Ratio
Active
$335,000
3
bds
|
2
ba
|
1,966
sqft
|
built
1959
2729 Horton Ct, Niles, MI 49120
$-638
Cash flow
-9.9%
Cash-on-Cash Return
3.9%
Cap rate
0.5%
Rent to Value Ratio
Active
$290,000
3
bds
|
2
ba
|
1,606
sqft
|
built
1956
511 Lane St, Chelsea, MI 48118
$-166
Cash flow
-3.0%
Cash-on-Cash Return
5.5%
Cap rate
0.9%
Rent to Value Ratio

Active
$995,000
4
bds
|
5
ba
|
4,135
sqft
|
built
1922
60 Lafayette Ave NE, Grand Rapids, MI 49503
$-3,076
Cash flow
-16.1%
Cash-on-Cash Return
2.4%
Cap rate
0.4%
Rent to Value Ratio

Active
$99,500
2
bds
|
2
ba
|
1,488
sqft
|
built
1929
52 Roseneath Ave, Battle Creek, MI 49037
$112
Cash flow
5.9%
Cash-on-Cash Return
7.5%
Cap rate
1.1%
Rent to Value Ratio

Active
$260,000
4
bds
|
1
ba
|
1,392
sqft
|
built
1900
20821 J Dr N, Marshall, MI 49068
$-347
Cash flow
-7.0%
Cash-on-Cash Return
4.5%
Cap rate
0.6%
Rent to Value Ratio

Active
$239,000
2
bds
|
1
ba
|
650
sqft
|
built
1945
501 Sherwood Ave, Three Oaks, MI 49128
$-507
Cash flow
-11.1%
Cash-on-Cash Return
3.6%
Cap rate
0.5%
Rent to Value Ratio

Active
$512,000
4
bds
|
4
ba
|
2,643
sqft
|
built
2006
8474 Twin Lakes Dr, Jenison, MI 49428
$-1,039
Cash flow
-10.6%
Cash-on-Cash Return
3.7%
Cap rate
0.6%
Rent to Value Ratio
Active
$85,000
2
bds
|
1
ba
|
1,449
sqft
|
built
1943
9350 Sanilac St, Detroit, MI 48224
$313
Cash flow
19.2%
Cash-on-Cash Return
10.6%
Cap rate
1.5%
Rent to Value Ratio
Active
$159,900
3
bds
|
1
ba
|
1,520
sqft
|
built
1928
23077 Piper Ave, Eastpointe, MI 48021
$-272
Cash flow
-8.9%
Cash-on-Cash Return
4.1%
Cap rate
0.8%
Rent to Value Ratio
Active
$599,900
4
bds
|
4
ba
|
3,630
sqft
|
built
1996
6185 Willow Run Dr, Battle Creek, MI 49014
$-1,336
Cash flow
-11.6%
Cash-on-Cash Return
3.5%
Cap rate
0.5%
Rent to Value Ratio