Miami, FL Investment Properties for Sale
Browse homes for sale and investment properties in Miami, FL. Refine your search by price, property type, or more.
Best cash flowing properties in Miami, FL
Active
$199,900
2
bds
|
1
ba
|
870
sqft
|
built
1983
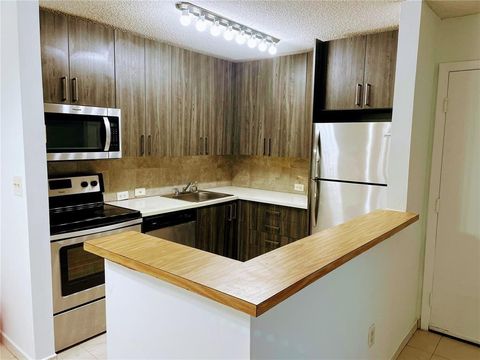
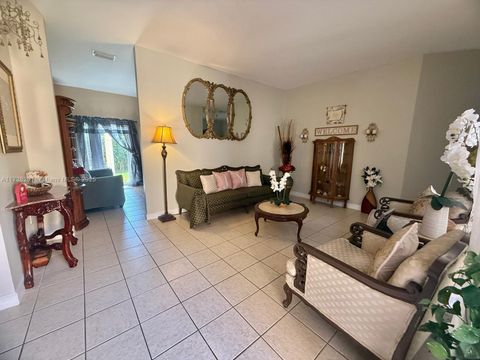
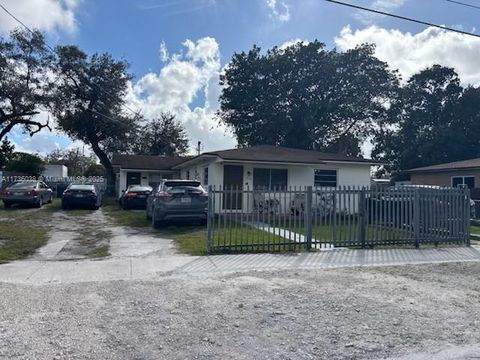
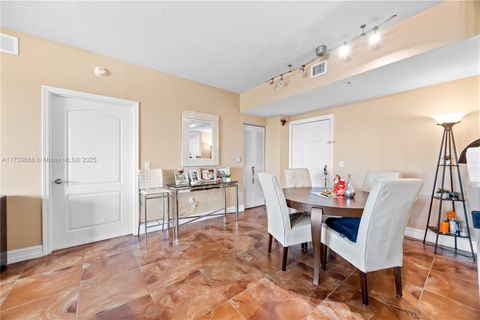
771 NE 199th St, Miami, FL 33179
$128
Cash flow
3.3%
Cash-on-Cash Return
6.9%
Cap rate
1.0%
Rent to Value Ratio

Active
$319,000
2
bds
|
2
ba
|
946
sqft
|
built
1976
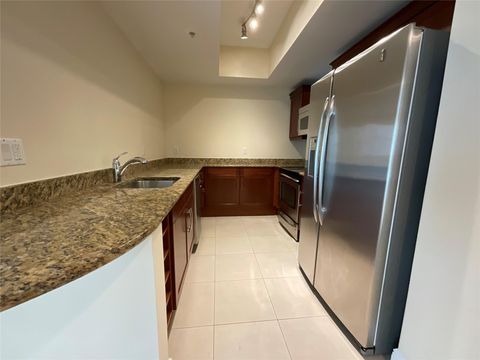
9440 W Flagler St, Miami, FL 33174
$-179
Cash flow
-2.9%
Cash-on-Cash Return
5.5%
Cap rate
0.8%
Rent to Value Ratio
6,455 out of 7,312 properties for sale in Miami, FL
Limited Results Shown
Create a free account, or log in to reveal all property listings and enjoy the complete experience.

Active
$875,000
2
bds
|
2
ba
|
809
sqft
|
built
2023
239 SW 9th St, Miami, FL 33130
$-1,256
Cash flow
-7.5%
Cash-on-Cash Return
4.4%
Cap rate
0.8%
Rent to Value Ratio

Active
$1,390,000
2
bds
|
2
ba
|
955
sqft
|
built
2023
700 NE 26th Ter, Miami, FL 33137
$-3,369
Cash flow
-12.6%
Cash-on-Cash Return
3.2%
Cap rate
0.6%
Rent to Value Ratio

Active
$1,840,000
2
bds
|
2
ba
|
1,700
sqft
|
built
1993
2127 Brickell Ave, Miami, FL 33129
$-9,708
Cash flow
-27.5%
Cash-on-Cash Return
-0.2%
Cap rate
0.3%
Rent to Value Ratio
Active
$1,950,000
3
bds
|
4
ba
|
1,685
sqft
|
built
2019
1000 Brickell Ave, Miami, FL 33131
$-7,098
Cash flow
-19.0%
Cash-on-Cash Return
1.8%
Cap rate
0.6%
Rent to Value Ratio

Active
$1,080,000
3
bds
|
2
ba
|
1,510
sqft
|
built
2001
1155 Brickell Bay Dr, Miami, FL 33131
$-4,957
Cash flow
-23.9%
Cash-on-Cash Return
0.6%
Cap rate
0.5%
Rent to Value Ratio
Active
$1,458,000
3
bds
|
4
ba
|
1,526
sqft
|
built
2018
3131 NE 7th Ave, Miami, FL 33137
$-5,294
Cash flow
-18.9%
Cash-on-Cash Return
1.8%
Cap rate
0.6%
Rent to Value Ratio
Active
$1,750,000
12
bds
|
0
ba
|
4,176
sqft
|
built
1924
121 NE 55th St, Miami, FL 33137
$-7,761
Cash flow
-23.1%
Cash-on-Cash Return
0.8%
Cap rate
0.2%
Rent to Value Ratio
Active
$579,000
4
bds
|
2
ba
|
1,804
sqft
|
built
2007
11224 SW 231st Ln, Miami, FL 33170
$-885
Cash flow
-8.0%
Cash-on-Cash Return
4.3%
Cap rate
0.6%
Rent to Value Ratio
Active
$355,000
1
bds
|
2
ba
|
1,042
sqft
|
built
1965
770 NE 69th St, Miami, FL 33138
$-1,418
Cash flow
-20.8%
Cash-on-Cash Return
1.4%
Cap rate
0.9%
Rent to Value Ratio

Active
$369,000
1
bds
|
2
ba
|
836
sqft
|
built
1982
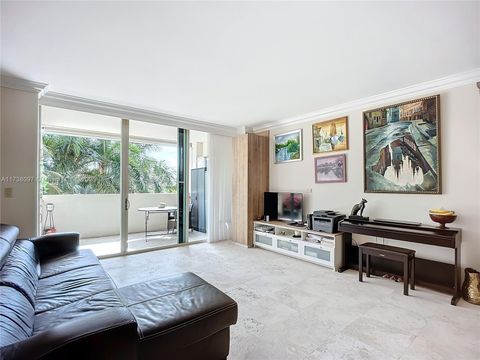
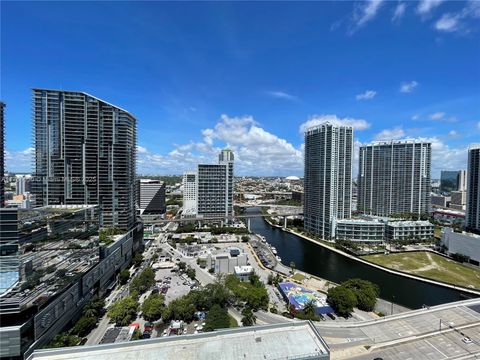
520 Brickell Key Dr, Miami, FL 33131
$-1,496
Cash flow
-21.2%
Cash-on-Cash Return
1.3%
Cap rate
0.8%
Rent to Value Ratio

Active
$890,000
2
bds
|
2
ba
|
1,026
sqft
|
built
2017
55 SW 9th St, Miami, FL 33130
$-3,926
Cash flow
-23.0%
Cash-on-Cash Return
0.9%
Cap rate
0.5%
Rent to Value Ratio
Active
$360,000
2
bds
|
3
ba
|
1,310
sqft
|
built
1976
6455 SW 116th Pl, Miami, FL 33173
$-757
Cash flow
-11.0%
Cash-on-Cash Return
3.6%
Cap rate
0.8%
Rent to Value Ratio

Active
$379,900
2
bds
|
3
ba
|
940
sqft
|
built
1984
8430 NW 8th St, Miami, FL 33126
$-854
Cash flow
-11.7%
Cash-on-Cash Return
3.6%
Cap rate
0.7%
Rent to Value Ratio
Active
$824,000
1
bds
|
2
ba
|
1,060
sqft
|
built
2001
3400 SW 27th Ave, Miami, FL 33133
$-3,415
Cash flow
-21.6%
Cash-on-Cash Return
1.3%
Cap rate
0.6%
Rent to Value Ratio

Active
$5,200,000
6
bds
|
5
ba
|
4,222
sqft
|
built
1996
4191 Lybyer Ave, Miami, FL 33133
$-21,827
Cash flow
-21.9%
Cash-on-Cash Return
1.1%
Cap rate
0.2%
Rent to Value Ratio

Active
$550,000
1
bds
|
2
ba
|
1,460
sqft
|
built
1993
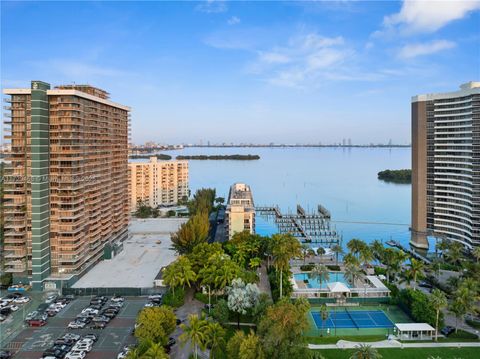
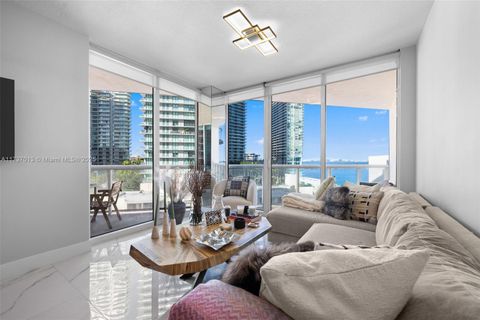
3600 Yacht Club Dr, Miami, FL 33180
$-1,980
Cash flow
-18.8%
Cash-on-Cash Return
1.8%
Cap rate
0.7%
Rent to Value Ratio

Active
$530,000
1
bds
|
2
ba
|
618
sqft
|
built
2018
501 NE 31st St, Miami, FL 33137
$-1,822
Cash flow
-17.9%
Cash-on-Cash Return
2.0%
Cap rate
0.7%
Rent to Value Ratio
Active
$430,000
2
bds
|
2
ba
|
979
sqft
|
built
2008
7275 SW 90th Way, Miami, FL 33156
$-1,538
Cash flow
-18.7%
Cash-on-Cash Return
1.9%
Cap rate
0.7%
Rent to Value Ratio

Active
$495,000
2
bds
|
2
ba
|
1,074
sqft
|
built
2005
2775 NE 187th St, Miami, FL 33180
$-1,859
Cash flow
-19.6%
Cash-on-Cash Return
1.6%
Cap rate
0.6%
Rent to Value Ratio

Active
$715,000
2
bds
|
2
ba
|
1,073
sqft
|
built
2015
460 NE 28th St, Miami, FL 33137
$-1,631
Cash flow
-11.9%
Cash-on-Cash Return
3.4%
Cap rate
0.9%
Rent to Value Ratio

Active
$690,000
3
bds
|
3
ba
|
1,575
sqft
|
built
2007
3232 SW 22nd Ter, Miami, FL 33145
$-2,496
Cash flow
-18.9%
Cash-on-Cash Return
1.8%
Cap rate
0.7%
Rent to Value Ratio

Active
$1,899,990
5
bds
|
4
ba
|
2,936
sqft
|
built
1925
1535 SW 13th St, Miami, FL 33145
$-5,381
Cash flow
-14.8%
Cash-on-Cash Return
2.7%
Cap rate
0.4%
Rent to Value Ratio
Active
$675,000
5
bds
|
0
ba
|
2,039
sqft
|
built
1975
2430 NW 99th St, Miami, FL 33147
$-2,459
Cash flow
-19.0%
Cash-on-Cash Return
1.8%
Cap rate
0.3%
Rent to Value Ratio
Active
$230,000
2
bds
|
2
ba
|
1,156
sqft
|
built
1970
1101 NE 191st St, Miami, FL 33179
$-298
Cash flow
-6.8%
Cash-on-Cash Return
4.6%
Cap rate
1.1%
Rent to Value Ratio
Active
$555,000
4
bds
|
4
ba
|
1,775
sqft
|
built
2004
15057 SW 9th Ter, Miami, FL 33194
$-1,202
Cash flow
-11.3%
Cash-on-Cash Return
3.5%
Cap rate
0.6%
Rent to Value Ratio
Active
$460,000
2
bds
|
2
ba
|
1,085
sqft
|
built
1973
1420 Brickell Bay Dr, Miami, FL 33131
$-1,688
Cash flow
-19.1%
Cash-on-Cash Return
1.7%
Cap rate
0.7%
Rent to Value Ratio
Active
$240,000
1
bds
|
1
ba
|
850
sqft
|
built
1973
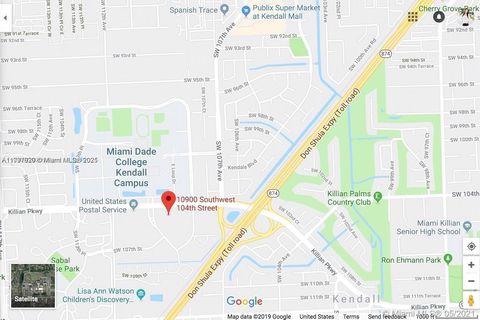
10900 SW 104th St, Miami, FL 33176
$-649
Cash flow
-14.1%
Cash-on-Cash Return
2.9%
Cap rate
0.8%
Rent to Value Ratio

Active
$799,000
3
bds
|
3
ba
|
1,550
sqft
|
built
2022
3501 NW 11th Ct, Miami, FL 33127
$-2,526
Cash flow
-16.5%
Cash-on-Cash Return
2.4%
Cap rate
0.5%
Rent to Value Ratio
Active
$1,050,000
3
bds
|
2
ba
|
1,793
sqft
|
built
1950
3521 SW 18th Ter, Miami, FL 33145
$-2,294
Cash flow
-11.4%
Cash-on-Cash Return
3.5%
Cap rate
0.5%
Rent to Value Ratio

Active
$575,000
1
bds
|
1
ba
|
877
sqft
|
built
2015
1100 S Miami Ave, Miami, FL 33130
$-1,989
Cash flow
-18.0%
Cash-on-Cash Return
2.0%
Cap rate
0.6%
Rent to Value Ratio
Active
$629,000
3
bds
|
3
ba
|
1,766
sqft
|
built
1978
10915 SW 134th Ct, Miami, FL 33186
$-1,336
Cash flow
-11.1%
Cash-on-Cash Return
3.6%
Cap rate
0.6%
Rent to Value Ratio
Active
$319,000
2
bds
|
2
ba
|
946
sqft
|
built
1976
9440 W Flagler St, Miami, FL 33174
$-179
Cash flow
-2.9%
Cash-on-Cash Return
5.5%
Cap rate
0.8%
Rent to Value Ratio
Active
$199,900
2
bds
|
1
ba
|
870
sqft
|
built
1983
771 NE 199th St, Miami, FL 33179
$128
Cash flow
3.3%
Cash-on-Cash Return
6.9%
Cap rate
1.0%
Rent to Value Ratio
Active
$448,000
2
bds
|
2
ba
|
1,028
sqft
|
built
2006
117 NW 42nd Ave, Miami, FL 33126
$-1,017
Cash flow
-11.8%
Cash-on-Cash Return
3.4%
Cap rate
0.7%
Rent to Value Ratio
Active
$745,000
1
bds
|
2
ba
|
976
sqft
|
built
2016
68 SE 6th St, Miami, FL 33131
$-2,533
Cash flow
-17.7%
Cash-on-Cash Return
2.1%
Cap rate
0.6%
Rent to Value Ratio

Active
$990,000
2
bds
|
3
ba
|
1,477
sqft
|
built
2009
1100 Biscayne Blvd, Miami, FL 33132
$-3,904
Cash flow
-20.6%
Cash-on-Cash Return
1.4%
Cap rate
0.6%
Rent to Value Ratio
Active
$159,000
1
bds
|
1
ba
|
730
sqft
|
built
1970
505 NW 177th St, Miami, FL 33169
$-396
Cash flow
-13.0%
Cash-on-Cash Return
3.2%
Cap rate
1.1%
Rent to Value Ratio

Active
$309,900
1
bds
|
1
ba
|
685
sqft
|
built
2005
234 NE 3rd St, Miami, FL 33132
$-1,269
Cash flow
-21.4%
Cash-on-Cash Return
1.2%
Cap rate
0.7%
Rent to Value Ratio
Active
$535,000
1
bds
|
2
ba
|
828
sqft
|
built
2006
480 NE 30th St, Miami, FL 33137
$-1,145
Cash flow
-11.2%
Cash-on-Cash Return
3.6%
Cap rate
0.8%
Rent to Value Ratio
Active
$1,550,000
5
bds
|
4
ba
|
2,612
sqft
|
built
2005
19246 SW 132nd Ave, Miami, FL 33177
$-2,694
Cash flow
-9.1%
Cash-on-Cash Return
4.1%
Cap rate
0.6%
Rent to Value Ratio