Miami Beach, FL Investment Properties for Sale
Browse homes for sale and investment properties in Miami Beach, FL. Refine your search by price, property type, or more.
Best cash flowing properties in Miami Beach, FL
Active
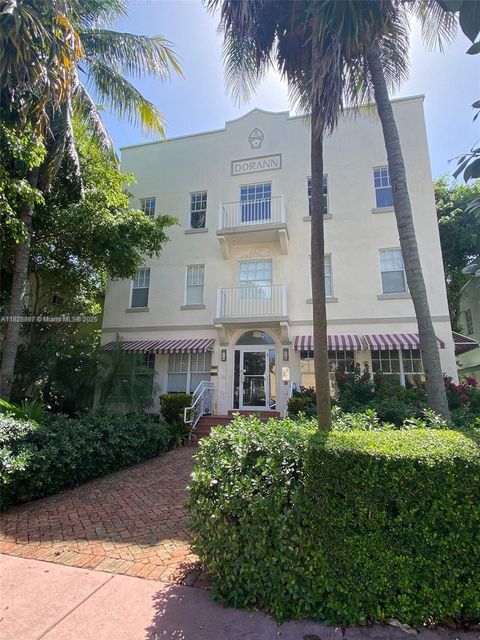
$209,000
0
bds
|
1
ba
|
370
sqft
|
built
1925
1244 Pennsylvania Ave, Miami Beach, FL 33139
$-251
Cash flow
-6.3%
Cash-on-Cash Return
4.8%
Cap rate
0.9%
Rent to Value Ratio
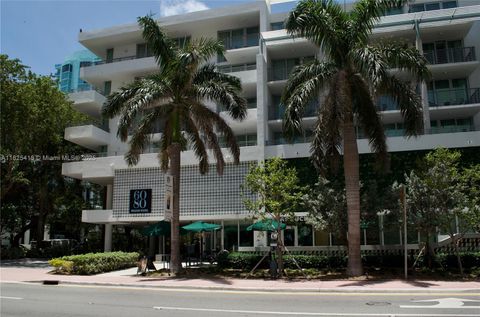
Active
$394,900
1
bds
|
1
ba
|
437
sqft
|
built
2019
6080 Collins Ave, Miami Beach, FL 33140
$-470
Cash flow
-6.2%
Cash-on-Cash Return
4.8%
Cap rate
1.1%
Rent to Value Ratio
2,024 out of 2,234 properties for sale in Miami Beach, FL
Limited Results Shown
Create a free account, or log in to reveal all property listings and enjoy the complete experience.
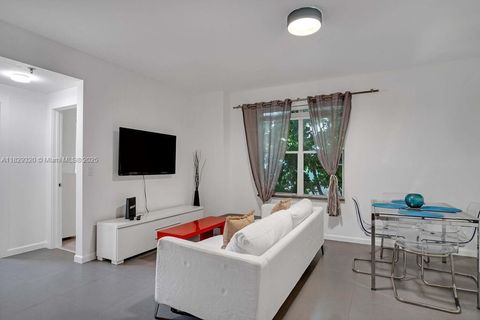
Active
$465,000
2
bds
|
2
ba
|
905
sqft
|
built
1925
747 Michigan Ave, Miami Beach, FL 33139
$-1,473
Cash flow
-16.5%
Cash-on-Cash Return
2.5%
Cap rate
0.8%
Rent to Value Ratio
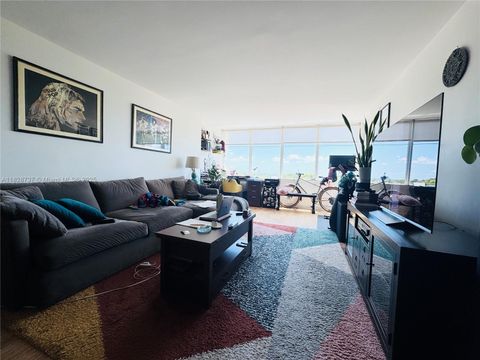
Active
$280,000
1
bds
|
2
ba
|
864
sqft
|
built
1967
8233 Harding Ave, Miami Beach, FL 33141
$-518
Cash flow
-9.7%
Cash-on-Cash Return
4.0%
Cap rate
0.9%
Rent to Value Ratio
Active
$499,900
2
bds
|
2
ba
|
760
sqft
|
built
1930
810 11th St, Miami Beach, FL 33139
$-1,289
Cash flow
-13.5%
Cash-on-Cash Return
3.2%
Cap rate
0.7%
Rent to Value Ratio

Active
$6,700,000
3
bds
|
3
ba
|
1,588
sqft
|
built
2004
101 20th St, Miami Beach, FL 33139
$-42,533
Cash flow
-33.1%
Cash-on-Cash Return
-1.4%
Cap rate
0.1%
Rent to Value Ratio
Active
$270,000
0
bds
|
1
ba
|
590
sqft
|
built
1966
800 West Ave, Miami Beach, FL 33139
$-779
Cash flow
-15.1%
Cash-on-Cash Return
2.8%
Cap rate
0.9%
Rent to Value Ratio
Active
$209,000
0
bds
|
1
ba
|
370
sqft
|
built
1925
1244 Pennsylvania Ave, Miami Beach, FL 33139
$-251
Cash flow
-6.3%
Cash-on-Cash Return
4.8%
Cap rate
0.9%
Rent to Value Ratio

Active
$1,499,900
3
bds
|
2
ba
|
1,270
sqft
|
built
1995
208 Jefferson Ave, Miami Beach, FL 33139
$-5,782
Cash flow
-20.1%
Cash-on-Cash Return
1.6%
Cap rate
0.3%
Rent to Value Ratio
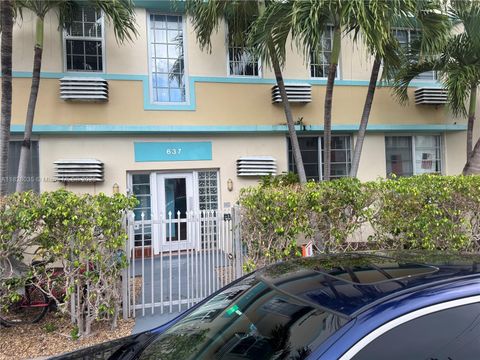
Active
$250,000
1
bds
|
1
ba
|
420
sqft
|
built
1939
637 12th St, Miami Beach, FL 33139
$-704
Cash flow
-14.7%
Cash-on-Cash Return
2.9%
Cap rate
0.8%
Rent to Value Ratio
Active
$280,000
1
bds
|
1
ba
|
740
sqft
|
built
1970
716 Michigan Ave, Miami Beach, FL 33139
$-935
Cash flow
-17.4%
Cash-on-Cash Return
2.3%
Cap rate
0.8%
Rent to Value Ratio
Active
$6,490,000
3
bds
|
5
ba
|
3,227
sqft
|
built
1986
2443 Fisher Island Dr, Miami Beach, FL 33109
$-40,334
Cash flow
-32.4%
Cash-on-Cash Return
-1.2%
Cap rate
0.1%
Rent to Value Ratio
Active
$239,000
1
bds
|
1
ba
|
436
sqft
|
built
2008
1550 Pennsylvania Ave, Miami Beach, FL 33139
$-662
Cash flow
-14.5%
Cash-on-Cash Return
2.8%
Cap rate
0.8%
Rent to Value Ratio
Active
$1,200,000
4
bds
|
0
ba
|
2,464
sqft
|
built
1950
740 84th St, Miami Beach, FL 33141
$-5,250
Cash flow
-22.8%
Cash-on-Cash Return
1.0%
Cap rate
0.3%
Rent to Value Ratio
Active
$6,200,000
4
bds
|
3
ba
|
3,934
sqft
|
built
1951
1375 N Biscayne Point Rd, Miami Beach, FL 33141
$-33,749
Cash flow
-28.4%
Cash-on-Cash Return
-0.3%
Cap rate
0.1%
Rent to Value Ratio
Active
$3,200,000
5
bds
|
5
ba
|
2,955
sqft
|
built
1949
4444 Adams Ave, Miami Beach, FL 33140
$-13,732
Cash flow
-22.4%
Cash-on-Cash Return
1.0%
Cap rate
0.3%
Rent to Value Ratio
Active
$2,695,000
2
bds
|
3
ba
|
1,750
sqft
|
built
2005
450 Alton Rd, Miami Beach, FL 33139
$-14,207
Cash flow
-27.5%
Cash-on-Cash Return
-0.1%
Cap rate
0.3%
Rent to Value Ratio
Active
$1,100,000
2
bds
|
2
ba
|
1,175
sqft
|
built
2016
6620 Indian Creek Dr, Miami Beach, FL 33141
$-4,739
Cash flow
-22.5%
Cash-on-Cash Return
1.1%
Cap rate
0.5%
Rent to Value Ratio

Active
$689,900
2
bds
|
2
ba
|
1,121
sqft
|
built
1980
2401 Collins Ave, Miami Beach, FL 33140
$-2,807
Cash flow
-21.2%
Cash-on-Cash Return
1.3%
Cap rate
0.5%
Rent to Value Ratio
Active
$1,200,000
4
bds
|
0
ba
|
2,464
sqft
|
built
1950
750 84th St, Miami Beach, FL 33141
$-5,181
Cash flow
-22.5%
Cash-on-Cash Return
1.1%
Cap rate
0.3%
Rent to Value Ratio
Active
$497,000
2
bds
|
2
ba
|
1,145
sqft
|
built
1964
7441 Wayne Ave, Miami Beach, FL 33141
$-781
Cash flow
-8.2%
Cash-on-Cash Return
4.3%
Cap rate
0.6%
Rent to Value Ratio
Active
$465,000
1
bds
|
1
ba
|
659
sqft
|
built
1970
401 Ocean Dr, Miami Beach, FL 33139
$-2,014
Cash flow
-22.6%
Cash-on-Cash Return
1.1%
Cap rate
0.6%
Rent to Value Ratio

Active
$9,995,000
5
bds
|
6
ba
|
3,326
sqft
|
built
2020
1311 Stillwater Dr, Miami Beach, FL 33141
$-56,213
Cash flow
-29.3%
Cash-on-Cash Return
-0.5%
Cap rate
0.1%
Rent to Value Ratio
Active
$490,000
2
bds
|
2
ba
|
1,287
sqft
|
built
1970
401 69th St, Miami Beach, FL 33141
$-2,330
Cash flow
-24.8%
Cash-on-Cash Return
0.6%
Cap rate
0.6%
Rent to Value Ratio
Active
$249,000
1
bds
|
1
ba
|
534
sqft
|
built
1940
810 7th St, Miami Beach, FL 33139
$-848
Cash flow
-17.8%
Cash-on-Cash Return
2.2%
Cap rate
0.8%
Rent to Value Ratio

Active
$8,500,000
3
bds
|
4
ba
|
2,374
sqft
|
built
2021
1300 Monad Ter, Miami Beach, FL 33139
$-47,489
Cash flow
-29.1%
Cash-on-Cash Return
-0.4%
Cap rate
0.1%
Rent to Value Ratio
Active
$535,000
1
bds
|
2
ba
|
950
sqft
|
built
1967
5 Island Ave, Miami Beach, FL 33139
$-1,697
Cash flow
-16.5%
Cash-on-Cash Return
2.5%
Cap rate
0.7%
Rent to Value Ratio
Active
$299,000
1
bds
|
1
ba
|
748
sqft
|
built
1970
947 Lenox Ave, Miami Beach, FL 33139
$-785
Cash flow
-13.7%
Cash-on-Cash Return
3.1%
Cap rate
0.8%
Rent to Value Ratio

Active
$1,999,999
2
bds
|
1
ba
|
1,186
sqft
|
built
1951
634 82nd St, Miami Beach, FL 33141
$-8,260
Cash flow
-21.5%
Cash-on-Cash Return
1.3%
Cap rate
0.2%
Rent to Value Ratio
Active
$515,000
2
bds
|
2
ba
|
858
sqft
|
built
1980
1900 Meridian Ave, Miami Beach, FL 33139
$-1,622
Cash flow
-16.4%
Cash-on-Cash Return
2.5%
Cap rate
0.6%
Rent to Value Ratio
Active
$325,000
1
bds
|
1
ba
|
722
sqft
|
built
1965
1698 Jefferson Ave, Miami Beach, FL 33139
$-1,046
Cash flow
-16.8%
Cash-on-Cash Return
2.4%
Cap rate
0.8%
Rent to Value Ratio
Active
$825,000
2
bds
|
2
ba
|
1,270
sqft
|
built
1996
1900 Purdy Ave, Miami Beach, FL 33139
$-2,376
Cash flow
-15.0%
Cash-on-Cash Return
2.7%
Cap rate
0.8%
Rent to Value Ratio

Active
$6,000,000
5
bds
|
4
ba
|
4,510
sqft
|
built
1962
2525 Flamingo Pl, Miami Beach, FL 33140
$-26,669
Cash flow
-23.2%
Cash-on-Cash Return
0.9%
Cap rate
0.1%
Rent to Value Ratio
Active
$394,900
1
bds
|
1
ba
|
437
sqft
|
built
2019
6080 Collins Ave, Miami Beach, FL 33140
$-470
Cash flow
-6.2%
Cash-on-Cash Return
4.8%
Cap rate
1.1%
Rent to Value Ratio
Active
$750,000
2
bds
|
2
ba
|
1,301
sqft
|
built
1967
5555 Collins Ave, Miami Beach, FL 33140
$-1,595
Cash flow
-11.1%
Cash-on-Cash Return
3.7%
Cap rate
0.9%
Rent to Value Ratio
Active
$275,000
1
bds
|
1
ba
|
627
sqft
|
built
1936
631 Euclid Ave, Miami Beach, FL 33139
$-950
Cash flow
-18.0%
Cash-on-Cash Return
2.1%
Cap rate
0.9%
Rent to Value Ratio

Active
$1,900,000
3
bds
|
4
ba
|
1,702
sqft
|
built
1956
830 Raymond St, Miami Beach, FL 33141
$-4,015
Cash flow
-11.0%
Cash-on-Cash Return
3.6%
Cap rate
0.5%
Rent to Value Ratio

Active
$945,000
2
bds
|
2
ba
|
1,440
sqft
|
built
1995
6301 Collins Ave, Miami Beach, FL 33141
$-3,944
Cash flow
-21.8%
Cash-on-Cash Return
1.1%
Cap rate
0.6%
Rent to Value Ratio
Active
$745,000
1
bds
|
2
ba
|
1,027
sqft
|
built
1972
11 Island Ave, Miami Beach, FL 33139
$-2,377
Cash flow
-16.6%
Cash-on-Cash Return
2.4%
Cap rate
0.5%
Rent to Value Ratio

Active
$199,900
1
bds
|
1
ba
|
431
sqft
|
built
1951
8420 Byron Ave, Miami Beach, FL 33141
$-501
Cash flow
-13.1%
Cash-on-Cash Return
3.1%
Cap rate
0.9%
Rent to Value Ratio
Active
$499,000
1
bds
|
1
ba
|
723
sqft
|
built
1966
1670 Lincoln Ct, Miami Beach, FL 33139
$-1,455
Cash flow
-15.2%
Cash-on-Cash Return
2.8%
Cap rate
0.8%
Rent to Value Ratio
Active
$335,000
1
bds
|
2
ba
|
912
sqft
|
built
1970
7135 Collins Ave, Miami Beach, FL 33141
$-1,452
Cash flow
-22.6%
Cash-on-Cash Return
1.1%
Cap rate
0.7%
Rent to Value Ratio