Miami Beach, FL Investment Properties for Sale
Browse homes for sale and investment properties in Miami Beach, FL. Refine your search by price, property type, or more.
Best cash flowing properties in Miami Beach, FL
Active
$375,000
2
bds
|
2
ba
|
1,175
sqft
|
built
1980
7801 Abbott Ave, Miami Beach, FL 33141
$-470
Cash flow
-6.5%
Cash-on-Cash Return
4.6%
Cap rate
0.9%
Rent to Value Ratio
Active
$315,000
1
bds
|
2
ba
|
865
sqft
|
built
1970
7118 Bonita Dr, Miami Beach, FL 33141
$-588
Cash flow
-9.7%
Cash-on-Cash Return
3.9%
Cap rate
0.8%
Rent to Value Ratio
2,000 out of 2,205 properties for sale in Miami Beach, FL
Limited Results Shown
Create a free account, or log in to reveal all property listings and enjoy the complete experience.

Active
$3,690,000
3
bds
|
5
ba
|
2,572
sqft
|
built
2005
5959 Collins Ave, Miami Beach, FL 33140
$-19,768
Cash flow
-28.0%
Cash-on-Cash Return
-0.3%
Cap rate
0.2%
Rent to Value Ratio

Active
$349,000
1
bds
|
2
ba
|
868
sqft
|
built
1975
1800 Collins Ave, Miami Beach, FL 33139
$-1,207
Cash flow
-18.0%
Cash-on-Cash Return
2.0%
Cap rate
0.7%
Rent to Value Ratio
Active
$360,000
1
bds
|
1
ba
|
530
sqft
|
built
1925
1542 Drexel Ave, Miami Beach, FL 33139
$-1,212
Cash flow
-17.6%
Cash-on-Cash Return
2.1%
Cap rate
0.6%
Rent to Value Ratio

Active
$179,900
0
bds
|
1
ba
|
406
sqft
|
built
1958
7720 Harding Ave, Miami Beach, FL 33141
$-596
Cash flow
-17.3%
Cash-on-Cash Return
2.2%
Cap rate
0.8%
Rent to Value Ratio

Active
$8,990,000
3
bds
|
4
ba
|
3,421
sqft
|
built
1940
6165 Pine Tree Dr, Miami Beach, FL 33140
$-43,117
Cash flow
-25.0%
Cash-on-Cash Return
0.4%
Cap rate
0.1%
Rent to Value Ratio
Active
$280,000
1
bds
|
1
ba
|
520
sqft
|
built
1925
1200 Euclid Ave, Miami Beach, FL 33139
$-751
Cash flow
-14.0%
Cash-on-Cash Return
2.9%
Cap rate
0.8%
Rent to Value Ratio
Active
$329,000
1
bds
|
1
ba
|
600
sqft
|
built
1959
101 Collins Ave, Miami Beach, FL 33139
$-1,094
Cash flow
-17.3%
Cash-on-Cash Return
2.2%
Cap rate
0.7%
Rent to Value Ratio

Active
$3,750,000
3
bds
|
4
ba
|
2,529
sqft
|
built
1945
7755 Noremac Ave, Miami Beach, FL 33141
$-15,430
Cash flow
-21.5%
Cash-on-Cash Return
1.2%
Cap rate
0.3%
Rent to Value Ratio
Active
$499,995
2
bds
|
2
ba
|
1,010
sqft
|
built
1983
1775 Washington Ave, Miami Beach, FL 33139
$-1,797
Cash flow
-18.8%
Cash-on-Cash Return
1.8%
Cap rate
0.8%
Rent to Value Ratio
Active
$950,000
1
bds
|
2
ba
|
1,260
sqft
|
built
1961
5055 Collins Ave, Miami Beach, FL 33140
$-4,284
Cash flow
-23.5%
Cash-on-Cash Return
0.7%
Cap rate
0.4%
Rent to Value Ratio
Active
$479,000
1
bds
|
2
ba
|
824
sqft
|
built
1969
5701 Collins Ave, Miami Beach, FL 33140
$-2,437
Cash flow
-26.5%
Cash-on-Cash Return
0.0%
Cap rate
0.6%
Rent to Value Ratio

Active
$1,795,000
4
bds
|
3
ba
|
1,900
sqft
|
built
1933
427 W 43rd St, Miami Beach, FL 33140
$-4,618
Cash flow
-13.4%
Cash-on-Cash Return
3.1%
Cap rate
0.5%
Rent to Value Ratio

Active
$642,000
2
bds
|
2
ba
|
982
sqft
|
built
1980
2924 Collins Ave, Miami Beach, FL 33140
$-2,733
Cash flow
-22.2%
Cash-on-Cash Return
1.0%
Cap rate
0.4%
Rent to Value Ratio
Active
$8,990,000
3
bds
|
4
ba
|
2,318
sqft
|
built
2015
102 24th St, Miami Beach, FL 33139
$-55,049
Cash flow
-31.9%
Cash-on-Cash Return
-1.2%
Cap rate
0.1%
Rent to Value Ratio
Active
$315,000
1
bds
|
1
ba
|
898
sqft
|
built
1970
401 69th St, Miami Beach, FL 33141
$-1,212
Cash flow
-20.1%
Cash-on-Cash Return
1.5%
Cap rate
0.8%
Rent to Value Ratio
Active
$575,000
2
bds
|
2
ba
|
1,350
sqft
|
built
1964
5005 Collins Ave, Miami Beach, FL 33140
$-2,880
Cash flow
-26.1%
Cash-on-Cash Return
0.1%
Cap rate
0.7%
Rent to Value Ratio
Active
$715,000
2
bds
|
2
ba
|
1,088
sqft
|
built
1980
1621 Collins Ave, Miami Beach, FL 33139
$-3,090
Cash flow
-22.5%
Cash-on-Cash Return
1.0%
Cap rate
0.5%
Rent to Value Ratio
Active
$359,000
1
bds
|
1
ba
|
837
sqft
|
built
1965
1200 West Ave, Miami Beach, FL 33139
$-1,020
Cash flow
-14.8%
Cash-on-Cash Return
2.7%
Cap rate
0.8%
Rent to Value Ratio
Active
$259,000
1
bds
|
1
ba
|
540
sqft
|
built
1968
533 Meridian Ave, Miami Beach, FL 33139
$-875
Cash flow
-17.6%
Cash-on-Cash Return
2.1%
Cap rate
0.7%
Rent to Value Ratio
Active
$315,000
1
bds
|
2
ba
|
865
sqft
|
built
1970
7118 Bonita Dr, Miami Beach, FL 33141
$-588
Cash flow
-9.7%
Cash-on-Cash Return
3.9%
Cap rate
0.8%
Rent to Value Ratio
Active
$695,000
1
bds
|
2
ba
|
966
sqft
|
built
2005
2001 Meridian Ave, Miami Beach, FL 33139
$-2,086
Cash flow
-15.7%
Cash-on-Cash Return
2.5%
Cap rate
0.7%
Rent to Value Ratio
Active
$6,495,000
4
bds
|
4
ba
|
5,052
sqft
|
built
1929
2050 Alton Rd, Miami Beach, FL 33140
$-29,493
Cash flow
-23.7%
Cash-on-Cash Return
0.7%
Cap rate
0.1%
Rent to Value Ratio
Active
$375,000
2
bds
|
2
ba
|
1,175
sqft
|
built
1980
7801 Abbott Ave, Miami Beach, FL 33141
$-470
Cash flow
-6.5%
Cash-on-Cash Return
4.6%
Cap rate
0.9%
Rent to Value Ratio
Active
$9,500,000
5
bds
|
3
ba
|
4,386
sqft
|
built
1957
1730 Bay Dr, Miami Beach, FL 33141
$-49,318
Cash flow
-27.1%
Cash-on-Cash Return
-0.1%
Cap rate
0.1%
Rent to Value Ratio
Active
$399,000
1
bds
|
2
ba
|
910
sqft
|
built
1968
6770 Indian Creek Dr, Miami Beach, FL 33141
$-1,267
Cash flow
-16.6%
Cash-on-Cash Return
2.3%
Cap rate
0.8%
Rent to Value Ratio
Active
$545,000
2
bds
|
2
ba
|
1,185
sqft
|
built
1983
2457 Collins Ave, Miami Beach, FL 33140
$-2,902
Cash flow
-27.8%
Cash-on-Cash Return
-0.2%
Cap rate
0.5%
Rent to Value Ratio

Active
$271,000
0
bds
|
1
ba
|
600
sqft
|
built
1966
800 West Ave, Miami Beach, FL 33139
$-1,291
Cash flow
-24.9%
Cash-on-Cash Return
0.4%
Cap rate
0.8%
Rent to Value Ratio
Active
$1,400,000
bds
|
1
ba
|
490
sqft
|
built
2009
2201 Collins Ave, Miami Beach, FL 33139
$-7,923
Cash flow
-29.5%
Cash-on-Cash Return
-0.6%
Cap rate
0.3%
Rent to Value Ratio

Active
$265,000
bds
|
1
ba
|
560
sqft
|
built
1966
800 West Ave, Miami Beach, FL 33139
$-839
Cash flow
-16.5%
Cash-on-Cash Return
2.3%
Cap rate
0.8%
Rent to Value Ratio
Active
$990,000
3
bds
|
2
ba
|
1,416
sqft
|
built
1948
1545 Normandy Dr, Miami Beach, FL 33141
$-2,322
Cash flow
-12.2%
Cash-on-Cash Return
3.3%
Cap rate
0.6%
Rent to Value Ratio
Active
$400,000
1
bds
|
1
ba
|
850
sqft
|
built
1966
800 West Ave, Miami Beach, FL 33139
$-1,150
Cash flow
-15.0%
Cash-on-Cash Return
2.7%
Cap rate
0.9%
Rent to Value Ratio
Active
$3,290,000
3
bds
|
3
ba
|
2,117
sqft
|
built
1952
800 E Dilido Dr, Miami Beach, FL 33139
$-12,833
Cash flow
-20.4%
Cash-on-Cash Return
1.5%
Cap rate
0.3%
Rent to Value Ratio
Active
$610,000
2
bds
|
2
ba
|
1,024
sqft
|
built
1940
600 Euclid Ave, Miami Beach, FL 33139
$-2,078
Cash flow
-17.8%
Cash-on-Cash Return
2.1%
Cap rate
0.7%
Rent to Value Ratio
Active
$1,499,500
2
bds
|
2
ba
|
1,658
sqft
|
built
2003
400 Alton Rd, Miami Beach, FL 33139
$-6,875
Cash flow
-23.9%
Cash-on-Cash Return
0.6%
Cap rate
0.5%
Rent to Value Ratio
Active
$1,450,000
1
bds
|
2
ba
|
850
sqft
|
built
1926
2301 Collins Ave, Miami Beach, FL 33139
$-6,014
Cash flow
-21.6%
Cash-on-Cash Return
1.2%
Cap rate
0.4%
Rent to Value Ratio
Active
$419,550
1
bds
|
1
ba
|
662
sqft
|
built
1970
345 Ocean Dr, Miami Beach, FL 33139
$-1,584
Cash flow
-19.7%
Cash-on-Cash Return
1.6%
Cap rate
0.7%
Rent to Value Ratio
Active
$295,000
bds
|
1
ba
|
566
sqft
|
built
1966
2899 Collins Ave, Miami Beach, FL 33140
$-877
Cash flow
-15.5%
Cash-on-Cash Return
2.6%
Cap rate
0.7%
Rent to Value Ratio
Active
$450,000
2
bds
|
2
ba
|
1,160
sqft
|
built
1972
6801 Indian Creek Dr, Miami Beach, FL 33141
$-1,477
Cash flow
-17.1%
Cash-on-Cash Return
2.2%
Cap rate
0.6%
Rent to Value Ratio
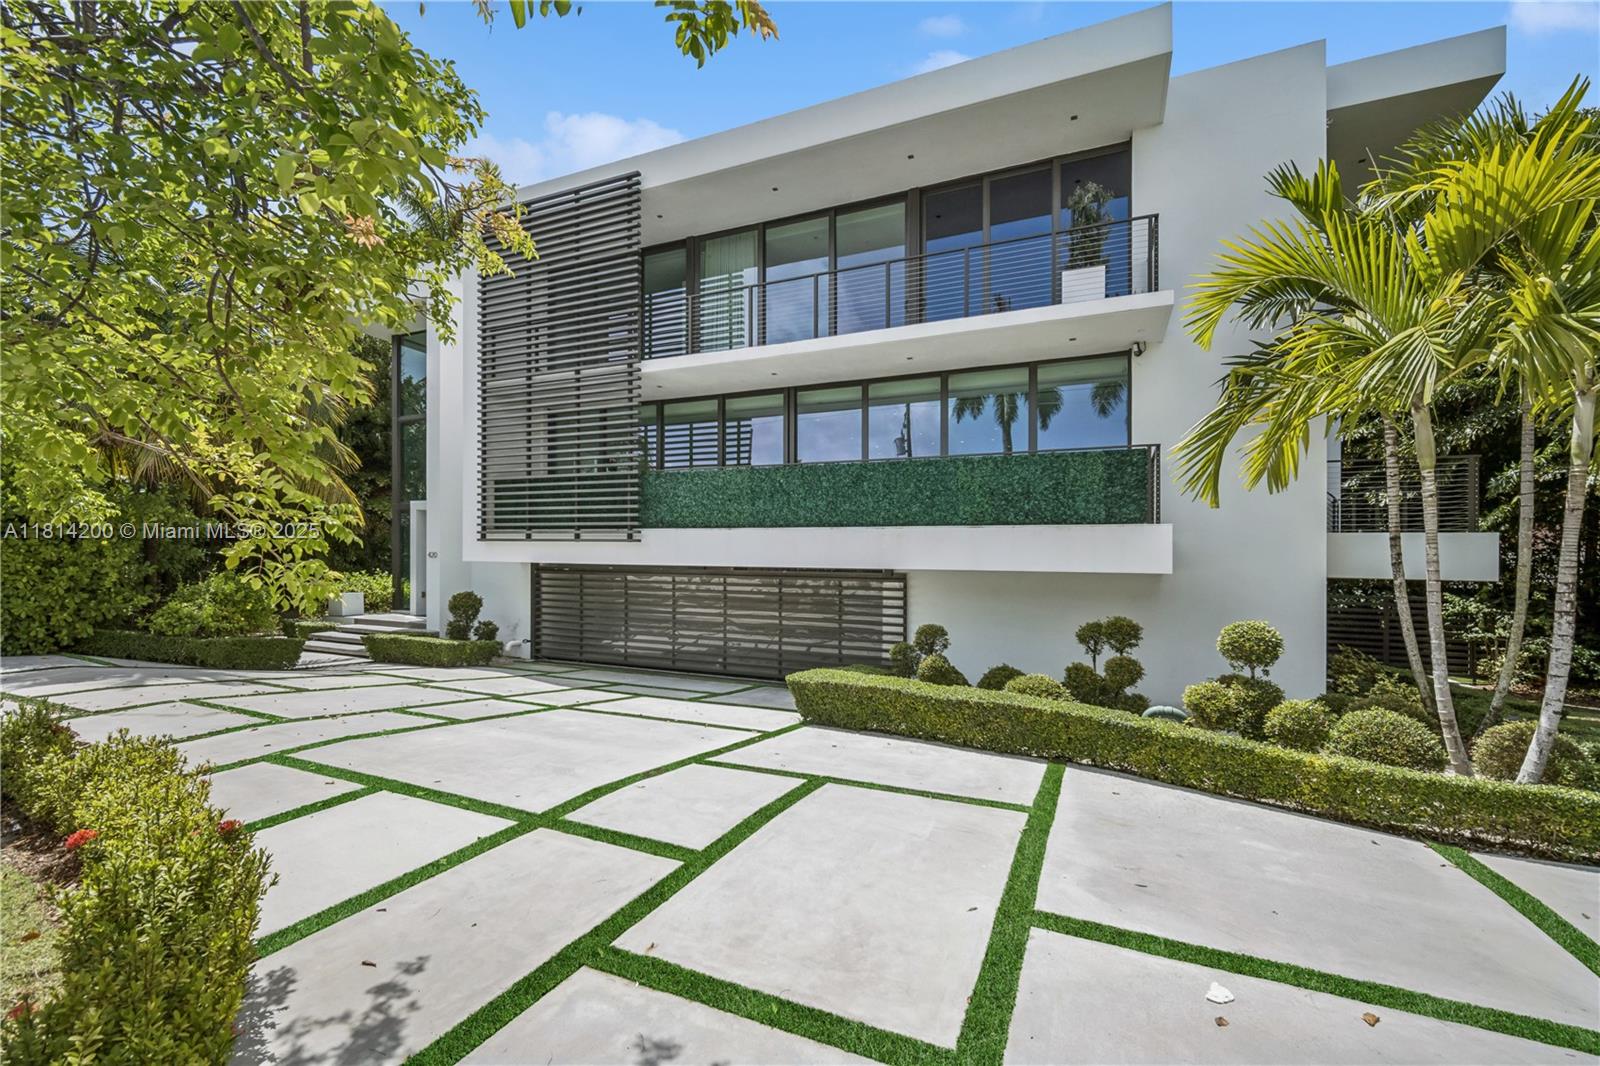
Active
$8,695,000
5
bds
|
7
ba
|
5,642
sqft
|
built
2019
420 N Hibiscus Dr, Miami Beach, FL 33139
$-47,713
Cash flow
-28.6%
Cash-on-Cash Return
-0.4%
Cap rate
0.1%
Rent to Value Ratio

Active
$425,000
1
bds
|
1
ba
|
410
sqft
|
built
1939
335 Ocean Dr, Miami Beach, FL 33139
$-1,257
Cash flow
-15.4%
Cash-on-Cash Return
2.6%
Cap rate
0.7%
Rent to Value Ratio