Miami, FL Investment Properties for Sale
Browse homes for sale and investment properties in Miami, FL. Refine your search by price, property type, or more.
Best cash flowing properties in Miami, FL

Active
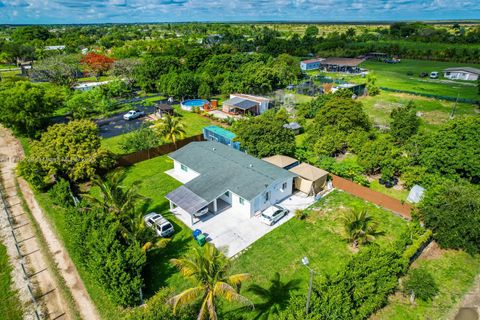
$245,000
1
bds
|
2
ba
|
1,125
sqft
|
built
1972
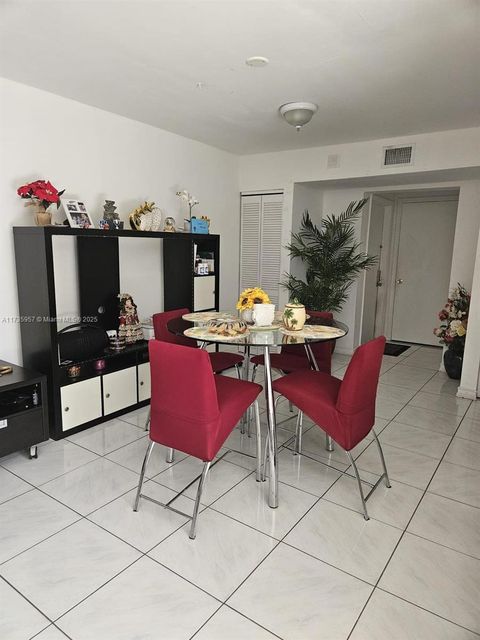
9365 Fontainebleau Blvd, Miami, FL 33172
$139
Cash flow
3.0%
Cash-on-Cash Return
6.8%
Cap rate
1.0%
Rent to Value Ratio

Active
$249,000
3
bds
|
2
ba
|
1,010
sqft
|
built
2000
14040 NE 3rd Ct, Miami, FL 33161
$-172
Cash flow
-3.6%
Cash-on-Cash Return
5.3%
Cap rate
1.0%
Rent to Value Ratio
6,455 out of 7,312 properties for sale in Miami, FL
Limited Results Shown
Create a free account, or log in to reveal all property listings and enjoy the complete experience.
Active
$249,900
2
bds
|
1
ba
|
828
sqft
|
built
1984
8255 SW 152nd Ave, Miami, FL 33193
$-598
Cash flow
-12.5%
Cash-on-Cash Return
3.3%
Cap rate
0.8%
Rent to Value Ratio
Active
$429,900
1
bds
|
1
ba
|
736
sqft
|
built
2008
90 SW 3rd St, Miami, FL 33130
$-1,081
Cash flow
-13.1%
Cash-on-Cash Return
3.1%
Cap rate
0.7%
Rent to Value Ratio

Active
$684,999
4
bds
|
2
ba
|
1,300
sqft
|
built
1946
237 NE 110th Ter, Miami, FL 33161
$-731
Cash flow
-5.6%
Cash-on-Cash Return
4.9%
Cap rate
0.7%
Rent to Value Ratio

Active
$3,999,000
5
bds
|
5
ba
|
5,218
sqft
|
built
1981
10420 SW 64th St, Miami, FL 33173
$-15,128
Cash flow
-19.7%
Cash-on-Cash Return
1.6%
Cap rate
0.3%
Rent to Value Ratio
Active
$450,000
bds
|
1
ba
|
666
sqft
|
built
2019
851 NE 1st Ave, Miami, FL 33132
$-1,583
Cash flow
-18.4%
Cash-on-Cash Return
1.9%
Cap rate
0.8%
Rent to Value Ratio
Active
$595,000
2
bds
|
2
ba
|
1,215
sqft
|
built
2007
3250 NE 1st Ave, Miami, FL 33137
$-2,571
Cash flow
-22.5%
Cash-on-Cash Return
1.0%
Cap rate
0.7%
Rent to Value Ratio
Active
$2,590,000
4
bds
|
3
ba
|
2,427
sqft
|
built
2019
8301 SW 63rd Pl, Miami, FL 33143
$-7,194
Cash flow
-14.5%
Cash-on-Cash Return
2.8%
Cap rate
0.4%
Rent to Value Ratio
Active
$850,000
5
bds
|
4
ba
|
2,351
sqft
|
built
1997
14133 SW 152nd Ct, Miami, FL 33196
$-2,376
Cash flow
-14.6%
Cash-on-Cash Return
2.8%
Cap rate
0.5%
Rent to Value Ratio

Active
$740,000
3
bds
|
2
ba
|
1,806
sqft
|
built
1982
14902 SW 65th Ter, Miami, FL 33193
$-1,950
Cash flow
-13.7%
Cash-on-Cash Return
3.0%
Cap rate
0.5%
Rent to Value Ratio

Active
$739,000
4
bds
|
3
ba
|
2,416
sqft
|
built
2000
15804 SW 99th Ter, Miami, FL 33196
$-1,539
Cash flow
-10.9%
Cash-on-Cash Return
3.6%
Cap rate
0.6%
Rent to Value Ratio
Active
$175,000
1
bds
|
1
ba
|
670
sqft
|
built
1968
11111 Biscayne Blvd, Miami, FL 33181
$-927
Cash flow
-27.6%
Cash-on-Cash Return
-0.2%
Cap rate
1.1%
Rent to Value Ratio
Active
$215,000
1
bds
|
1
ba
|
482
sqft
|
built
1964
4444 Ludlam Rd, Miami, FL 33155
$-344
Cash flow
-8.3%
Cash-on-Cash Return
4.2%
Cap rate
0.8%
Rent to Value Ratio
Active
$1,145,000
4
bds
|
3
ba
|
2,160
sqft
|
built
1978
1816 SW 11th Ter, Miami, FL 33135
$-2,529
Cash flow
-11.5%
Cash-on-Cash Return
3.5%
Cap rate
0.5%
Rent to Value Ratio
Active
$249,000
3
bds
|
2
ba
|
1,010
sqft
|
built
2000
14040 NE 3rd Ct, Miami, FL 33161
$-172
Cash flow
-3.6%
Cash-on-Cash Return
5.3%
Cap rate
1.0%
Rent to Value Ratio
Active
$555,000
3
bds
|
2
ba
|
1,634
sqft
|
built
1988
12763 SW 146th Ln, Miami, FL 33186
$-908
Cash flow
-8.5%
Cash-on-Cash Return
4.2%
Cap rate
0.6%
Rent to Value Ratio
Active
$450,000
1
bds
|
2
ba
|
868
sqft
|
built
1975
1901 Brickell Ave, Miami, FL 33129
$-1,658
Cash flow
-19.2%
Cash-on-Cash Return
1.7%
Cap rate
0.6%
Rent to Value Ratio

Active
$319,000
2
bds
|
2
ba
|
960
sqft
|
built
1988
13810 SW 112th St, Miami, FL 33186
$-847
Cash flow
-13.9%
Cash-on-Cash Return
3.0%
Cap rate
0.7%
Rent to Value Ratio
Active
$670,000
2
bds
|
2
ba
|
1,116
sqft
|
built
2014
31 SE 6th St, Miami, FL 33131
$-2,314
Cash flow
-18.0%
Cash-on-Cash Return
2.0%
Cap rate
0.8%
Rent to Value Ratio

Active
$3,500,000
1
bds
|
0
ba
|
1,023
sqft
|
built
2004
1250 S Miami Ave, Miami, FL 33130
$-19,230
Cash flow
-28.7%
Cash-on-Cash Return
-0.4%
Cap rate
0.1%
Rent to Value Ratio
Active
$245,000
1
bds
|
2
ba
|
1,125
sqft
|
built
1972
9365 Fontainebleau Blvd, Miami, FL 33172
$139
Cash flow
3.0%
Cash-on-Cash Return
6.8%
Cap rate
1.0%
Rent to Value Ratio

Active
$450,000
1
bds
|
1
ba
|
818
sqft
|
built
2004
1200 Brickell Bay Dr, Miami, FL 33131
$-1,570
Cash flow
-18.2%
Cash-on-Cash Return
2.0%
Cap rate
0.6%
Rent to Value Ratio

Active
$415,000
1
bds
|
1
ba
|
733
sqft
|
built
2008
300 S Biscayne Blvd, Miami, FL 33131
$-1,434
Cash flow
-18.0%
Cash-on-Cash Return
2.0%
Cap rate
0.7%
Rent to Value Ratio
Active
$342,000
3
bds
|
3
ba
|
1,420
sqft
|
built
1980
8620 SW 149th Ave, Miami, FL 33193
$-854
Cash flow
-13.0%
Cash-on-Cash Return
3.2%
Cap rate
0.7%
Rent to Value Ratio

Active
$950,000
1
bds
|
2
ba
|
788
sqft
|
built
2017
1451 Brickell Ave, Miami, FL 33131
$-3,951
Cash flow
-21.7%
Cash-on-Cash Return
1.2%
Cap rate
0.6%
Rent to Value Ratio
Active
$1,699,000
3
bds
|
2
ba
|
1,587
sqft
|
built
1975
2901 S Bayshore Dr, Miami, FL 33133
$-4,652
Cash flow
-14.3%
Cash-on-Cash Return
2.9%
Cap rate
0.6%
Rent to Value Ratio

Active
$495,000
3
bds
|
2
ba
|
1,684
sqft
|
built
1957
11610 NW 11th Ave, Miami, FL 33168
$-926
Cash flow
-9.8%
Cash-on-Cash Return
3.9%
Cap rate
0.6%
Rent to Value Ratio
Active
$490,000
2
bds
|
2
ba
|
1,250
sqft
|
built
1988
9985 SW 118th Pl, Miami, FL 33186
$-1,201
Cash flow
-12.8%
Cash-on-Cash Return
3.2%
Cap rate
0.6%
Rent to Value Ratio
Active
$749,000
2
bds
|
2
ba
|
1,107
sqft
|
built
2015
460 NE 28th St, Miami, FL 33137
$-2,474
Cash flow
-17.2%
Cash-on-Cash Return
2.2%
Cap rate
0.8%
Rent to Value Ratio

Active
$995,000
4
bds
|
4
ba
|
1,835
sqft
|
built
1947
6540 SW 25th St, Miami, FL 33155
$-272
Cash flow
-1.4%
Cash-on-Cash Return
5.8%
Cap rate
0.7%
Rent to Value Ratio
Active
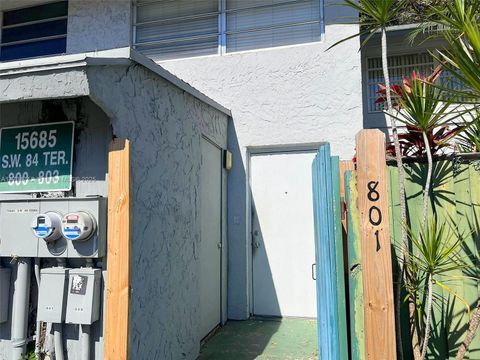
$310,000
3
bds
|
3
ba
|
1,660
sqft
|
built
1980
15685 SW 84th Ter, Miami, FL 33193
$-530
Cash flow
-8.9%
Cash-on-Cash Return
4.1%
Cap rate
0.9%
Rent to Value Ratio

Active
$630,000
2
bds
|
2
ba
|
988
sqft
|
built
2015
4250 Biscayne Blvd, Miami, FL 33137
$-3,063
Cash flow
-25.4%
Cash-on-Cash Return
0.3%
Cap rate
0.6%
Rent to Value Ratio
Active
$700,000
2
bds
|
3
ba
|
1,663
sqft
|
built
2008
2950 NE 188th St, Miami, FL 33180
$-2,947
Cash flow
-22.0%
Cash-on-Cash Return
1.1%
Cap rate
0.7%
Rent to Value Ratio

Active
$2,600,000
6
bds
|
6
ba
|
4,209
sqft
|
built
2005
13411 SW 36th St, Miami, FL 33175
$-8,367
Cash flow
-16.8%
Cash-on-Cash Return
2.3%
Cap rate
0.4%
Rent to Value Ratio
Active
$1,050,000
1
bds
|
1
ba
|
509
sqft
|
built
2022
398 NE 5th St, Miami, FL 33132
$-4,553
Cash flow
-22.6%
Cash-on-Cash Return
0.9%
Cap rate
0.4%
Rent to Value Ratio

Active
$760,000
3
bds
|
2
ba
|
1,680
sqft
|
built
1977
13480 SW 99th St, Miami, FL 33186
$-1,113
Cash flow
-7.6%
Cash-on-Cash Return
4.4%
Cap rate
0.6%
Rent to Value Ratio
Active
$279,000
2
bds
|
2
ba
|
985
sqft
|
built
1983
8415 SW 107th Ave, Miami, FL 33173
$-720
Cash flow
-13.5%
Cash-on-Cash Return
3.0%
Cap rate
0.8%
Rent to Value Ratio
Active
$1,070,000
3
bds
|
2
ba
|
1,430
sqft
|
built
1983
18650 SW 204th Ave, Miami, FL 33187
$-2,650
Cash flow
-12.9%
Cash-on-Cash Return
3.2%
Cap rate
0.4%
Rent to Value Ratio

Active
$439,224
1
bds
|
1
ba
|
787
sqft
|
built
1964
1408 Brickell Bay Dr, Miami, FL 33131
$-1,700
Cash flow
-20.2%
Cash-on-Cash Return
1.5%
Cap rate
0.6%
Rent to Value Ratio
Active
$1,935,000
3
bds
|
3
ba
|
1,944
sqft
|
built
2005
901 Brickell Key Blvd, Miami, FL 33131
$-7,156
Cash flow
-19.3%
Cash-on-Cash Return
1.7%
Cap rate
0.5%
Rent to Value Ratio
Active
$1,550,000
4
bds
|
3
ba
|
2,114
sqft
|
built
1947
210 NE 44th St, Miami, FL 33137
$-2,633
Cash flow
-8.9%
Cash-on-Cash Return
4.1%
Cap rate
0.6%
Rent to Value Ratio