Miami, FL Investment Properties for Sale
Browse homes for sale and investment properties in Miami, FL. Refine your search by price, property type, or more.
Best cash flowing properties in Miami, FL

Active
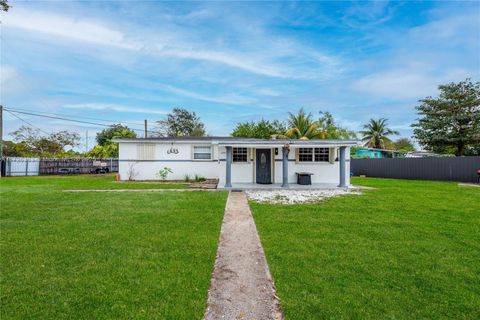
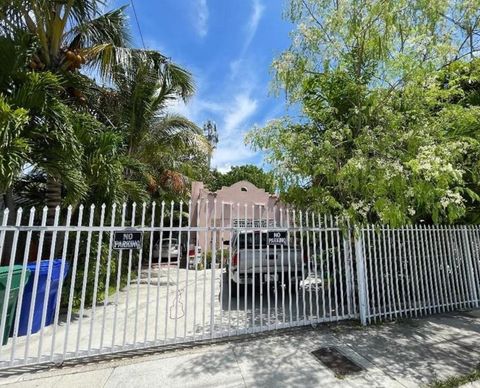
$375,000
2
bds
|
1
ba
|
915
sqft
|
built
1939
789 NW 76th St, Miami, FL 33150
$12
Cash flow
0.2%
Cash-on-Cash Return
6.2%
Cap rate
0.8%
Rent to Value Ratio

Active
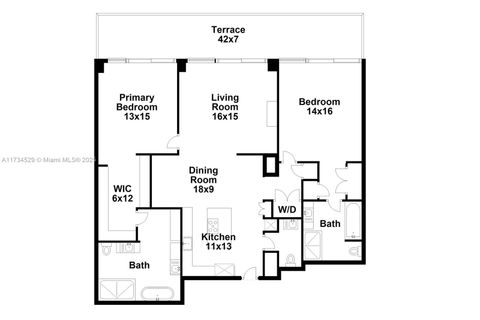
$490,000
3
bds
|
2
ba
|
1,189
sqft
|
built
2006
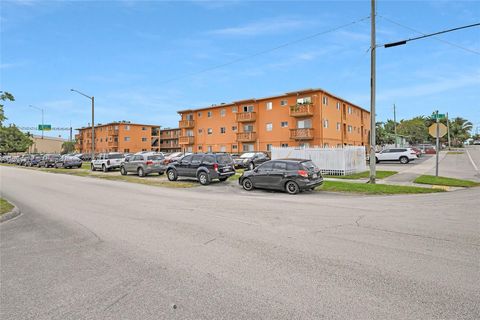
2270 NW 51st Ter, Miami, FL 33142
$-197
Cash flow
-2.1%
Cash-on-Cash Return
5.7%
Cap rate
0.7%
Rent to Value Ratio
6,455 out of 7,312 properties for sale in Miami, FL
Limited Results Shown
Create a free account, or log in to reveal all property listings and enjoy the complete experience.
Active
$925,000
4
bds
|
2
ba
|
1,951
sqft
|
built
1984
13453 SW 39th Ln, Miami, FL 33175
$-1,277
Cash flow
-7.2%
Cash-on-Cash Return
4.5%
Cap rate
0.6%
Rent to Value Ratio
Active
$775,000
2
bds
|
3
ba
|
1,255
sqft
|
built
2008
888 Biscayne Blvd, Miami, FL 33132
$-2,406
Cash flow
-16.2%
Cash-on-Cash Return
2.4%
Cap rate
0.7%
Rent to Value Ratio

Active
$323,000
bds
|
1
ba
|
567
sqft
|
built
2007
50 Biscayne Blvd, Miami, FL 33132
$-1,079
Cash flow
-17.4%
Cash-on-Cash Return
2.1%
Cap rate
0.8%
Rent to Value Ratio
Active
$705,000
2
bds
|
2
ba
|
1,084
sqft
|
built
2018
501 NE 31st St, Miami, FL 33137
$-2,875
Cash flow
-21.3%
Cash-on-Cash Return
1.3%
Cap rate
0.6%
Rent to Value Ratio

Active
$536,999
3
bds
|
2
ba
|
1,195
sqft
|
built
2018
20321 SW 120th Ave, Miami, FL 33177
$-899
Cash flow
-8.7%
Cash-on-Cash Return
4.1%
Cap rate
0.6%
Rent to Value Ratio

Active
$199,000
1
bds
|
1
ba
|
605
sqft
|
built
1965
421 NE 68th St, Miami, FL 33138
$-577
Cash flow
-15.1%
Cash-on-Cash Return
2.7%
Cap rate
0.9%
Rent to Value Ratio
Active
$375,000
2
bds
|
1
ba
|
915
sqft
|
built
1939
789 NW 76th St, Miami, FL 33150
$12
Cash flow
0.2%
Cash-on-Cash Return
6.2%
Cap rate
0.8%
Rent to Value Ratio

Active
$1,050,000
3
bds
|
2
ba
|
1,653
sqft
|
built
1955
301 SW 30th Ct, Miami, FL 33135
$-1,343
Cash flow
-6.7%
Cash-on-Cash Return
4.6%
Cap rate
0.7%
Rent to Value Ratio
Active
$746,000
1
bds
|
2
ba
|
880
sqft
|
built
2016
1300 S Miami Ave, Miami, FL 33130
$-2,871
Cash flow
-20.1%
Cash-on-Cash Return
1.5%
Cap rate
0.6%
Rent to Value Ratio
Active
$510,000
4
bds
|
2
ba
|
1,407
sqft
|
built
1952
1890 NW 127th St, Miami, FL 33167
$-751
Cash flow
-7.7%
Cash-on-Cash Return
4.4%
Cap rate
0.7%
Rent to Value Ratio
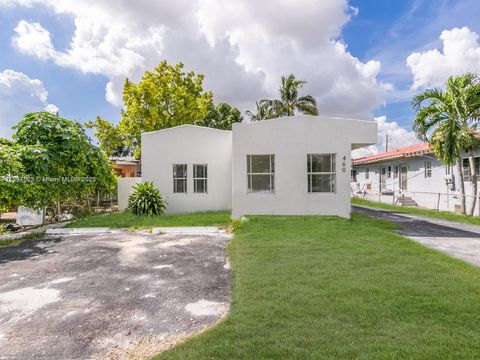
Active
$609,000
2
bds
|
0
ba
|
1,750
sqft
|
built
1930
460 NW 82nd Ter, Miami, FL 33150
$-1,355
Cash flow
-11.6%
Cash-on-Cash Return
3.5%
Cap rate
0.6%
Rent to Value Ratio
Active
$1,995,000
2
bds
|
3
ba
|
1,666
sqft
|
built
2001
3400 SW 27th Ave, Miami, FL 33133
$-9,088
Cash flow
-23.8%
Cash-on-Cash Return
0.7%
Cap rate
0.4%
Rent to Value Ratio
Active
$465,000
3
bds
|
2
ba
|
1,080
sqft
|
built
1934
2507 NW 91st St, Miami, FL 33147
$-711
Cash flow
-8.0%
Cash-on-Cash Return
4.4%
Cap rate
0.7%
Rent to Value Ratio

Active
$384,000
1
bds
|
2
ba
|
835
sqft
|
built
2004
455 NE 25th St, Miami, FL 33137
$-1,363
Cash flow
-18.5%
Cash-on-Cash Return
1.9%
Cap rate
0.7%
Rent to Value Ratio

Active
$360,000
1
bds
|
1
ba
|
560
sqft
|
built
2018
321 NE 26th St, Miami, FL 33137
$-1,182
Cash flow
-17.1%
Cash-on-Cash Return
2.2%
Cap rate
0.7%
Rent to Value Ratio

Active
$465,000
1
bds
|
1
ba
|
791
sqft
|
built
2004
2101 Brickell Ave, Miami, FL 33129
$-1,845
Cash flow
-20.7%
Cash-on-Cash Return
1.4%
Cap rate
0.7%
Rent to Value Ratio

Active
$1,699,999
4
bds
|
2
ba
|
950
sqft
|
built
1950
160 NW 39th St, Miami, FL 33127
$-7,740
Cash flow
-23.8%
Cash-on-Cash Return
0.7%
Cap rate
0.2%
Rent to Value Ratio
Active
$1,700,000
3
bds
|
0
ba
|
1,987
sqft
|
built
1928
675 NW 34th St, Miami, FL 33127
$-7,708
Cash flow
-23.7%
Cash-on-Cash Return
0.7%
Cap rate
0.1%
Rent to Value Ratio
Active
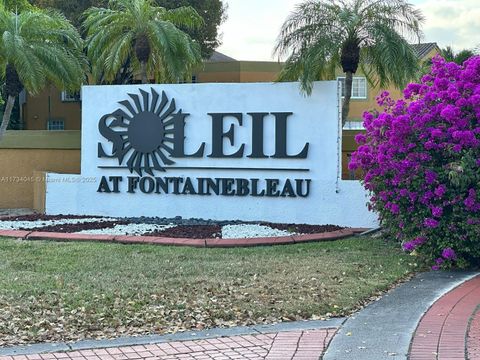
$320,000
2
bds
|
1
ba
|
933
sqft
|
built
1989
9715 Fontainebleau Blvd, Miami, FL 33172
$-264
Cash flow
-4.3%
Cash-on-Cash Return
5.2%
Cap rate
0.8%
Rent to Value Ratio
Active
$330,000
2
bds
|
2
ba
|
798
sqft
|
built
2007
219 NW 12th Ave, Miami, FL 33128
$-505
Cash flow
-8.0%
Cash-on-Cash Return
4.3%
Cap rate
0.8%
Rent to Value Ratio

Active
$749,900
2
bds
|
2
ba
|
1,165
sqft
|
built
2015
1100 S Miami Ave, Miami, FL 33130
$-2,729
Cash flow
-19.0%
Cash-on-Cash Return
1.8%
Cap rate
0.6%
Rent to Value Ratio
Active
$1,090,000
4
bds
|
3
ba
|
1,858
sqft
|
built
1953
6372 SW 32nd St, Miami, FL 33155
$-1,476
Cash flow
-7.1%
Cash-on-Cash Return
4.5%
Cap rate
0.6%
Rent to Value Ratio

Active
$545,000
2
bds
|
2
ba
|
1,218
sqft
|
built
1973
600 NE 36th St, Miami, FL 33137
$-1,878
Cash flow
-18.0%
Cash-on-Cash Return
2.0%
Cap rate
0.7%
Rent to Value Ratio
Active
$249,900
2
bds
|
1
ba
|
646
sqft
|
built
1963
2330 NW 11th St, Miami, FL 33125
$-353
Cash flow
-7.4%
Cash-on-Cash Return
4.5%
Cap rate
0.8%
Rent to Value Ratio
Active
$1,599,000
3
bds
|
3
ba
|
1,711
sqft
|
built
2016
1300 S Miami Ave, Miami, FL 33130
$-5,436
Cash flow
-17.7%
Cash-on-Cash Return
2.1%
Cap rate
0.6%
Rent to Value Ratio

Active
$930,000
3
bds
|
2
ba
|
1,418
sqft
|
built
1947
6440 SW 42nd St, Miami, FL 33155
$-1,751
Cash flow
-9.8%
Cash-on-Cash Return
3.9%
Cap rate
0.6%
Rent to Value Ratio
Active
$298,000
1
bds
|
1
ba
|
0
sqft
|
built
2008
253 NE 2nd St, Miami, FL 33132
$-772
Cash flow
-13.5%
Cash-on-Cash Return
3.0%
Cap rate
0.9%
Rent to Value Ratio

Active
$705,000
2
bds
|
2
ba
|
864
sqft
|
built
2018
121 NE 34th St, Miami, FL 33137
$-3,387
Cash flow
-25.1%
Cash-on-Cash Return
0.4%
Cap rate
0.6%
Rent to Value Ratio

Active
$561,000
bds
|
1
ba
|
479
sqft
|
built
2019
3900 Biscayne Blvd, Miami, FL 33137
$-2,106
Cash flow
-19.6%
Cash-on-Cash Return
1.6%
Cap rate
0.6%
Rent to Value Ratio
Active
$315,000
3
bds
|
3
ba
|
1,190
sqft
|
built
1971
10801 SW 109th Ct, Miami, FL 33176
$-753
Cash flow
-12.5%
Cash-on-Cash Return
3.3%
Cap rate
0.8%
Rent to Value Ratio
Active
$3,500,000
5
bds
|
4
ba
|
3,034
sqft
|
built
2006
20407 SW 226th St, Miami, FL 33170
$-12,392
Cash flow
-18.5%
Cash-on-Cash Return
1.9%
Cap rate
0.3%
Rent to Value Ratio
Active
$490,000
3
bds
|
2
ba
|
1,189
sqft
|
built
2006
2270 NW 51st Ter, Miami, FL 33142
$-197
Cash flow
-2.1%
Cash-on-Cash Return
5.7%
Cap rate
0.7%
Rent to Value Ratio

Active
$490,000
1
bds
|
1
ba
|
738
sqft
|
built
2008
55 SE 6th St, Miami, FL 33131
$-2,249
Cash flow
-23.9%
Cash-on-Cash Return
0.6%
Cap rate
0.7%
Rent to Value Ratio

Active
$630,000
3
bds
|
2
ba
|
1,168
sqft
|
built
2005
3590 Coral Way, Miami, FL 33145
$-1,929
Cash flow
-16.0%
Cash-on-Cash Return
2.5%
Cap rate
0.6%
Rent to Value Ratio

Active
$490,000
2
bds
|
2
ba
|
1,108
sqft
|
built
2007
50 Biscayne Blvd, Miami, FL 33132
$-1,990
Cash flow
-21.2%
Cash-on-Cash Return
1.3%
Cap rate
0.7%
Rent to Value Ratio
Active
$618,900
1
bds
|
2
ba
|
866
sqft
|
built
2018
801 S Miami Ave, Miami, FL 33130
$-1,926
Cash flow
-16.2%
Cash-on-Cash Return
2.4%
Cap rate
0.7%
Rent to Value Ratio

Active
$350,000
2
bds
|
2
ba
|
1,358
sqft
|
built
1968
11111 Biscayne Blvd, Miami, FL 33181
$-1,793
Cash flow
-26.7%
Cash-on-Cash Return
n/a
Cap rate
0.9%
Rent to Value Ratio
Active
$455,000
2
bds
|
2
ba
|
945
sqft
|
built
2007
652 NE 63rd St, Miami, FL 33138
$-1,371
Cash flow
-15.7%
Cash-on-Cash Return
2.5%
Cap rate
0.7%
Rent to Value Ratio
Active
$1,200,000
5
bds
|
4
ba
|
3,316
sqft
|
built
2006
19880 SW 134th Ave, Miami, FL 33177
$-3,308
Cash flow
-14.4%
Cash-on-Cash Return
2.8%
Cap rate
0.5%
Rent to Value Ratio
Active
$710,000
2
bds
|
2
ba
|
835
sqft
|
built
2018
121 NE 34th St, Miami, FL 33137
$-2,549
Cash flow
-18.7%
Cash-on-Cash Return
1.8%
Cap rate
0.7%
Rent to Value Ratio