Miami, FL Investment Properties for Sale
Browse homes for sale and investment properties in Miami, FL. Refine your search by price, property type, or more.
Best cash flowing properties in Miami, FL
Active
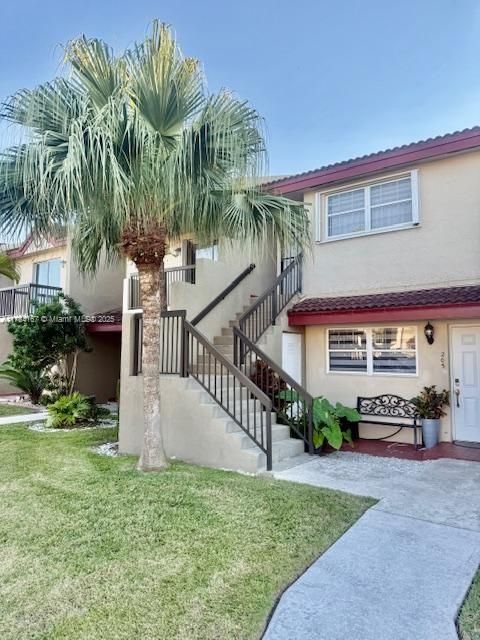
$244,900
1
bds
|
1
ba
|
711
sqft
|
built
1987
6420 SW 129th Pl, Miami, FL 33183
$-65
Cash flow
-1.4%
Cash-on-Cash Return
5.8%
Cap rate
0.8%
Rent to Value Ratio
Active
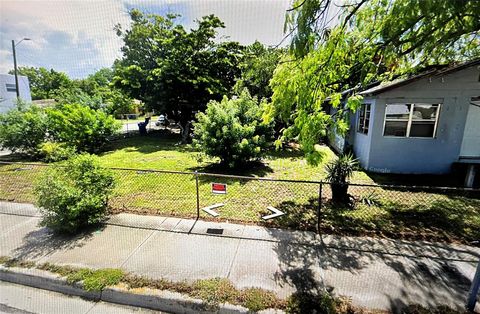
$375,000
2
bds
|
1
ba
|
1,216
sqft
|
built
1939
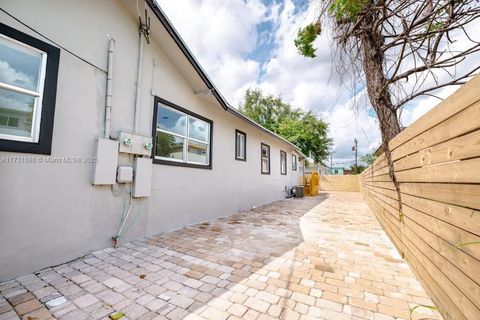
6312 NW 17th Ave, Miami, FL 33147
$-106
Cash flow
-1.5%
Cash-on-Cash Return
5.8%
Cap rate
0.7%
Rent to Value Ratio
6,455 out of 7,312 properties for sale in Miami, FL
Limited Results Shown
Create a free account, or log in to reveal all property listings and enjoy the complete experience.
Active
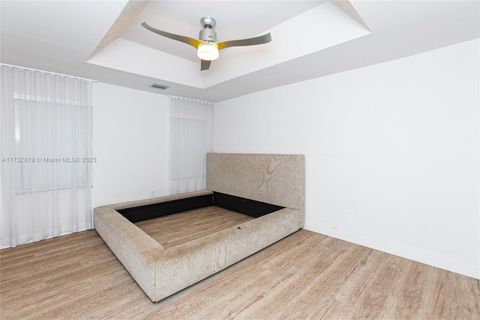
$657,988
3
bds
|
3
ba
|
1,839
sqft
|
built
1996
8196 SW 163rd Ct, Miami, FL 33193
$-1,896
Cash flow
-15.0%
Cash-on-Cash Return
2.7%
Cap rate
0.5%
Rent to Value Ratio
Active
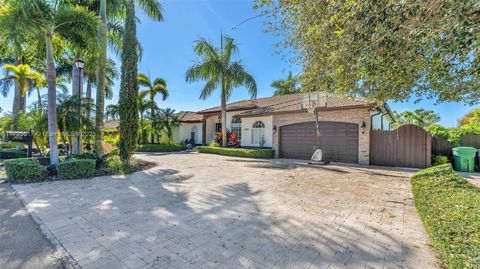
$1,200,000
5
bds
|
4
ba
|
3,316
sqft
|
built
2006
19880 SW 134th Ave, Miami, FL 33177
$-3,308
Cash flow
-14.4%
Cash-on-Cash Return
2.8%
Cap rate
0.5%
Rent to Value Ratio
Active
$805,000
4
bds
|
2
ba
|
1,953
sqft
|
built
1996
15201 SW 177th Ter, Miami, FL 33187
$-1,402
Cash flow
-9.1%
Cash-on-Cash Return
4.1%
Cap rate
0.5%
Rent to Value Ratio
Active
$995,000
4
bds
|
2
ba
|
1,728
sqft
|
built
1960
11325 SW 109th Ave, Miami, FL 33176
$-1,973
Cash flow
-10.3%
Cash-on-Cash Return
3.8%
Cap rate
0.5%
Rent to Value Ratio
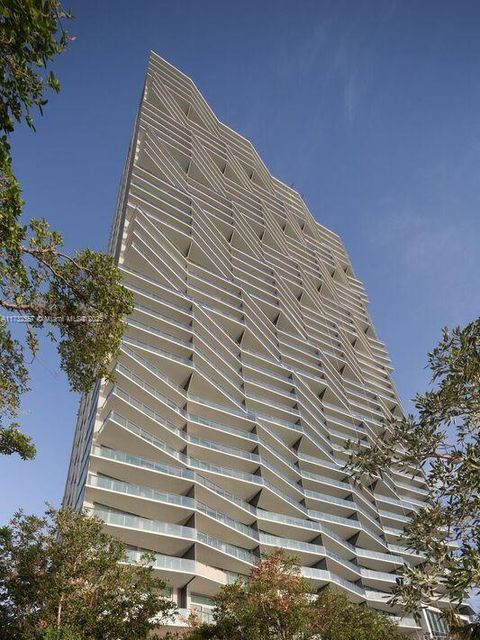
Active
$710,000
2
bds
|
2
ba
|
835
sqft
|
built
2018
121 NE 34th St, Miami, FL 33137
$-2,549
Cash flow
-18.7%
Cash-on-Cash Return
1.8%
Cap rate
0.7%
Rent to Value Ratio

Active
$1,200,000
5
bds
|
4
ba
|
2,681
sqft
|
built
2009
10311 SW 7th Ter, Miami, FL 33174
$-2,337
Cash flow
-10.2%
Cash-on-Cash Return
3.8%
Cap rate
0.5%
Rent to Value Ratio
Active
$490,000
2
bds
|
2
ba
|
990
sqft
|
built
1968
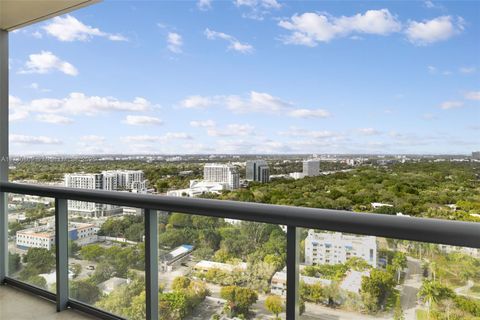
999 Brickell Bay Dr, Miami, FL 33131
$-1,245
Cash flow
-13.3%
Cash-on-Cash Return
3.1%
Cap rate
0.8%
Rent to Value Ratio
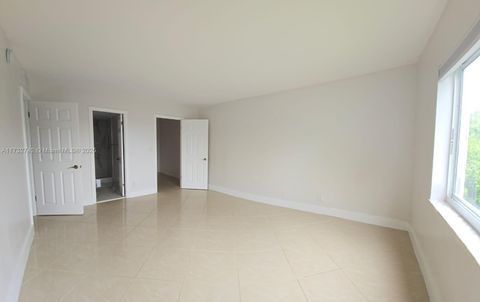
Active
$262,000
2
bds
|
2
ba
|
836
sqft
|
built
1974
8950 NE 8th Ave, Miami, FL 33138
$-620
Cash flow
-12.3%
Cash-on-Cash Return
3.3%
Cap rate
0.9%
Rent to Value Ratio
Active
$275,000
2
bds
|
3
ba
|
1,950
sqft
|
built
1975
1800 NE 114th St, Miami, FL 33181
$-884
Cash flow
-16.8%
Cash-on-Cash Return
2.3%
Cap rate
1.3%
Rent to Value Ratio
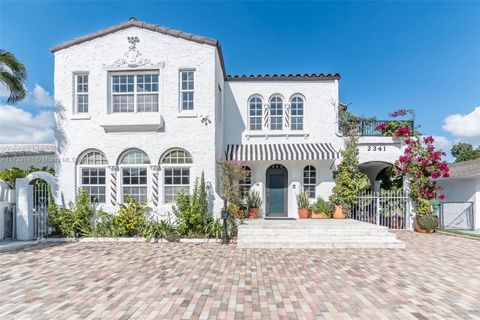
Active
$1,650,000
4
bds
|
5
ba
|
2,694
sqft
|
built
1925
2341 SW 16th Ter, Miami, FL 33145
$-3,692
Cash flow
-11.7%
Cash-on-Cash Return
3.5%
Cap rate
0.5%
Rent to Value Ratio
Active
$244,900
1
bds
|
1
ba
|
711
sqft
|
built
1987
6420 SW 129th Pl, Miami, FL 33183
$-65
Cash flow
-1.4%
Cash-on-Cash Return
5.8%
Cap rate
0.8%
Rent to Value Ratio
Active
$999,000
2
bds
|
3
ba
|
1,162
sqft
|
built
2017
2900 NE 7th Ave, Miami, FL 33137
$-3,725
Cash flow
-19.5%
Cash-on-Cash Return
1.7%
Cap rate
0.6%
Rent to Value Ratio
Active
$265,000
2
bds
|
2
ba
|
994
sqft
|
built
1972
3101 N Country Club Dr, Miami, FL 33180
$-905
Cash flow
-17.8%
Cash-on-Cash Return
2.0%
Cap rate
0.9%
Rent to Value Ratio

Active
$634,999
3
bds
|
2
ba
|
1,621
sqft
|
built
2000
13529 SW 144th Ter, Miami, FL 33186
$-1,553
Cash flow
-12.8%
Cash-on-Cash Return
3.2%
Cap rate
0.6%
Rent to Value Ratio
Active
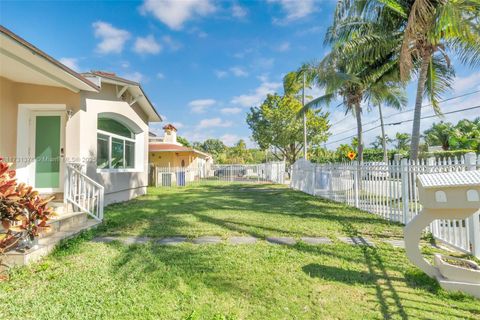
$329,000
4
bds
|
2
ba
|
1,300
sqft
|
built
1935
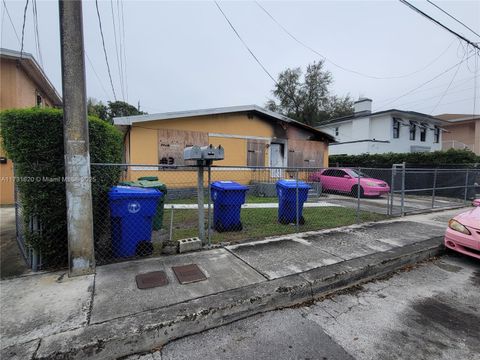
1839 NW 49th St, Miami, FL 33142
$-188
Cash flow
-3.0%
Cash-on-Cash Return
5.5%
Cap rate
0.9%
Rent to Value Ratio

Active
$1,100,000
2
bds
|
2
ba
|
1,200
sqft
|
built
2016
88 SW 7th St, Miami, FL 33130
$-4,236
Cash flow
-20.1%
Cash-on-Cash Return
1.5%
Cap rate
0.6%
Rent to Value Ratio
Active
$680,000
2
bds
|
2
ba
|
921
sqft
|
built
2015
1100 S Miami Ave, Miami, FL 33130
$-2,524
Cash flow
-19.4%
Cash-on-Cash Return
1.7%
Cap rate
0.6%
Rent to Value Ratio

Active
$1,350,000
2
bds
|
2
ba
|
1,134
sqft
|
built
2023
700 NE 26th Ter, Miami, FL 33137
$-5,377
Cash flow
-20.8%
Cash-on-Cash Return
1.4%
Cap rate
0.5%
Rent to Value Ratio

Active
$239,000
1
bds
|
2
ba
|
889
sqft
|
built
1975
1300 NE Miami Gardens Dr, Miami, FL 33179
$-457
Cash flow
-10.0%
Cash-on-Cash Return
4.0%
Cap rate
0.8%
Rent to Value Ratio

Active
$999,000
3
bds
|
2
ba
|
1,416
sqft
|
built
2005
325 S Biscayne Blvd, Miami, FL 33131
$-1,569
Cash flow
-8.2%
Cash-on-Cash Return
4.3%
Cap rate
0.6%
Rent to Value Ratio
Active
$4,250,000
5
bds
|
6
ba
|
3,996
sqft
|
built
1982
14875 SW 212th St, Miami, FL 33187
$-16,104
Cash flow
-19.8%
Cash-on-Cash Return
1.6%
Cap rate
0.2%
Rent to Value Ratio
Active
$330,000
2
bds
|
1
ba
|
919
sqft
|
built
1972
2160 SW 16th Ave, Miami, FL 33145
$-592
Cash flow
-9.4%
Cash-on-Cash Return
4.0%
Cap rate
0.8%
Rent to Value Ratio
Active
$649,000
2
bds
|
2
ba
|
1,289
sqft
|
built
2006
41 SE 5th St, Miami, FL 33131
$-1,906
Cash flow
-15.3%
Cash-on-Cash Return
2.6%
Cap rate
0.7%
Rent to Value Ratio
Active
$780,000
4
bds
|
2
ba
|
2,372
sqft
|
built
2004
15486 SW 23rd Ln, Miami, FL 33185
$-1,511
Cash flow
-10.1%
Cash-on-Cash Return
3.8%
Cap rate
0.6%
Rent to Value Ratio
Active
$619,900
4
bds
|
2
ba
|
1,943
sqft
|
built
1982
20501 SW 124th Ct, Miami, FL 33177
$-840
Cash flow
-7.1%
Cash-on-Cash Return
4.5%
Cap rate
0.6%
Rent to Value Ratio
Active
$1,649,000
3
bds
|
0
ba
|
3,998
sqft
|
built
1937
418 NW 9th Ave, Miami, FL 33128
$-6,307
Cash flow
-20.0%
Cash-on-Cash Return
1.6%
Cap rate
0.3%
Rent to Value Ratio
Active
$800,000
3
bds
|
3
ba
|
2,109
sqft
|
built
1979
12900 SW 189th St, Miami, FL 33177
$-1,339
Cash flow
-8.7%
Cash-on-Cash Return
4.1%
Cap rate
0.6%
Rent to Value Ratio
Active
$375,000
2
bds
|
1
ba
|
1,216
sqft
|
built
1939
6312 NW 17th Ave, Miami, FL 33147
$-106
Cash flow
-1.5%
Cash-on-Cash Return
5.8%
Cap rate
0.7%
Rent to Value Ratio
Active
$1,275,000
4
bds
|
0
ba
|
1,664
sqft
|
built
1952
2 NE 45th St, Miami, FL 33137
$-5,024
Cash flow
-20.6%
Cash-on-Cash Return
1.4%
Cap rate
0.3%
Rent to Value Ratio

Active
$729,900
bds
|
1
ba
|
362
sqft
|
built
2022
398 NE 5th St, Miami, FL 33132
$-2,404
Cash flow
-17.2%
Cash-on-Cash Return
2.2%
Cap rate
0.5%
Rent to Value Ratio
Active
$340,000
2
bds
|
1
ba
|
836
sqft
|
built
1951
111 E Flagler St, Miami, FL 33131
$-1,255
Cash flow
-19.3%
Cash-on-Cash Return
1.7%
Cap rate
0.7%
Rent to Value Ratio
Active
$795,000
4
bds
|
0
ba
|
1,544
sqft
|
built
1924
2135 SW 4th St, Miami, FL 33135
$-3,262
Cash flow
-21.4%
Cash-on-Cash Return
1.2%
Cap rate
0.3%
Rent to Value Ratio
Active
$864,999
4
bds
|
3
ba
|
1,762
sqft
|
built
1935
1959 SW 12th St, Miami, FL 33135
$-2,019
Cash flow
-12.2%
Cash-on-Cash Return
3.3%
Cap rate
0.5%
Rent to Value Ratio
Active
$660,000
1
bds
|
1
ba
|
854
sqft
|
built
2015
460 NE 28th St, Miami, FL 33137
$-2,536
Cash flow
-20.0%
Cash-on-Cash Return
1.5%
Cap rate
0.6%
Rent to Value Ratio

Active
$325,000
2
bds
|
1
ba
|
710
sqft
|
built
1983
14945 SW 49th Ln, Miami, FL 33185
$-872
Cash flow
-14.0%
Cash-on-Cash Return
2.9%
Cap rate
0.7%
Rent to Value Ratio
Active
$297,050
2
bds
|
2
ba
|
1,099
sqft
|
built
1977
8411 NW 8th St, Miami, FL 33126
$-236
Cash flow
-4.1%
Cash-on-Cash Return
5.2%
Cap rate
0.8%
Rent to Value Ratio

Active
$820,000
2
bds
|
2
ba
|
1,440
sqft
|
built
2008
1060 Brickell Ave, Miami, FL 33131
$-2,580
Cash flow
-16.4%
Cash-on-Cash Return
2.4%
Cap rate
0.6%
Rent to Value Ratio
Active
$665,000
2
bds
|
3
ba
|
1,158
sqft
|
built
2005
601 NE 36th St, Miami, FL 33137
$-2,343
Cash flow
-18.4%
Cash-on-Cash Return
1.9%
Cap rate
0.8%
Rent to Value Ratio
Active
$685,000
4
bds
|
3
ba
|
2,560
sqft
|
built
2023
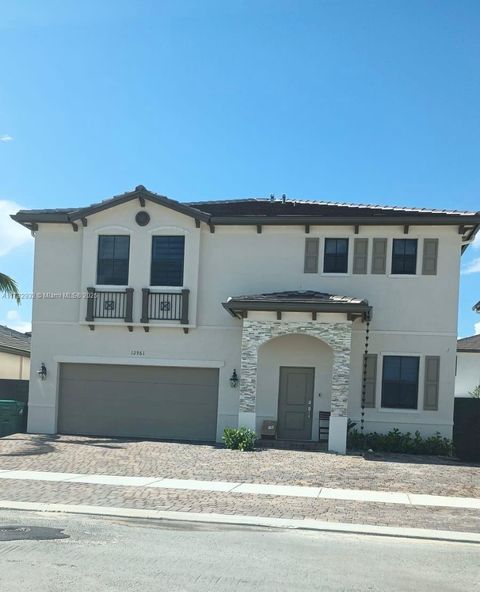
12961 SW 230th St, Miami, FL 33170
$-1,636
Cash flow
-12.5%
Cash-on-Cash Return
3.3%
Cap rate
0.6%
Rent to Value Ratio
Active
$649,900
8
bds
|
0
ba
|
2,320
sqft
|
built
1957
412 NW 59th St, Miami, FL 33127
$-2,144
Cash flow
-17.2%
Cash-on-Cash Return
2.2%
Cap rate
0.4%
Rent to Value Ratio