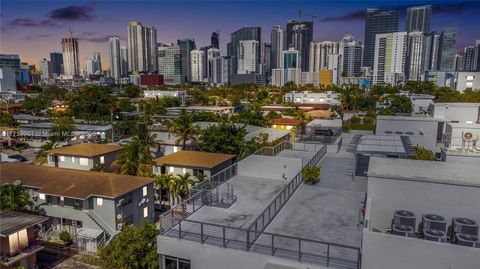
Miami, FL Investment Properties for Sale
Browse homes for sale and investment properties in Miami, FL. Refine your search by price, property type, or more.
Best cash flowing properties in Miami, FL
Active
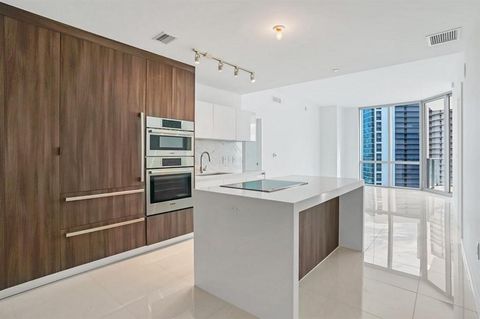
$215,000
1
bds
|
1
ba
|
506
sqft
|
built
1973
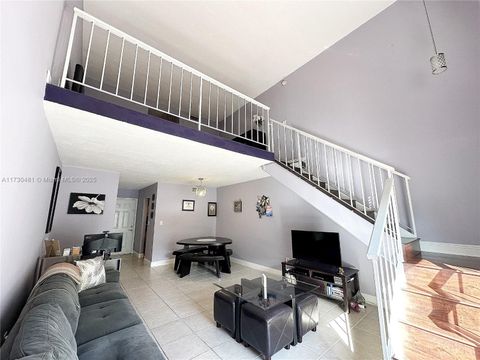
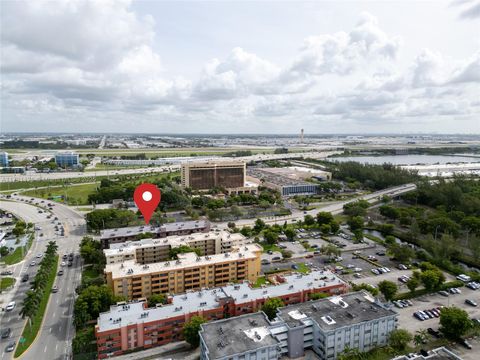
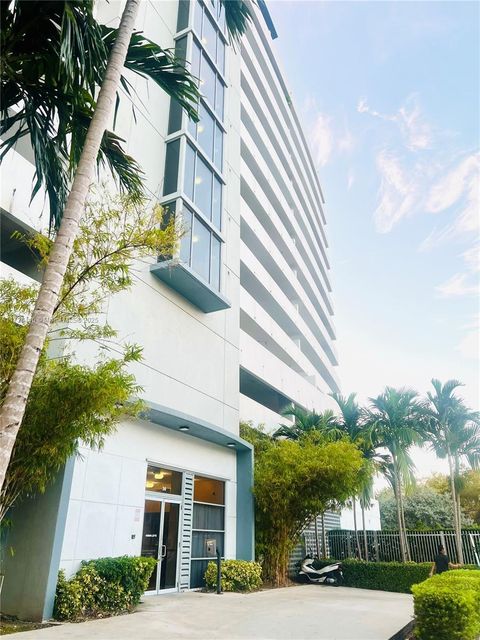
5050 NW 7th St, Miami, FL 33126
$-219
Cash flow
-5.3%
Cash-on-Cash Return
4.9%
Cap rate
0.8%
Rent to Value Ratio
Active
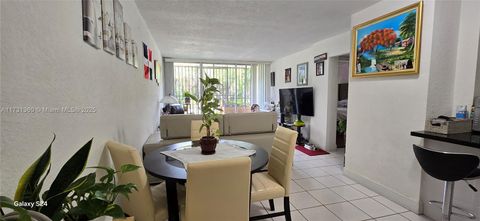
$219,000
1
bds
|
2
ba
|
801
sqft
|
built
1969
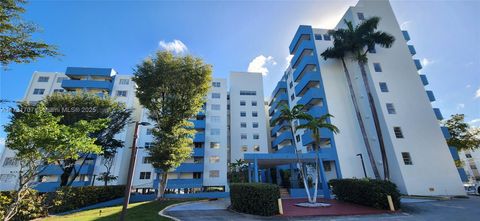
8550 SW 109th Ave, Miami, FL 33173
$-300
Cash flow
-7.1%
Cash-on-Cash Return
4.5%
Cap rate
0.9%
Rent to Value Ratio
6,455 out of 7,312 properties for sale in Miami, FL
Limited Results Shown
Create a free account, or log in to reveal all property listings and enjoy the complete experience.
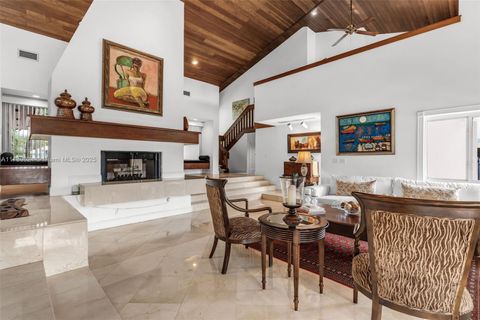
Active
$704,999
4
bds
|
3
ba
|
2,267
sqft
|
built
2015
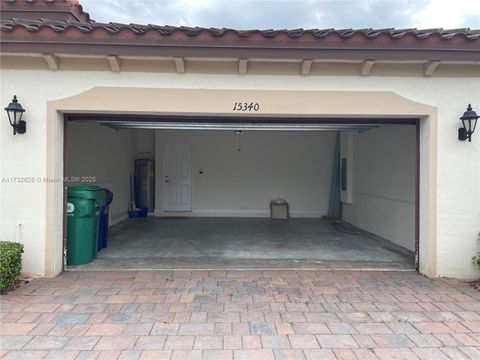
15340 SW 176th Ln, Miami, FL 33187
$-2,070
Cash flow
-15.3%
Cash-on-Cash Return
2.6%
Cap rate
0.6%
Rent to Value Ratio

Active
$2,440,000
4
bds
|
3
ba
|
2,620
sqft
|
built
1977
21440 Highland Lakes Blvd, Miami, FL 33179
$-6,942
Cash flow
-14.8%
Cash-on-Cash Return
2.7%
Cap rate
0.4%
Rent to Value Ratio

Active
$519,000
3
bds
|
3
ba
|
1,376
sqft
|
built
2020
2555 NE 193rd St, Miami, FL 33180
$-1,762
Cash flow
-17.7%
Cash-on-Cash Return
2.1%
Cap rate
0.6%
Rent to Value Ratio

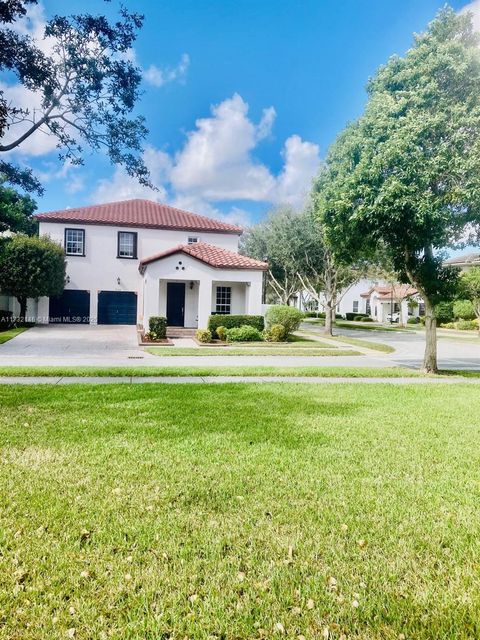
Active
$995,000
4
bds
|
3
ba
|
2,218
sqft
|
built
1958
8631 SW 16th Ter, Miami, FL 33155
$-1,306
Cash flow
-6.8%
Cash-on-Cash Return
4.6%
Cap rate
0.6%
Rent to Value Ratio
Active
$875,000
1
bds
|
2
ba
|
959
sqft
|
built
2018
3131 NE 7th Ave, Miami, FL 33137
$-3,125
Cash flow
-18.6%
Cash-on-Cash Return
1.9%
Cap rate
0.6%
Rent to Value Ratio

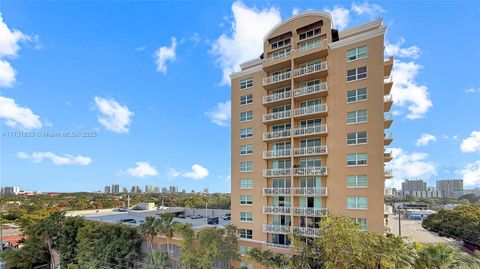
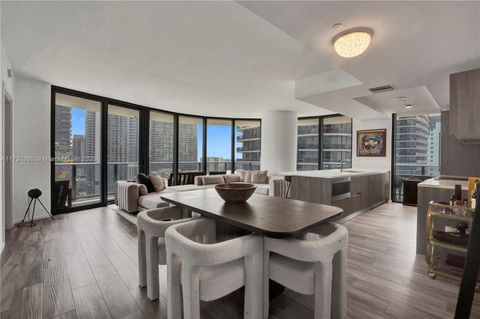
Active
$1,050,000
2
bds
|
3
ba
|
1,539
sqft
|
built
2008
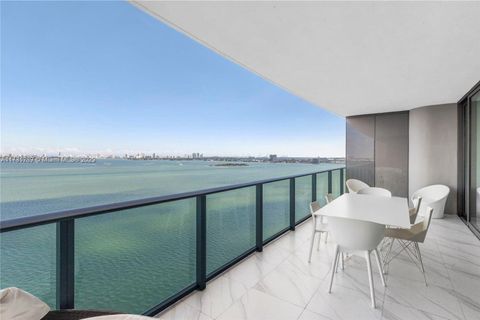
200 Biscayne Boulevard Way, Miami, FL 33131
$-4,664
Cash flow
-23.2%
Cash-on-Cash Return
0.8%
Cap rate
0.6%
Rent to Value Ratio

Active
$975,000
4
bds
|
0
ba
|
1,300
sqft
|
built
1951
7 NE 50th St, Miami, FL 33137
$-2,624
Cash flow
-14.0%
Cash-on-Cash Return
2.9%
Cap rate
0.5%
Rent to Value Ratio
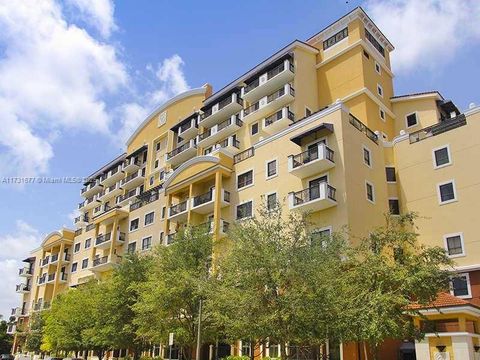
Active
$889,900
4
bds
|
3
ba
|
3,000
sqft
|
built
2012
9102 SW 170th Ct, Miami, FL 33196
$-1,112
Cash flow
-6.5%
Cash-on-Cash Return
4.6%
Cap rate
0.7%
Rent to Value Ratio

Active
$784,900
4
bds
|
2
ba
|
1,882
sqft
|
built
1992
15042 SW 149th Ct, Miami, FL 33196
$-976
Cash flow
-6.5%
Cash-on-Cash Return
4.7%
Cap rate
0.6%
Rent to Value Ratio
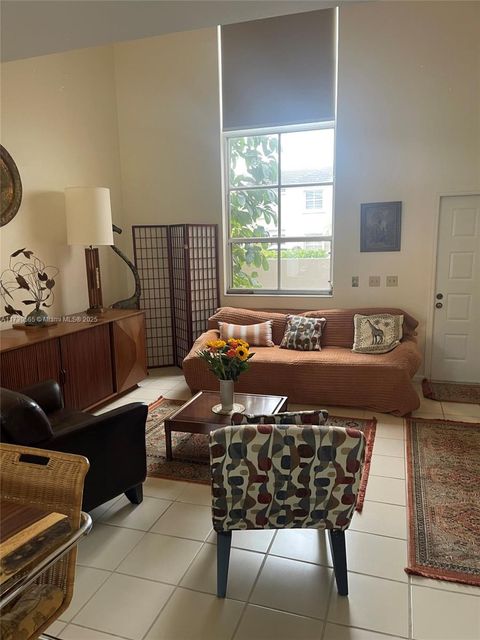
Active
$369,500
1
bds
|
1
ba
|
694
sqft
|
built
2002
2665 SW 37th Ave, Miami, FL 33133
$-1,222
Cash flow
-17.3%
Cash-on-Cash Return
2.2%
Cap rate
0.6%
Rent to Value Ratio
Active
$215,000
1
bds
|
1
ba
|
506
sqft
|
built
1973
5050 NW 7th St, Miami, FL 33126
$-219
Cash flow
-5.3%
Cash-on-Cash Return
4.9%
Cap rate
0.8%
Rent to Value Ratio

Active
$775,000
2
bds
|
2
ba
|
1,031
sqft
|
built
2008
900 Biscayne Blvd, Miami, FL 33132
$-2,716
Cash flow
-18.3%
Cash-on-Cash Return
1.9%
Cap rate
0.7%
Rent to Value Ratio
Active
$1,650,000
3
bds
|
4
ba
|
1,613
sqft
|
built
2018
801 S Miami Ave, Miami, FL 33130
$-6,869
Cash flow
-21.7%
Cash-on-Cash Return
1.2%
Cap rate
0.5%
Rent to Value Ratio
Active
$699,000
2
bds
|
3
ba
|
2,182
sqft
|
built
2008
8395 SW 73rd Ave, Miami, FL 33143
$-3,489
Cash flow
-26.0%
Cash-on-Cash Return
0.2%
Cap rate
0.6%
Rent to Value Ratio
Active
$770,000
3
bds
|
3
ba
|
1,662
sqft
|
built
1948
35 SW 63rd Ct, Miami, FL 33144
$-1,228
Cash flow
-8.3%
Cash-on-Cash Return
4.2%
Cap rate
0.6%
Rent to Value Ratio
Active
$2,499,000
5
bds
|
5
ba
|
3,680
sqft
|
built
1975
491 SW 22nd Rd, Miami, FL 33129
$-6,884
Cash flow
-14.4%
Cash-on-Cash Return
2.8%
Cap rate
0.4%
Rent to Value Ratio
Active
$875,000
4
bds
|
3
ba
|
2,435
sqft
|
built
1996
1994 SW 142nd Ave, Miami, FL 33175
$-2,606
Cash flow
-15.5%
Cash-on-Cash Return
2.6%
Cap rate
0.5%
Rent to Value Ratio

Active
$795,000
3
bds
|
2
ba
|
1,232
sqft
|
built
2004
1200 Brickell Bay Dr, Miami, FL 33131
$-1,983
Cash flow
-13.0%
Cash-on-Cash Return
3.2%
Cap rate
0.7%
Rent to Value Ratio

Active
$1,190,000
3
bds
|
3
ba
|
1,395
sqft
|
built
2015
460 NE 28th St, Miami, FL 33137
$-2,922
Cash flow
-12.8%
Cash-on-Cash Return
3.2%
Cap rate
0.7%
Rent to Value Ratio
Active
$1,350,000
4
bds
|
0
ba
|
2,638
sqft
|
built
1925
1865 NW 16th St, Miami, FL 33125
$-5,878
Cash flow
-22.7%
Cash-on-Cash Return
0.9%
Cap rate
0.2%
Rent to Value Ratio

Active
$375,450
3
bds
|
2
ba
|
1,214
sqft
|
built
2002
9340 Fontainebleau Blvd, Miami, FL 33172
$-973
Cash flow
-13.5%
Cash-on-Cash Return
3.0%
Cap rate
0.8%
Rent to Value Ratio

Active
$710,000
1
bds
|
2
ba
|
838
sqft
|
built
2018
801 S Miami Ave, Miami, FL 33130
$-2,710
Cash flow
-19.9%
Cash-on-Cash Return
1.6%
Cap rate
0.6%
Rent to Value Ratio

Active
$599,000
1
bds
|
2
ba
|
833
sqft
|
built
2018
501 NE 31st St, Miami, FL 33137
$-2,608
Cash flow
-22.7%
Cash-on-Cash Return
0.9%
Cap rate
0.6%
Rent to Value Ratio

Active
$675,000
3
bds
|
2
ba
|
1,130
sqft
|
built
1949
7130 SW 4th St, Miami, FL 33144
$-1,149
Cash flow
-8.9%
Cash-on-Cash Return
4.1%
Cap rate
0.7%
Rent to Value Ratio
Active
$1,050,000
2
bds
|
3
ba
|
1,547
sqft
|
built
2019
851 NE 1st Ave, Miami, FL 33132
$-4,932
Cash flow
-24.5%
Cash-on-Cash Return
0.5%
Cap rate
0.6%
Rent to Value Ratio
Active
$260,000
1
bds
|
1
ba
|
798
sqft
|
built
1972
816 NW 87th Ave, Miami, FL 33172
$-456
Cash flow
-9.2%
Cash-on-Cash Return
4.0%
Cap rate
0.8%
Rent to Value Ratio

Active
$1,299,000
2
bds
|
2
ba
|
1,529
sqft
|
built
2004
1331 Brickell Bay Dr, Miami, FL 33131
$-6,057
Cash flow
-24.3%
Cash-on-Cash Return
0.6%
Cap rate
0.6%
Rent to Value Ratio
Active
$625,000
4
bds
|
0
ba
|
1,378
sqft
|
built
1970
5752 NW 1st Ave, Miami, FL 33127
$-2,302
Cash flow
-19.2%
Cash-on-Cash Return
1.7%
Cap rate
0.4%
Rent to Value Ratio
Active
$1,630,000
6
bds
|
3
ba
|
2,431
sqft
|
built
1956
11975 W Biscayne Canal Rd, Miami, FL 33161
$-3,053
Cash flow
-9.8%
Cash-on-Cash Return
3.9%
Cap rate
0.6%
Rent to Value Ratio
Active
$350,000
2
bds
|
2
ba
|
930
sqft
|
built
1980
605 NW 72nd Ave, Miami, FL 33126
$-456
Cash flow
-6.8%
Cash-on-Cash Return
4.6%
Cap rate
0.7%
Rent to Value Ratio
Active
$219,000
1
bds
|
2
ba
|
801
sqft
|
built
1969
8550 SW 109th Ave, Miami, FL 33173
$-300
Cash flow
-7.1%
Cash-on-Cash Return
4.5%
Cap rate
0.9%
Rent to Value Ratio
Active
$380,000
2
bds
|
2
ba
|
950
sqft
|
built
2007
36 NW 6th Ave, Miami, FL 33128
$-1,388
Cash flow
-19.1%
Cash-on-Cash Return
1.8%
Cap rate
0.7%
Rent to Value Ratio
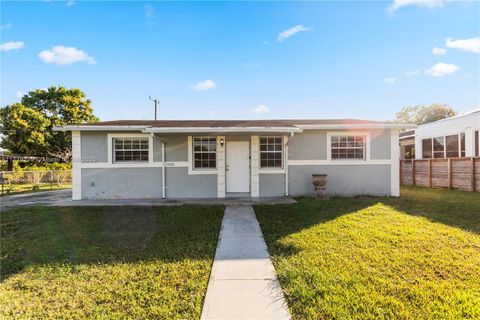
Active
$170,000
1
bds
|
1
ba
|
840
sqft
|
built
1972
15600 NW 7th Ave, Miami, FL 33169
$-344
Cash flow
-10.6%
Cash-on-Cash Return
3.7%
Cap rate
0.9%
Rent to Value Ratio
Active
$860,000
4
bds
|
3
ba
|
3,248
sqft
|
built
1997
13850 SW 153rd Pl, Miami, FL 33196
$-1,394
Cash flow
-8.5%
Cash-on-Cash Return
4.2%
Cap rate
0.6%
Rent to Value Ratio

Active
$1,100,000
1
bds
|
2
ba
|
870
sqft
|
built
2019
1000 Brickell Plz, Miami, FL 33131
$-3,701
Cash flow
-17.6%
Cash-on-Cash Return
2.1%
Cap rate
0.6%
Rent to Value Ratio
Active
$2,500,000
6
bds
|
5
ba
|
5,116
sqft
|
built
1982
9260 SW 101st St, Miami, FL 33176
$-8,319
Cash flow
-17.4%
Cash-on-Cash Return
2.2%
Cap rate
0.4%
Rent to Value Ratio
Active
$730,000
2
bds
|
3
ba
|
1,672
sqft
|
built
1985
7150 SW 55th Ter W, Miami, FL 33155
$-2,259
Cash flow
-16.1%
Cash-on-Cash Return
2.4%
Cap rate
0.5%
Rent to Value Ratio
Active
$1,185,000
3
bds
|
3
ba
|
1,527
sqft
|
built
2020
545 SW 11th St, Miami, FL 33129
$-4,129
Cash flow
-18.2%
Cash-on-Cash Return
2.0%
Cap rate
0.6%
Rent to Value Ratio
Active
$520,000
3
bds
|
2
ba
|
1,155
sqft
|
built
1969
11470 SW 199th St, Miami, FL 33157
$-1,163
Cash flow
-11.7%
Cash-on-Cash Return
3.5%
Cap rate
0.6%
Rent to Value Ratio
Active
$180,000
1
bds
|
2
ba
|
898
sqft
|
built
1969
1401 NE 191st St, Miami, FL 33179
$-372
Cash flow
-10.8%
Cash-on-Cash Return
3.7%
Cap rate
1.0%
Rent to Value Ratio