Miami, FL Investment Properties for Sale
Browse homes for sale and investment properties in Miami, FL. Refine your search by price, property type, or more.
Best cash flowing properties in Miami, FL
Active
$259,900
2
bds
|
2
ba
|
1,006
sqft
|
built
1974
9390 W Flagler St, Miami, FL 33174
$-228
Cash flow
-4.6%
Cash-on-Cash Return
5.1%
Cap rate
1.0%
Rent to Value Ratio
Active
$200,000
1
bds
|
1
ba
|
700
sqft
|
built
1968
7410 SW 82nd St, Miami, FL 33143
$-390
Cash flow
-10.2%
Cash-on-Cash Return
3.8%
Cap rate
1.0%
Rent to Value Ratio
6,499 out of 7,362 properties for sale in Miami, FL
Limited Results Shown
Create a free account, or log in to reveal all property listings and enjoy the complete experience.
Active
$750,000
1
bds
|
2
ba
|
889
sqft
|
built
2016
88 SW 7th St, Miami, FL 33130
$-2,698
Cash flow
-18.8%
Cash-on-Cash Return
1.8%
Cap rate
0.7%
Rent to Value Ratio

Active
$879,000
4
bds
|
3
ba
|
2,153
sqft
|
built
1981
14630 SW 148th Ct, Miami, FL 33196
$-2,476
Cash flow
-14.7%
Cash-on-Cash Return
2.8%
Cap rate
0.5%
Rent to Value Ratio
Active
$510,000
4
bds
|
2
ba
|
1,200
sqft
|
built
1940
2365 NW 68th St, Miami, FL 33147
$-629
Cash flow
-6.4%
Cash-on-Cash Return
4.7%
Cap rate
0.6%
Rent to Value Ratio
Active
$462,000
2
bds
|
2
ba
|
1,054
sqft
|
built
2004
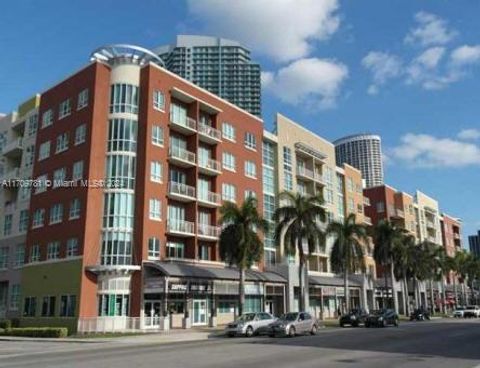
2000 N Bayshore Dr, Miami, FL 33137
$-1,291
Cash flow
-14.6%
Cash-on-Cash Return
2.8%
Cap rate
0.8%
Rent to Value Ratio
Active
$1,150,000
2
bds
|
3
ba
|
1,647
sqft
|
built
2009
1100 Biscayne Blvd, Miami, FL 33132
$-4,443
Cash flow
-20.2%
Cash-on-Cash Return
1.5%
Cap rate
0.6%
Rent to Value Ratio
Active
$850,000
3
bds
|
2
ba
|
1,577
sqft
|
built
1959
17815 NE 7th Ct, Miami, FL 33162
$-2,399
Cash flow
-14.7%
Cash-on-Cash Return
2.8%
Cap rate
0.5%
Rent to Value Ratio
Active
$310,000
2
bds
|
2
ba
|
936
sqft
|
built
1981
10835 SW 112th Ave, Miami, FL 33176
$-586
Cash flow
-9.9%
Cash-on-Cash Return
3.9%
Cap rate
0.8%
Rent to Value Ratio
Active
$685,000
1
bds
|
1
ba
|
790
sqft
|
built
2009
485 Brickell Ave, Miami, FL 33131
$-1,739
Cash flow
-13.2%
Cash-on-Cash Return
3.1%
Cap rate
0.7%
Rent to Value Ratio
Active
$339,000
1
bds
|
1
ba
|
600
sqft
|
built
1998
185 SE 14th Ter, Miami, FL 33131
$-1,403
Cash flow
-21.6%
Cash-on-Cash Return
1.2%
Cap rate
0.7%
Rent to Value Ratio
Active
$250,000
1
bds
|
2
ba
|
710
sqft
|
built
1972
1650 NE 115th St, Miami, FL 33181
$-794
Cash flow
-16.6%
Cash-on-Cash Return
2.3%
Cap rate
0.9%
Rent to Value Ratio
Active
$1,738,000
3
bds
|
2
ba
|
1,720
sqft
|
built
1956
1431 Ancona Ave, Miami, FL 33146
$-3,935
Cash flow
-11.8%
Cash-on-Cash Return
3.4%
Cap rate
0.5%
Rent to Value Ratio

Active
$785,000
2
bds
|
2
ba
|
1,555
sqft
|
built
1982
520 Brickell Key Dr, Miami, FL 33131
$-3,173
Cash flow
-21.1%
Cash-on-Cash Return
1.3%
Cap rate
0.6%
Rent to Value Ratio
Active
$399,000
1
bds
|
1
ba
|
539
sqft
|
built
2008
300 S Biscayne Blvd, Miami, FL 33131
$-1,157
Cash flow
-15.1%
Cash-on-Cash Return
2.7%
Cap rate
0.7%
Rent to Value Ratio
Active
$2,750,000
6
bds
|
6
ba
|
4,069
sqft
|
built
2014
9402 SW 83rd Ave, Miami, FL 33156
$-9,884
Cash flow
-18.8%
Cash-on-Cash Return
1.8%
Cap rate
0.4%
Rent to Value Ratio
Active
$525,000
3
bds
|
2
ba
|
1,397
sqft
|
built
1981
15046 SW 142nd Ct, Miami, FL 33186
$-631
Cash flow
-6.3%
Cash-on-Cash Return
4.7%
Cap rate
0.7%
Rent to Value Ratio
Active
$650,000
4
bds
|
3
ba
|
1,987
sqft
|
built
1989
7821 SW 9th Ter, Miami, FL 33144
$-1,635
Cash flow
-13.1%
Cash-on-Cash Return
3.1%
Cap rate
0.6%
Rent to Value Ratio
Active
$200,000
1
bds
|
1
ba
|
700
sqft
|
built
1968
7410 SW 82nd St, Miami, FL 33143
$-390
Cash flow
-10.2%
Cash-on-Cash Return
3.8%
Cap rate
1.0%
Rent to Value Ratio

Active
$1,080,000
2
bds
|
3
ba
|
1,187
sqft
|
built
2019
480 NE 31st St, Miami, FL 33137
$-3,626
Cash flow
-17.5%
Cash-on-Cash Return
2.1%
Cap rate
0.7%
Rent to Value Ratio

Active
$660,000
3
bds
|
2
ba
|
1,332
sqft
|
built
2004
2000 N Bayshore Dr, Miami, FL 33137
$-2,227
Cash flow
-17.6%
Cash-on-Cash Return
2.1%
Cap rate
0.7%
Rent to Value Ratio
Active
$269,000
2
bds
|
2
ba
|
1,081
sqft
|
built
1971
3475 N Country Club Dr, Miami, FL 33180
$-686
Cash flow
-13.3%
Cash-on-Cash Return
3.1%
Cap rate
0.9%
Rent to Value Ratio
Active
$369,000
1
bds
|
1
ba
|
760
sqft
|
built
2001
1155 Brickell Bay Dr, Miami, FL 33131
$-1,405
Cash flow
-19.9%
Cash-on-Cash Return
1.6%
Cap rate
0.9%
Rent to Value Ratio
Active
$9,750,000
4
bds
|
5
ba
|
3,365
sqft
|
built
2020
2811 S Bayshore Dr, Miami, FL 33133
$-61,119
Cash flow
-32.7%
Cash-on-Cash Return
-1.4%
Cap rate
0.1%
Rent to Value Ratio

Active
$1,522,999
4
bds
|
3
ba
|
1,787
sqft
|
built
1962
2325 NE 194th St, Miami, FL 33180
$-3,498
Cash flow
-12.0%
Cash-on-Cash Return
3.4%
Cap rate
0.5%
Rent to Value Ratio
Active
$315,000
3
bds
|
2
ba
|
1,200
sqft
|
built
1968
7410 SW 82nd St, Miami, FL 33143
$-1,053
Cash flow
-17.4%
Cash-on-Cash Return
2.1%
Cap rate
0.8%
Rent to Value Ratio
Active
$215,000
1
bds
|
1
ba
|
717
sqft
|
built
1972
3301 N Country Club Dr, Miami, FL 33180
$-820
Cash flow
-19.9%
Cash-on-Cash Return
1.6%
Cap rate
0.9%
Rent to Value Ratio
Active
$760,000
4
bds
|
4
ba
|
1,956
sqft
|
built
2003
15226 SW 21st Ln, Miami, FL 33185
$-1,652
Cash flow
-11.3%
Cash-on-Cash Return
3.5%
Cap rate
0.6%
Rent to Value Ratio
Active
$1,099,000
2
bds
|
3
ba
|
1,265
sqft
|
built
2016
68 SE 6th St, Miami, FL 33131
$-3,843
Cash flow
-18.2%
Cash-on-Cash Return
2.0%
Cap rate
0.7%
Rent to Value Ratio
Active
$650,000
2
bds
|
1
ba
|
1,297
sqft
|
built
1949
2350 SW 22nd Ave, Miami, FL 33145
$-2,113
Cash flow
-17.0%
Cash-on-Cash Return
2.2%
Cap rate
0.4%
Rent to Value Ratio

Active
$3,495,000
3
bds
|
5
ba
|
2,525
sqft
|
built
2020
1000 Brickell Plz, Miami, FL 33131
$-19,147
Cash flow
-28.6%
Cash-on-Cash Return
-0.4%
Cap rate
0.3%
Rent to Value Ratio
Active
$425,000
2
bds
|
2
ba
|
1,268
sqft
|
built
1982
4000 Towerside Ter, Miami, FL 33138
$-1,023
Cash flow
-12.6%
Cash-on-Cash Return
3.3%
Cap rate
1.1%
Rent to Value Ratio
Active
$1,150,000
2
bds
|
2
ba
|
1,296
sqft
|
built
2016
88 SW 7th St, Miami, FL 33130
$-5,676
Cash flow
-25.8%
Cash-on-Cash Return
0.2%
Cap rate
0.5%
Rent to Value Ratio

Active
$575,000
1
bds
|
1
ba
|
850
sqft
|
built
2006
725 NE 22nd St, Miami, FL 33137
$-1,682
Cash flow
-15.3%
Cash-on-Cash Return
2.6%
Cap rate
0.7%
Rent to Value Ratio
Active
$830,000
1
bds
|
2
ba
|
1,185
sqft
|
built
2019
851 NE 1st Ave, Miami, FL 33132
$-3,783
Cash flow
-23.8%
Cash-on-Cash Return
0.7%
Cap rate
0.6%
Rent to Value Ratio

Active
$1,250,000
2
bds
|
2
ba
|
1,206
sqft
|
built
2016
88 SW 7th St, Miami, FL 33130
$-5,028
Cash flow
-21.0%
Cash-on-Cash Return
1.3%
Cap rate
0.6%
Rent to Value Ratio
Active
$1,125,000
4
bds
|
2
ba
|
2,229
sqft
|
built
1996
19331 SW 188th St, Miami, FL 33187
$-3,666
Cash flow
-17.0%
Cash-on-Cash Return
2.2%
Cap rate
0.4%
Rent to Value Ratio

Active
$550,000
2
bds
|
2
ba
|
1,180
sqft
|
built
2007
3232 SW 22nd Ter, Miami, FL 33145
$-1,778
Cash flow
-16.9%
Cash-on-Cash Return
2.3%
Cap rate
0.7%
Rent to Value Ratio
Active
$399,000
2
bds
|
2
ba
|
1,011
sqft
|
built
1981
20505 E Country Club Dr, Miami, FL 33180
$-1,564
Cash flow
-20.5%
Cash-on-Cash Return
1.4%
Cap rate
0.7%
Rent to Value Ratio
Active
$259,900
2
bds
|
2
ba
|
1,006
sqft
|
built
1974
9390 W Flagler St, Miami, FL 33174
$-228
Cash flow
-4.6%
Cash-on-Cash Return
5.1%
Cap rate
1.0%
Rent to Value Ratio
Active
$1,649,000
5
bds
|
5
ba
|
2,986
sqft
|
built
2008
2913 SW 13th St, Miami, FL 33145
$-2,991
Cash flow
-9.5%
Cash-on-Cash Return
4.0%
Cap rate
0.5%
Rent to Value Ratio

Active
$3,495,000
3
bds
|
5
ba
|
2,680
sqft
|
built
2020
3581 E Glencoe St, Miami, FL 33133
$-20,527
Cash flow
-30.6%
Cash-on-Cash Return
-0.9%
Cap rate
0.3%
Rent to Value Ratio