Miami, FL Investment Properties for Sale
Browse homes for sale and investment properties in Miami, FL. Refine your search by price, property type, or more.
Best cash flowing properties in Miami, FL

Active
$399,000
4
bds
|
2
ba
|
1,213
sqft
|
built
1988
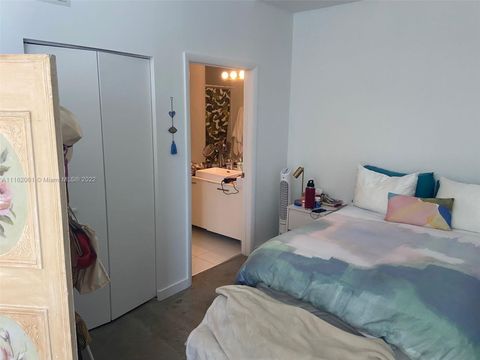
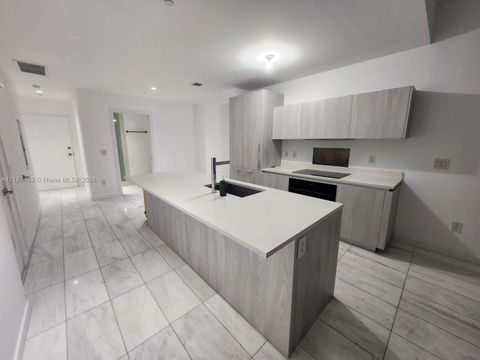
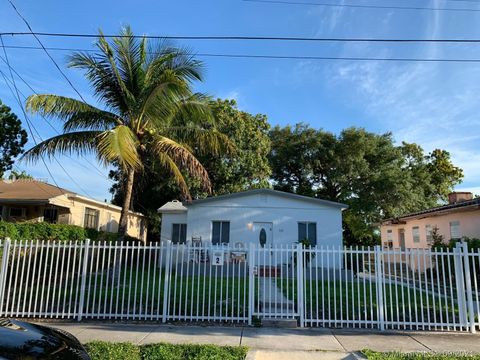
546 SW 1st St, Miami, FL 33130
$-589
Cash flow
-7.7%
Cash-on-Cash Return
4.4%
Cap rate
0.7%
Rent to Value Ratio
Active
$450,000
1
bds
|
1
ba
|
738
sqft
|
built
2008
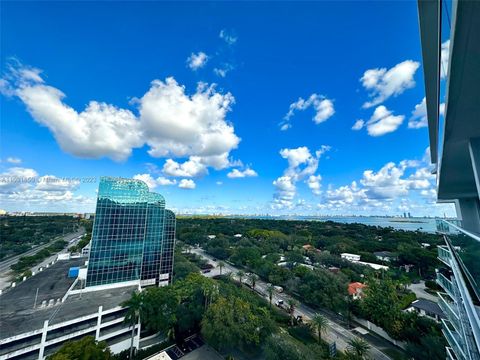
55 SE 6th St, Miami, FL 33131
$-1,135
Cash flow
-13.2%
Cash-on-Cash Return
3.1%
Cap rate
0.7%
Rent to Value Ratio
6,455 out of 7,312 properties for sale in Miami, FL
Limited Results Shown
Create a free account, or log in to reveal all property listings and enjoy the complete experience.

Active
$1,000,000
4
bds
|
0
ba
|
1,602
sqft
|
built
1926
154 SW 18th Ct, Miami, FL 33135
$-3,183
Cash flow
-16.6%
Cash-on-Cash Return
2.3%
Cap rate
0.4%
Rent to Value Ratio
Active
$550,000
1
bds
|
2
ba
|
621
sqft
|
built
2018
121 NE 34th St, Miami, FL 33137
$-1,378
Cash flow
-13.1%
Cash-on-Cash Return
3.1%
Cap rate
0.5%
Rent to Value Ratio
Active
$1,490,000
3
bds
|
4
ba
|
2,204
sqft
|
built
2019
851 NE 1st Ave, Miami, FL 33132
$-4,557
Cash flow
-16.0%
Cash-on-Cash Return
2.5%
Cap rate
0.7%
Rent to Value Ratio
Active
$865,000
3
bds
|
2
ba
|
1,672
sqft
|
built
1924
1703 SW 10th St, Miami, FL 33135
$-3,042
Cash flow
-18.3%
Cash-on-Cash Return
1.9%
Cap rate
0.3%
Rent to Value Ratio
Active
$450,000
1
bds
|
1
ba
|
526
sqft
|
built
2016
151 SE 1st St, Miami, FL 33131
$-1,650
Cash flow
-19.1%
Cash-on-Cash Return
1.7%
Cap rate
0.5%
Rent to Value Ratio
Active
$950,000
2
bds
|
3
ba
|
1,186
sqft
|
built
2019
480 NE 31st St, Miami, FL 33137
$-3,157
Cash flow
-17.3%
Cash-on-Cash Return
2.2%
Cap rate
0.6%
Rent to Value Ratio
Active
$1,200,000
2
bds
|
0
ba
|
1,620
sqft
|
built
1923
68 NW 45th St, Miami, FL 33127
$-4,084
Cash flow
-17.8%
Cash-on-Cash Return
2.1%
Cap rate
0.3%
Rent to Value Ratio
Active
$496,000
2
bds
|
2
ba
|
1,183
sqft
|
built
2015
4250 Biscayne Blvd, Miami, FL 33137
$-2,787
Cash flow
-29.3%
Cash-on-Cash Return
-0.6%
Cap rate
0.7%
Rent to Value Ratio
Active
$399,000
4
bds
|
2
ba
|
1,213
sqft
|
built
1988
546 SW 1st St, Miami, FL 33130
$-589
Cash flow
-7.7%
Cash-on-Cash Return
4.4%
Cap rate
0.7%
Rent to Value Ratio
Active
$465,000
1
bds
|
1
ba
|
630
sqft
|
built
2006
170 SE 14th St, Miami, FL 33131
$-1,187
Cash flow
-13.3%
Cash-on-Cash Return
3.1%
Cap rate
0.7%
Rent to Value Ratio
Active
$465,000
1
bds
|
1
ba
|
630
sqft
|
built
2006
170 SE 14th St, Miami, FL 33131
$-1,609
Cash flow
-18.1%
Cash-on-Cash Return
2.0%
Cap rate
0.5%
Rent to Value Ratio
Active
$7,500,000
4
bds
|
6
ba
|
4,876
sqft
|
built
2019
1000 Biscayne Blvd, Miami, FL 33132
$-49,222
Cash flow
-34.2%
Cash-on-Cash Return
-1.6%
Cap rate
0.1%
Rent to Value Ratio
Active
$4,000,000
3
bds
|
3
ba
|
1,520
sqft
|
built
2006
160 NW 27th St, Miami, FL 33127
$-17,975
Cash flow
-23.4%
Cash-on-Cash Return
0.8%
Cap rate
0.1%
Rent to Value Ratio
Active
$565,900
1
bds
|
2
ba
|
822
sqft
|
built
2008
200 Biscayne Boulevard Way, Miami, FL 33131
$-1,892
Cash flow
-17.4%
Cash-on-Cash Return
2.1%
Cap rate
0.7%
Rent to Value Ratio
Active
$450,000
1
bds
|
1
ba
|
738
sqft
|
built
2008
55 SE 6th St, Miami, FL 33131
$-1,135
Cash flow
-13.2%
Cash-on-Cash Return
3.1%
Cap rate
0.7%
Rent to Value Ratio