Miami, FL Investment Properties for Sale
Browse homes for sale and investment properties in Miami, FL. Refine your search by price, property type, or more.
Best cash flowing properties in Miami, FL

Active
$274,900
2
bds
|
2
ba
|
812
sqft
|
built
1986
7011 SW 129th Ave, Miami, FL 33183
$-429
Cash flow
-8.1%
Cash-on-Cash Return
4.4%
Cap rate
0.8%
Rent to Value Ratio

Active
$275,000
2
bds
|
2
ba
|
1,114
sqft
|
built
1973
310 NW 107th Ave, Miami, FL 33172
$-478
Cash flow
-9.1%
Cash-on-Cash Return
4.2%
Cap rate
0.9%
Rent to Value Ratio
6,070 out of 6,896 properties for sale in Miami, FL
Limited Results Shown
Create a free account, or log in to reveal all property listings and enjoy the complete experience.
Active
$445,555
2
bds
|
1
ba
|
736
sqft
|
built
2016
151 SE 1st St, Miami, FL 33131
$-1,699
Cash flow
-19.9%
Cash-on-Cash Return
1.7%
Cap rate
0.7%
Rent to Value Ratio
Active
$720,000
2
bds
|
3
ba
|
1,316
sqft
|
built
1983
1627 Brickell Ave, Miami, FL 33129
$-2,836
Cash flow
-20.6%
Cash-on-Cash Return
1.5%
Cap rate
0.7%
Rent to Value Ratio
Active
$3,725,000
4
bds
|
5
ba
|
3,244
sqft
|
built
2016
88 SW 7th St, Miami, FL 33130
$-20,481
Cash flow
-28.7%
Cash-on-Cash Return
-0.3%
Cap rate
0.3%
Rent to Value Ratio
Active
$519,900
3
bds
|
3
ba
|
1,848
sqft
|
built
1996
7081 SW 158th Ct, Miami, FL 33193
$-818
Cash flow
-8.2%
Cash-on-Cash Return
4.4%
Cap rate
0.6%
Rent to Value Ratio
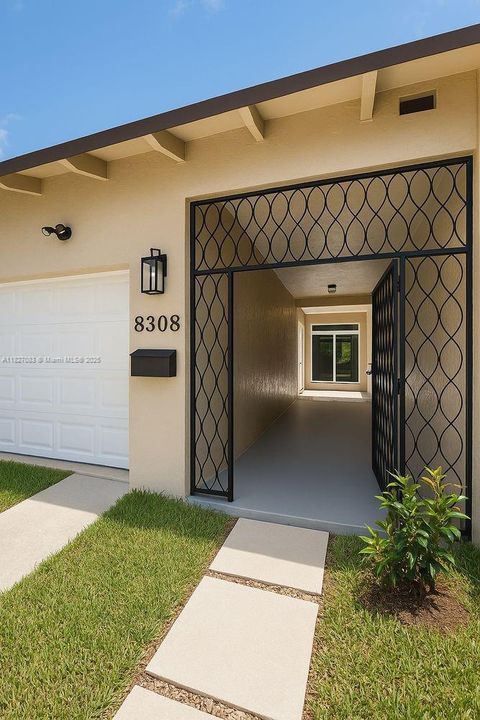
Active
$495,000
2
bds
|
2
ba
|
1,205
sqft
|
built
1969
8308 SW 103rd Ave, Miami, FL 33173
$-1,331
Cash flow
-14.0%
Cash-on-Cash Return
3.0%
Cap rate
0.6%
Rent to Value Ratio

Active
$349,000
2
bds
|
2
ba
|
950
sqft
|
built
2001
6416 SW 131st Path, Miami, FL 33183
$-599
Cash flow
-9.0%
Cash-on-Cash Return
4.2%
Cap rate
0.7%
Rent to Value Ratio

Active
$450,000
3
bds
|
1
ba
|
1,284
sqft
|
built
1963
2944 NW 61st St, Miami, FL 33142
$-611
Cash flow
-7.1%
Cash-on-Cash Return
4.6%
Cap rate
0.7%
Rent to Value Ratio

Active
$899,999
3
bds
|
2
ba
|
1,418
sqft
|
built
1940
876 NE 81st St, Miami, FL 33138
$-1,460
Cash flow
-8.5%
Cash-on-Cash Return
4.3%
Cap rate
0.6%
Rent to Value Ratio

Active
$510,000
3
bds
|
2
ba
|
1,390
sqft
|
built
1997
17482 SW 143rd Pl, Miami, FL 33177
$-708
Cash flow
-7.2%
Cash-on-Cash Return
4.6%
Cap rate
0.6%
Rent to Value Ratio

Active
$7,995,000
6
bds
|
7
ba
|
6,299
sqft
|
built
2021
6790 SW 72nd Ct, Miami, FL 33143
$-38,630
Cash flow
-25.2%
Cash-on-Cash Return
0.5%
Cap rate
0.1%
Rent to Value Ratio

Active
$579,000
3
bds
|
2
ba
|
1,296
sqft
|
built
1957
12140 SW 187th St, Miami, FL 33177
$-1,139
Cash flow
-10.3%
Cash-on-Cash Return
3.9%
Cap rate
0.6%
Rent to Value Ratio
Active
$299,999
2
bds
|
2
ba
|
1,248
sqft
|
built
1973
13953 SW 66th St, Miami, FL 33183
$-539
Cash flow
-9.4%
Cash-on-Cash Return
4.1%
Cap rate
0.9%
Rent to Value Ratio

Active
$1,200,000
3
bds
|
2
ba
|
1,583
sqft
|
built
1925
50 NW 34th Ter, Miami, FL 33127
$-4,773
Cash flow
-20.8%
Cash-on-Cash Return
1.5%
Cap rate
0.2%
Rent to Value Ratio
Active
$2,299,000
3
bds
|
3
ba
|
2,097
sqft
|
built
2009
495 Brickell Ave, Miami, FL 33131
$-9,481
Cash flow
-21.5%
Cash-on-Cash Return
1.3%
Cap rate
0.4%
Rent to Value Ratio

Active
$485,000
3
bds
|
2
ba
|
664
sqft
|
built
1940
741 NW 77th Ter, Miami, FL 33150
$-1,283
Cash flow
-13.8%
Cash-on-Cash Return
3.1%
Cap rate
0.5%
Rent to Value Ratio
Active
$275,000
2
bds
|
2
ba
|
1,114
sqft
|
built
1973
310 NW 107th Ave, Miami, FL 33172
$-478
Cash flow
-9.1%
Cash-on-Cash Return
4.2%
Cap rate
0.9%
Rent to Value Ratio

Active
$549,000
3
bds
|
2
ba
|
1,532
sqft
|
built
1993
8011 SW 158th Ave, Miami, FL 33193
$-1,195
Cash flow
-11.4%
Cash-on-Cash Return
3.7%
Cap rate
0.6%
Rent to Value Ratio

Active
$1,495,000
4
bds
|
2
ba
|
2,193
sqft
|
built
1960
6445 SW 52nd St, Miami, FL 33155
$-5,014
Cash flow
-17.5%
Cash-on-Cash Return
2.2%
Cap rate
0.4%
Rent to Value Ratio

Active
$699,000
4
bds
|
2
ba
|
1,909
sqft
|
built
1995
18033 SW 137th Ct, Miami, FL 33177
$-2,067
Cash flow
-15.4%
Cash-on-Cash Return
2.7%
Cap rate
0.5%
Rent to Value Ratio

Active
$1,050,000
4
bds
|
4
ba
|
0
sqft
|
built
2022
19410 SW 124th Ct, Miami, FL 33177
$-2,845
Cash flow
-14.1%
Cash-on-Cash Return
3.0%
Cap rate
0.4%
Rent to Value Ratio

Active
$1,600,000
4
bds
|
3
ba
|
2,816
sqft
|
built
2003
3403 SW 63rd Ave, Miami, FL 33155
$-4,302
Cash flow
-14.0%
Cash-on-Cash Return
3.0%
Cap rate
0.5%
Rent to Value Ratio

Active
$890,000
4
bds
|
3
ba
|
2,058
sqft
|
built
1989
13925 SW 26th Ter, Miami, FL 33175
$-2,233
Cash flow
-13.1%
Cash-on-Cash Return
3.3%
Cap rate
0.5%
Rent to Value Ratio

Active
$2,650,000
5
bds
|
3
ba
|
2,263
sqft
|
built
1939
3767 Royal Palm Ave, Miami, FL 33140
$-9,129
Cash flow
-18.0%
Cash-on-Cash Return
2.1%
Cap rate
0.3%
Rent to Value Ratio
Active
$274,900
2
bds
|
2
ba
|
812
sqft
|
built
1986
7011 SW 129th Ave, Miami, FL 33183
$-429
Cash flow
-8.1%
Cash-on-Cash Return
4.4%
Cap rate
0.8%
Rent to Value Ratio

Active
$400,000
3
bds
|
2
ba
|
2,195
sqft
|
built
1978
20100 NE 10th Place Way, Miami, FL 33179
$-845
Cash flow
-11.0%
Cash-on-Cash Return
3.7%
Cap rate
0.8%
Rent to Value Ratio

Active
$880,000
5
bds
|
4
ba
|
3,349
sqft
|
built
2023
21205 SW 127th Ct, Miami, FL 33177
$-2,635
Cash flow
-15.6%
Cash-on-Cash Return
2.7%
Cap rate
0.5%
Rent to Value Ratio

Active
$795,000
2
bds
|
2
ba
|
912
sqft
|
built
2017
2900 NE 7th Ave, Miami, FL 33137
$-2,891
Cash flow
-19.0%
Cash-on-Cash Return
1.9%
Cap rate
0.6%
Rent to Value Ratio

Active
$1,699,000
4
bds
|
3
ba
|
2,890
sqft
|
built
1962
8375 SW 89th St, Miami, FL 33156
$-4,550
Cash flow
-14.0%
Cash-on-Cash Return
3.1%
Cap rate
0.4%
Rent to Value Ratio

Active
$375,000
3
bds
|
3
ba
|
1,165
sqft
|
built
1980
6315 SW 138th Ct, Miami, FL 33183
$-1,197
Cash flow
-16.7%
Cash-on-Cash Return
2.4%
Cap rate
0.7%
Rent to Value Ratio

Active
$425,000
3
bds
|
2
ba
|
1,973
sqft
|
built
1954
19800 NW Miami Ct, Miami, FL 33169
$-669
Cash flow
-8.2%
Cash-on-Cash Return
4.4%
Cap rate
0.8%
Rent to Value Ratio

Active
$740,000
4
bds
|
2
ba
|
1,597
sqft
|
built
1995
13774 SW 181st Ter, Miami, FL 33177
$-1,782
Cash flow
-12.6%
Cash-on-Cash Return
3.4%
Cap rate
0.5%
Rent to Value Ratio

Active
$1,249,000
2
bds
|
2
ba
|
1,390
sqft
|
built
2009
495 Brickell Ave, Miami, FL 33131
$-4,673
Cash flow
-19.5%
Cash-on-Cash Return
1.8%
Cap rate
0.6%
Rent to Value Ratio

Active
$617,000
2
bds
|
2
ba
|
1,107
sqft
|
built
2004
2000 N Bayshore Dr, Miami, FL 33137
$-2,012
Cash flow
-17.0%
Cash-on-Cash Return
2.4%
Cap rate
0.6%
Rent to Value Ratio

Active
$2,225,000
4
bds
|
3
ba
|
2,277
sqft
|
built
1946
4531 SW 15th St, Miami, FL 33134
$-7,869
Cash flow
-18.5%
Cash-on-Cash Return
2.0%
Cap rate
0.4%
Rent to Value Ratio

Active
$2,125,000
4
bds
|
3
ba
|
2,634
sqft
|
built
1969
7980 SW 108th St, Miami, FL 33156
$-6,963
Cash flow
-17.1%
Cash-on-Cash Return
2.3%
Cap rate
0.3%
Rent to Value Ratio

Active
$360,000
1
bds
|
2
ba
|
842
sqft
|
built
2008
7275 SW 90th Way, Miami, FL 33156
$-1,182
Cash flow
-17.1%
Cash-on-Cash Return
2.3%
Cap rate
0.7%
Rent to Value Ratio

Active
$799,999
6
bds
|
5
ba
|
2,373
sqft
|
built
1950
2941 NW 96th St, Miami, FL 33147
$-2,586
Cash flow
-16.9%
Cash-on-Cash Return
2.4%
Cap rate
0.4%
Rent to Value Ratio

Active
$869,000
3
bds
|
3
ba
|
2,981
sqft
|
built
2001
16313 SW 66th St, Miami, FL 33193
$-2,478
Cash flow
-14.9%
Cash-on-Cash Return
2.8%
Cap rate
0.5%
Rent to Value Ratio

Active
$800,000
2
bds
|
2
ba
|
1,168
sqft
|
built
2015
600 NE 27th St, Miami, FL 33137
$-2,700
Cash flow
-17.6%
Cash-on-Cash Return
2.2%
Cap rate
0.6%
Rent to Value Ratio

Active
$410,000
2
bds
|
3
ba
|
1,330
sqft
|
built
1980
7074 SW 114th Pl, Miami, FL 33173
$-1,444
Cash flow
-18.4%
Cash-on-Cash Return
2.0%
Cap rate
0.7%
Rent to Value Ratio