Miami, FL Investment Properties for Sale
Browse homes for sale and investment properties in Miami, FL. Refine your search by price, property type, or more.
Best cash flowing properties in Miami, FL
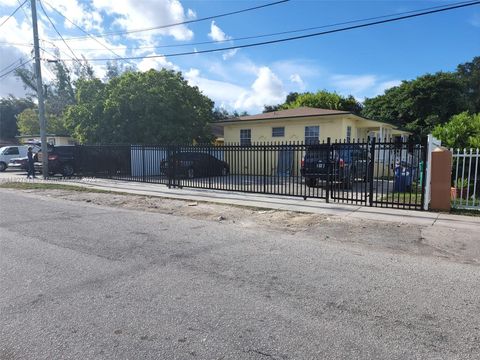
Active
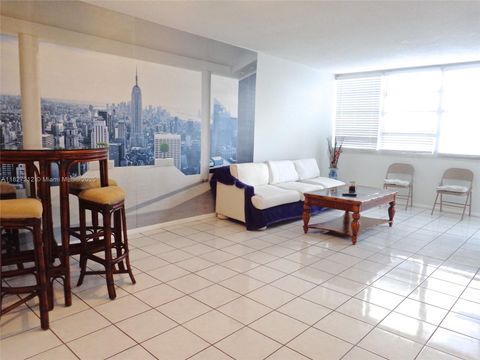
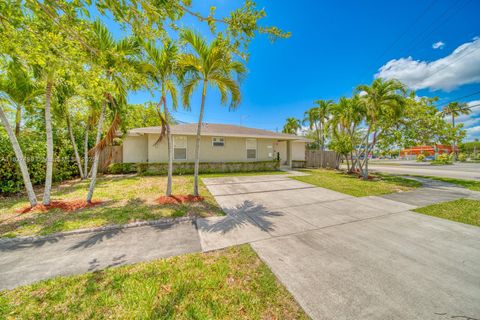
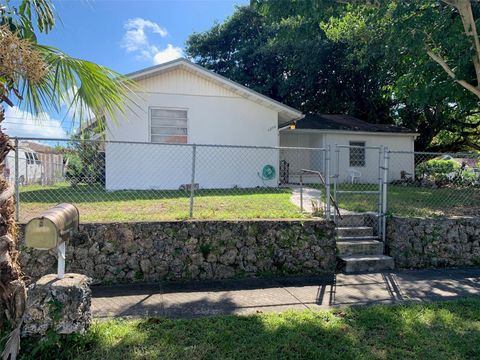
$129,000
1
bds
|
1
ba
|
801
sqft
|
built
1968
1301 NE Miami Gardens Dr, Miami, FL 33179
$25
Cash flow
1.0%
Cash-on-Cash Return
6.5%
Cap rate
1.4%
Rent to Value Ratio
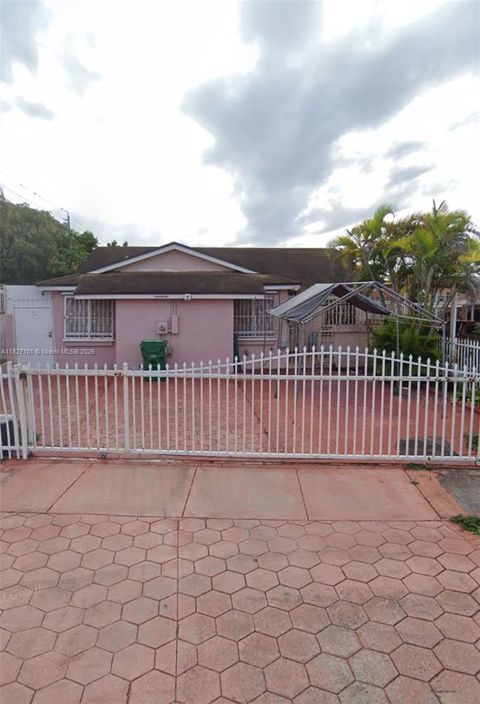
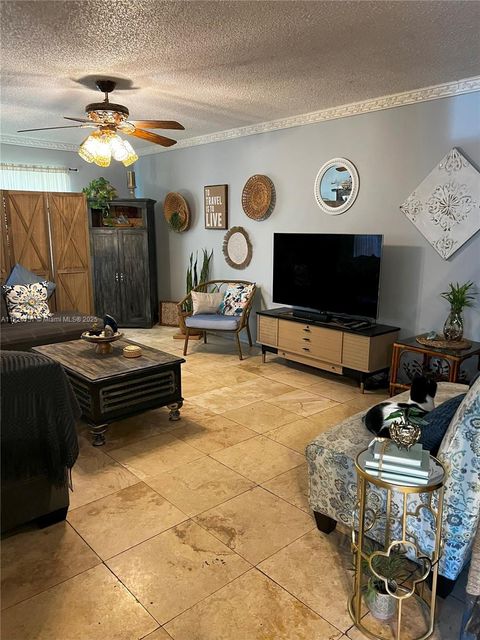
Active
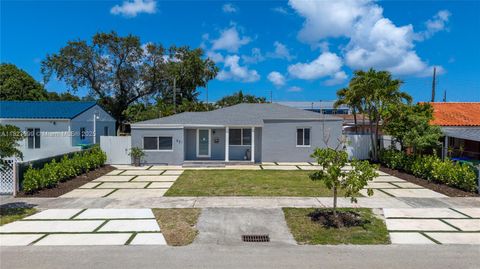
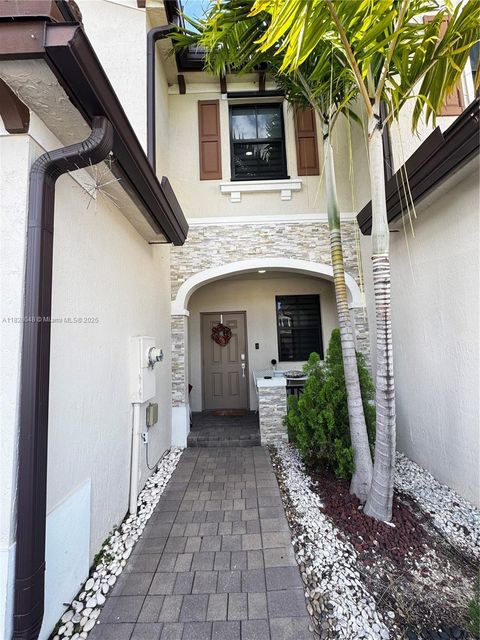
$494,999
3
bds
|
2
ba
|
1,661
sqft
|
built
1989
11912 SW 192nd Ter, Miami, FL 33177
$-547
Cash flow
-5.8%
Cash-on-Cash Return
4.9%
Cap rate
0.6%
Rent to Value Ratio
6,464 out of 7,322 properties for sale in Miami, FL
Limited Results Shown
Create a free account, or log in to reveal all property listings and enjoy the complete experience.
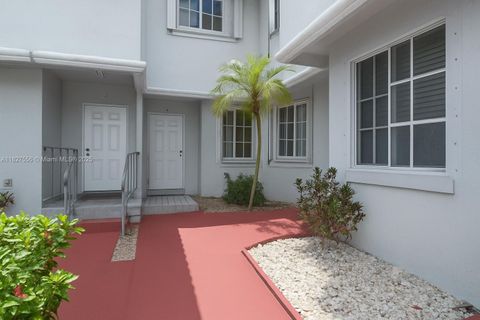
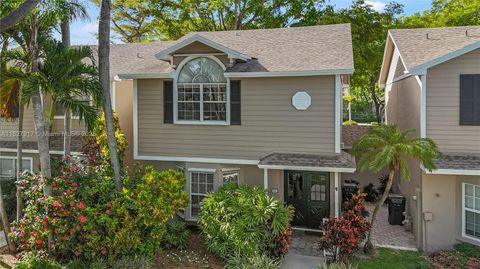
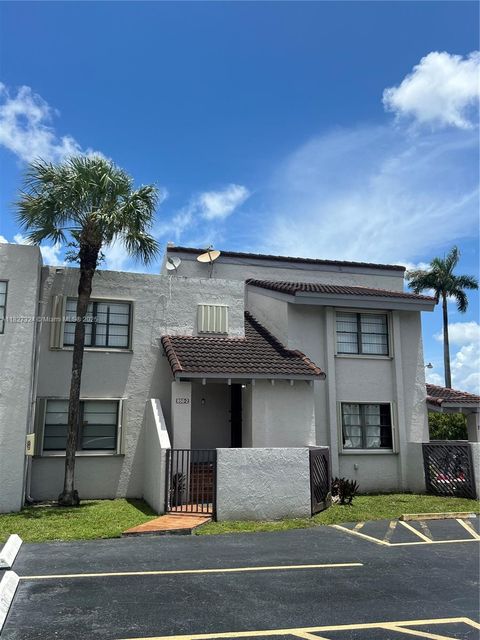
Active
$450,000
3
bds
|
3
ba
|
1,780
sqft
|
built
1996
8260 NW 10th St, Miami, FL 33126
$-1,159
Cash flow
-13.4%
Cash-on-Cash Return
3.2%
Cap rate
0.6%
Rent to Value Ratio

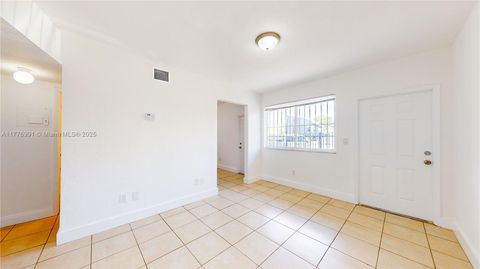
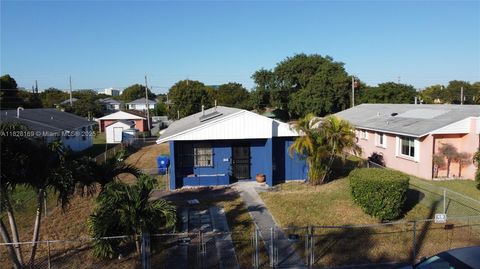
Active
$965,000
3
bds
|
3
ba
|
1,480
sqft
|
built
1994
3136 Virginia St, Miami, FL 33133
$-3,163
Cash flow
-17.1%
Cash-on-Cash Return
2.2%
Cap rate
0.5%
Rent to Value Ratio
Active
$975,000
8
bds
|
0
ba
|
2,968
sqft
|
built
1965
1190 NW 65th St, Miami, FL 33150
$-4,196
Cash flow
-22.5%
Cash-on-Cash Return
1.1%
Cap rate
0.3%
Rent to Value Ratio
Active
$369,000
1
bds
|
2
ba
|
835
sqft
|
built
2004
455 NE 25th St, Miami, FL 33137
$-1,293
Cash flow
-18.3%
Cash-on-Cash Return
2.1%
Cap rate
0.7%
Rent to Value Ratio
Active
$625,000
2
bds
|
2
ba
|
1,068
sqft
|
built
2008
333 NE 24th St, Miami, FL 33137
$-2,208
Cash flow
-18.4%
Cash-on-Cash Return
2.0%
Cap rate
0.6%
Rent to Value Ratio

Active
$575,000
3
bds
|
3
ba
|
1,680
sqft
|
built
1972
7909 SW 105th Ave, Miami, FL 33173
$-1,230
Cash flow
-11.2%
Cash-on-Cash Return
3.7%
Cap rate
0.6%
Rent to Value Ratio
Active
$443,000
1
bds
|
2
ba
|
615
sqft
|
built
2008
60 SW 13th St, Miami, FL 33130
$-724
Cash flow
-8.5%
Cash-on-Cash Return
4.3%
Cap rate
0.7%
Rent to Value Ratio
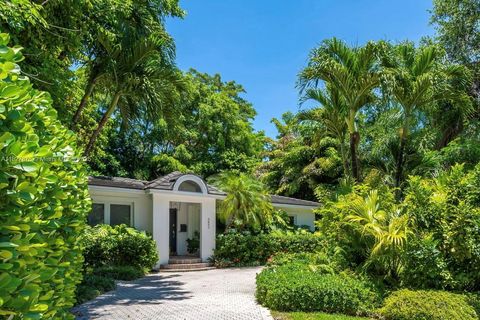
Active
$1,899,000
3
bds
|
2
ba
|
1,809
sqft
|
built
1959
3865 Poinciana Ave, Miami, FL 33133
$-6,661
Cash flow
-18.3%
Cash-on-Cash Return
2.1%
Cap rate
0.3%
Rent to Value Ratio

Active
$959,000
2
bds
|
2
ba
|
1,263
sqft
|
built
2008
3301 NE 1st Ave, Miami, FL 33137
$-3,746
Cash flow
-20.4%
Cash-on-Cash Return
1.6%
Cap rate
0.6%
Rent to Value Ratio
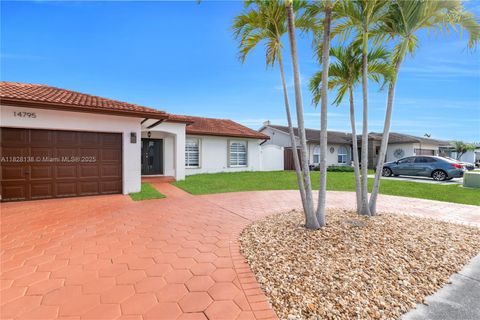
Active
$725,000
3
bds
|
2
ba
|
1,345
sqft
|
built
1995
14795 SW 174th St, Miami, FL 33187
$-1,686
Cash flow
-12.1%
Cash-on-Cash Return
3.5%
Cap rate
0.5%
Rent to Value Ratio
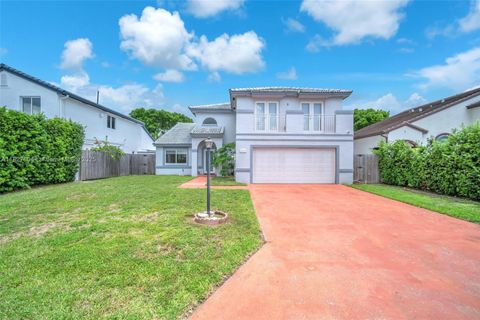
Active
$749,000
4
bds
|
3
ba
|
2,212
sqft
|
built
1993
16173 SW 72nd Ter, Miami, FL 33193
$-2,237
Cash flow
-15.6%
Cash-on-Cash Return
2.7%
Cap rate
0.5%
Rent to Value Ratio
Active
$285,000
bds
|
1
ba
|
508
sqft
|
built
2007
1750 N Bayshore Dr, Miami, FL 33132
$-1,472
Cash flow
-26.9%
Cash-on-Cash Return
0.1%
Cap rate
0.7%
Rent to Value Ratio
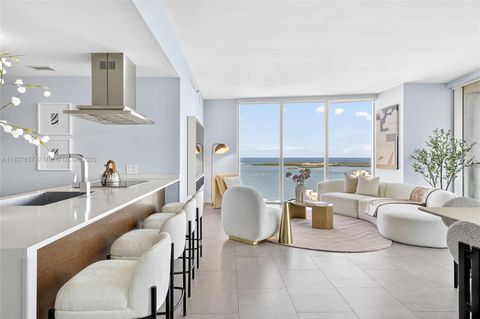
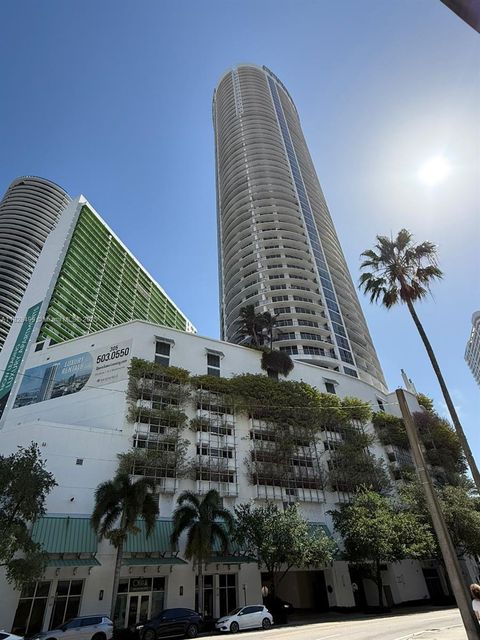
Active
$1,770,000
3
bds
|
2
ba
|
1,870
sqft
|
built
2009
495 Brickell Ave, Miami, FL 33131
$-6,262
Cash flow
-18.5%
Cash-on-Cash Return
2.0%
Cap rate
0.6%
Rent to Value Ratio
Active
$1,100,000
3
bds
|
3
ba
|
1,513
sqft
|
built
2006
31 SE 5th St, Miami, FL 33131
$-3,806
Cash flow
-18.1%
Cash-on-Cash Return
2.1%
Cap rate
0.6%
Rent to Value Ratio
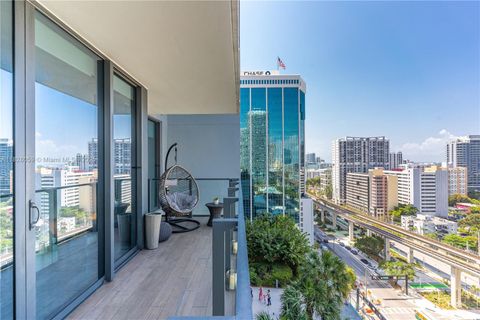
Active
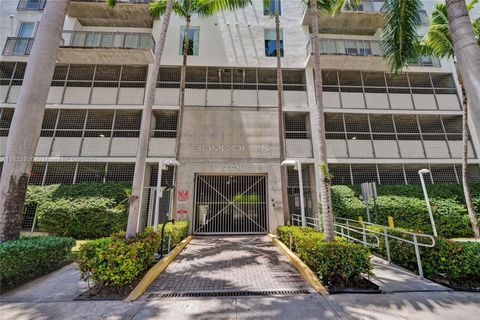
$295,000
1
bds
|
2
ba
|
600
sqft
|
built
1991
540 Brickell Key Dr, Miami, FL 33131
$-1,370
Cash flow
-24.2%
Cash-on-Cash Return
0.7%
Cap rate
0.7%
Rent to Value Ratio
Active
$1,185,000
2
bds
|
2
ba
|
1,642
sqft
|
built
1981
3 Grove Isle Dr, Miami, FL 33133
$-6,440
Cash flow
-28.4%
Cash-on-Cash Return
-0.3%
Cap rate
0.4%
Rent to Value Ratio
Active
$672,000
3
bds
|
2
ba
|
1,230
sqft
|
built
1939
547 NW 49th St, Miami, FL 33127
$-2,174
Cash flow
-16.9%
Cash-on-Cash Return
2.4%
Cap rate
0.4%
Rent to Value Ratio
Active
$625,000
3
bds
|
2
ba
|
1,220
sqft
|
built
2020
11492 SW 190th Terrace Rd, Miami, FL 33157
$-1,343
Cash flow
-11.2%
Cash-on-Cash Return
3.7%
Cap rate
0.6%
Rent to Value Ratio
Active
$769,000
3
bds
|
2
ba
|
1,711
sqft
|
built
1947
921 NW 30th Ct, Miami, FL 33125
$-2,503
Cash flow
-17.0%
Cash-on-Cash Return
2.4%
Cap rate
0.4%
Rent to Value Ratio
Active
$479,000
3
bds
|
3
ba
|
1,590
sqft
|
built
1990
12201 SW 148th St, Miami, FL 33186
$-1,199
Cash flow
-13.1%
Cash-on-Cash Return
3.3%
Cap rate
0.6%
Rent to Value Ratio
Active
$650,000
4
bds
|
2
ba
|
1,400
sqft
|
built
1982
1938 NW 2nd Ct, Miami, FL 33136
$-683
Cash flow
-5.5%
Cash-on-Cash Return
4.9%
Cap rate
0.8%
Rent to Value Ratio
Active
$830,000
3
bds
|
2
ba
|
1,173
sqft
|
built
1948
2125 SW 26th St, Miami, FL 33133
$-2,012
Cash flow
-12.6%
Cash-on-Cash Return
3.2%
Cap rate
0.5%
Rent to Value Ratio
Active
$739,000
3
bds
|
2
ba
|
1,300
sqft
|
built
1976
11155 SW 112th Ter, Miami, FL 33176
$-1,707
Cash flow
-12.1%
Cash-on-Cash Return
3.5%
Cap rate
0.5%
Rent to Value Ratio

Active
$369,000
2
bds
|
2
ba
|
825
sqft
|
built
1985
550 SW 115th Ave, Miami, FL 33174
$-576
Cash flow
-8.1%
Cash-on-Cash Return
4.4%
Cap rate
0.7%
Rent to Value Ratio
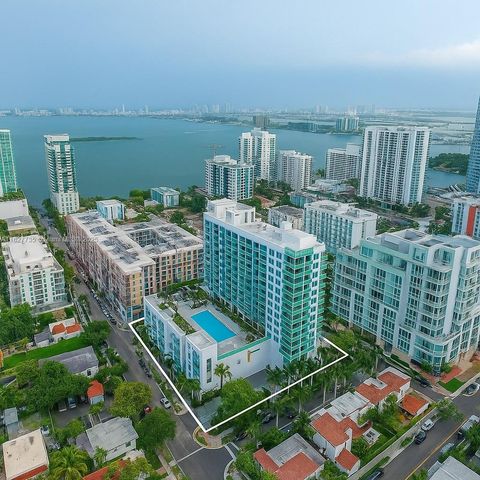
Active
$995,000
2
bds
|
2
ba
|
1,255
sqft
|
built
2009
495 Brickell Ave, Miami, FL 33131
$-3,075
Cash flow
-16.1%
Cash-on-Cash Return
2.6%
Cap rate
0.6%
Rent to Value Ratio
Active
$435,000
1
bds
|
2
ba
|
710
sqft
|
built
2014
31 SE 6th St, Miami, FL 33131
$-2,011
Cash flow
-24.1%
Cash-on-Cash Return
0.7%
Cap rate
0.7%
Rent to Value Ratio
Active
$750,000
3
bds
|
0
ba
|
1,871
sqft
|
built
1948
6290 SW 39th St, Miami, FL 33155
$-2,745
Cash flow
-19.1%
Cash-on-Cash Return
1.9%
Cap rate
0.4%
Rent to Value Ratio
Active
$440,000
3
bds
|
3
ba
|
1,394
sqft
|
built
2021
10237 SW 228th Ter, Miami, FL 33190
$-1,300
Cash flow
-15.4%
Cash-on-Cash Return
2.7%
Cap rate
0.6%
Rent to Value Ratio
Active
$320,000
1
bds
|
1
ba
|
651
sqft
|
built
2007
133 NE 2nd Ave, Miami, FL 33132
$-1,183
Cash flow
-19.3%
Cash-on-Cash Return
1.8%
Cap rate
0.7%
Rent to Value Ratio
Active
$325,000
2
bds
|
2
ba
|
1,193
sqft
|
built
1974
706 NW 87th Ave, Miami, FL 33172
$-756
Cash flow
-12.1%
Cash-on-Cash Return
3.5%
Cap rate
0.7%
Rent to Value Ratio

Active
$375,000
3
bds
|
2
ba
|
1,055
sqft
|
built
1987
8977 SW 123rd Ct, Miami, FL 33186
$-712
Cash flow
-9.9%
Cash-on-Cash Return
4.0%
Cap rate
0.7%
Rent to Value Ratio

Active
$370,000
3
bds
|
3
ba
|
1,580
sqft
|
built
1982
5900 SW 127th Ave, Miami, FL 33183
$-1,186
Cash flow
-16.7%
Cash-on-Cash Return
2.4%
Cap rate
0.8%
Rent to Value Ratio
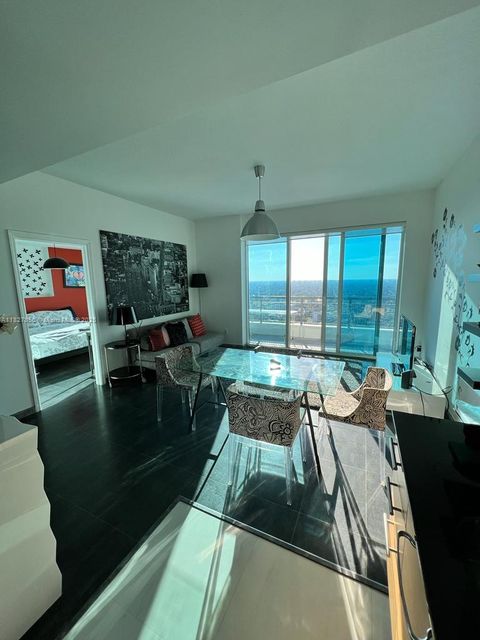
Active
$638,000
1
bds
|
2
ba
|
883
sqft
|
built
2016
88 SW 7th St, Miami, FL 33130
$-2,031
Cash flow
-16.6%
Cash-on-Cash Return
2.4%
Cap rate
0.7%
Rent to Value Ratio

Active
$960,000
2
bds
|
2
ba
|
1,147
sqft
|
built
2010
2020 N Bayshore Dr, Miami, FL 33137
$-2,195
Cash flow
-11.9%
Cash-on-Cash Return
3.5%
Cap rate
0.6%
Rent to Value Ratio

Active
$690,000
3
bds
|
2
ba
|
1,573
sqft
|
built
1990
1081 NW 128th Ave, Miami, FL 33182
$-1,461
Cash flow
-11.0%
Cash-on-Cash Return
3.7%
Cap rate
0.5%
Rent to Value Ratio
Active
$823,000
4
bds
|
0
ba
|
1,485
sqft
|
built
1958
2729 NW 47th St, Miami, FL 33142
$-3,230
Cash flow
-20.5%
Cash-on-Cash Return
1.6%
Cap rate
0.3%
Rent to Value Ratio
Active
$129,000
1
bds
|
1
ba
|
801
sqft
|
built
1968
1301 NE Miami Gardens Dr, Miami, FL 33179
$25
Cash flow
1.0%
Cash-on-Cash Return
6.5%
Cap rate
1.4%
Rent to Value Ratio
Active
$405,000
3
bds
|
3
ba
|
1,462
sqft
|
built
1985
14260 SW 94th Circle Ln, Miami, FL 33186
$-1,112
Cash flow
-14.3%
Cash-on-Cash Return
3.0%
Cap rate
0.7%
Rent to Value Ratio
Active
$400,000
3
bds
|
2
ba
|
1,360
sqft
|
built
1982
850 NW 106th Ave, Miami, FL 33172
$-986
Cash flow
-12.9%
Cash-on-Cash Return
3.3%
Cap rate
0.7%
Rent to Value Ratio
Active
$494,999
3
bds
|
2
ba
|
1,661
sqft
|
built
1989
11912 SW 192nd Ter, Miami, FL 33177
$-547
Cash flow
-5.8%
Cash-on-Cash Return
4.9%
Cap rate
0.6%
Rent to Value Ratio