Miami Gardens, FL Investment Properties for Sale
Browse homes for sale and investment properties in Miami Gardens, FL. Refine your search by price, property type, or more.
Best cash flowing properties in Miami Gardens, FL
Active
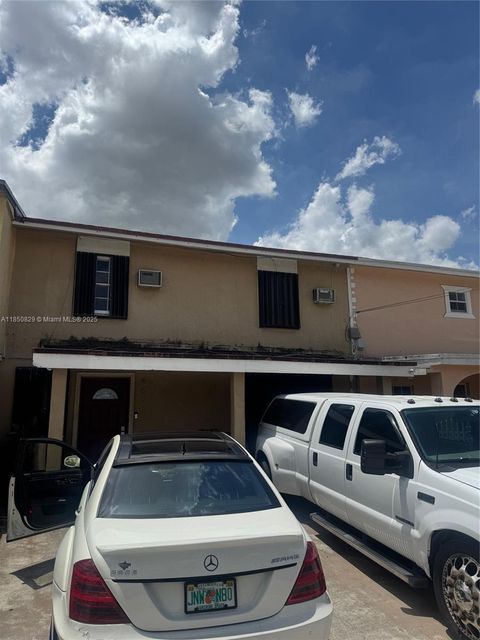
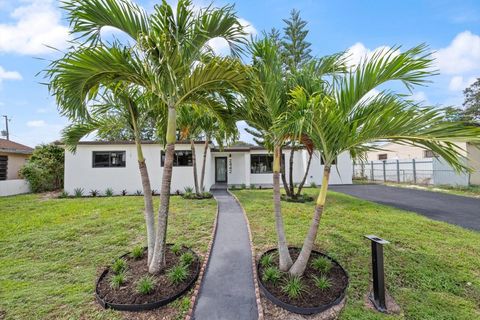
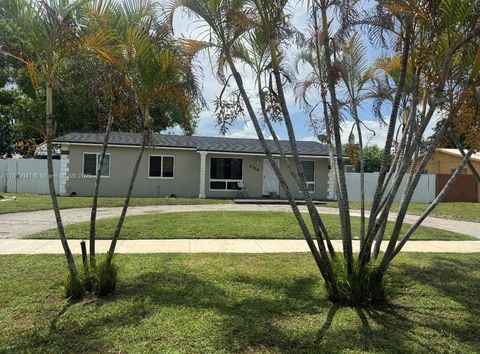
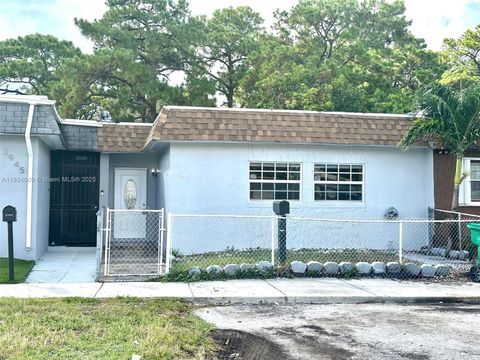
$325,000
3
bds
|
2
ba
|
1,058
sqft
|
built
1971
4600 NW 195th St, Miami Gardens, FL 33055
$55
Cash flow
0.9%
Cash-on-Cash Return
6.4%
Cap rate
0.9%
Rent to Value Ratio
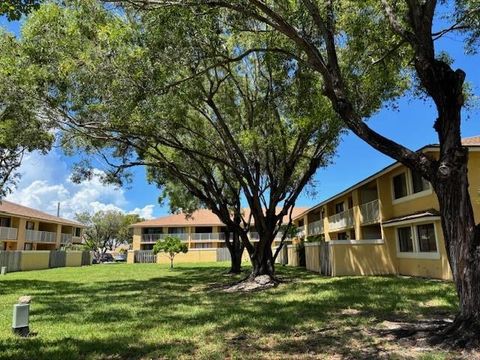
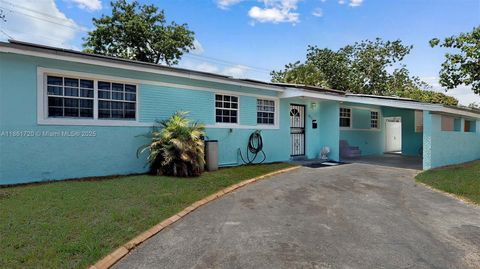
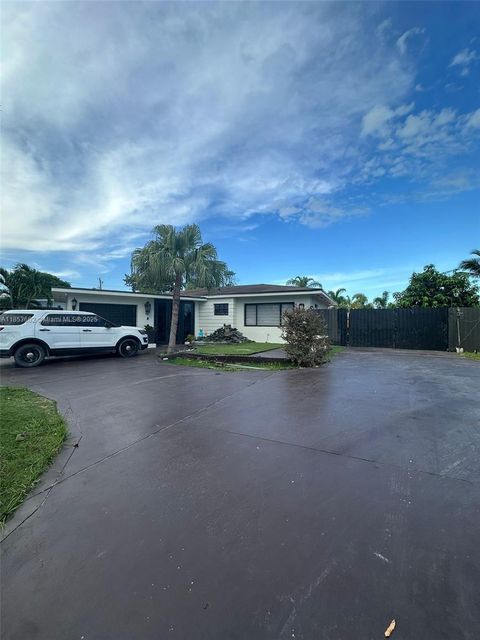
Active
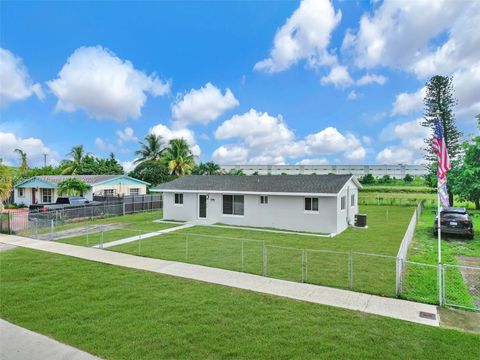
$259,999
3
bds
|
2
ba
|
1,348
sqft
|
built
1980
410 NW 214th St, Miami Gardens, FL 33169
$-214
Cash flow
-4.3%
Cash-on-Cash Return
5.2%
Cap rate
1.0%
Rent to Value Ratio
234 out of 250 properties for sale in Miami Gardens, FL
Limited Results Shown
Create a free account, or log in to reveal all property listings and enjoy the complete experience.
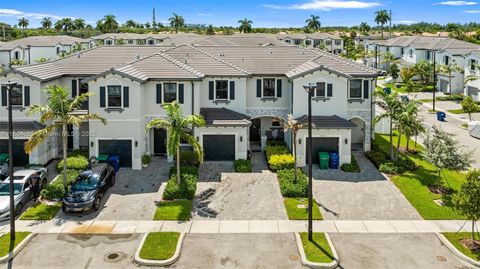
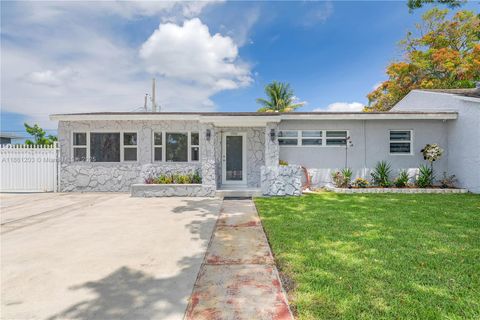
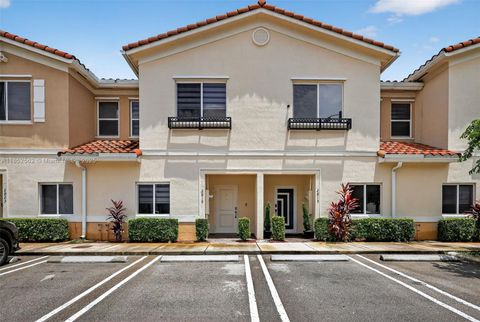
Active
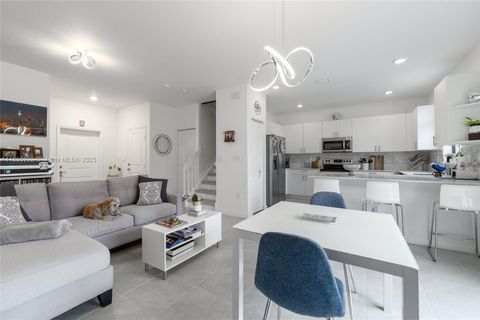
$499,990
3
bds
|
3
ba
|
1,344
sqft
|
built
2022
20380 NW 5th Ct, Miami Gardens, FL 33169
$-1,298
Cash flow
-13.5%
Cash-on-Cash Return
3.0%
Cap rate
0.6%
Rent to Value Ratio
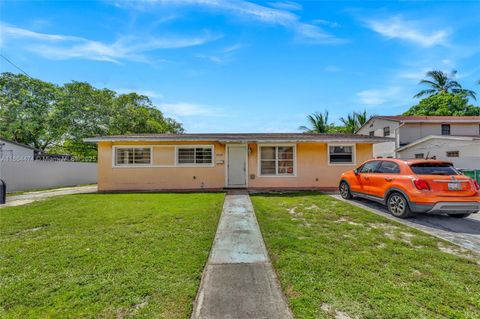
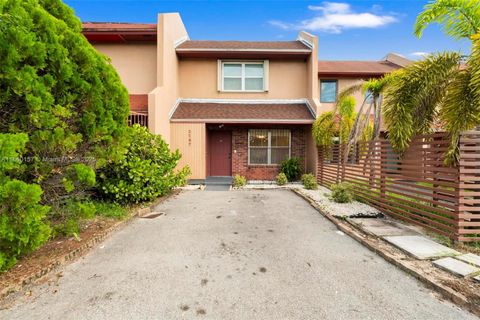
Active
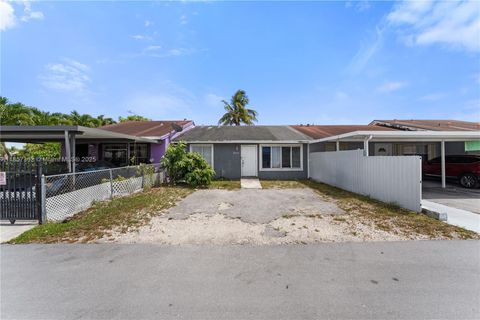
$550,000
3
bds
|
1
ba
|
1,274
sqft
|
built
1958
17210 NW 47th Ave, Miami Gardens, FL 33055
$-514
Cash flow
-4.9%
Cash-on-Cash Return
5.0%
Cap rate
0.6%
Rent to Value Ratio

Active
$500,000
3
bds
|
2
ba
|
1,341
sqft
|
built
1959
1301 NW 175th St, Miami Gardens, FL 33169
$-899
Cash flow
-9.4%
Cash-on-Cash Return
4.0%
Cap rate
0.6%
Rent to Value Ratio
Active
$639,900
5
bds
|
3
ba
|
1,911
sqft
|
built
1954
2442 NW 170th St, Miami Gardens, FL 33056
$-2,565
Cash flow
-20.9%
Cash-on-Cash Return
1.3%
Cap rate
0.4%
Rent to Value Ratio
Active
$599,999
3
bds
|
2
ba
|
1,690
sqft
|
built
1960
18502 NW 23rd Ct, Miami Gardens, FL 33056
$-1,359
Cash flow
-11.8%
Cash-on-Cash Return
3.4%
Cap rate
0.7%
Rent to Value Ratio

Active
$535,000
3
bds
|
1
ba
|
0
sqft
|
built
1970
3354 NW 181st St, Miami Gardens, FL 33056
$-1,260
Cash flow
-12.3%
Cash-on-Cash Return
3.3%
Cap rate
0.6%
Rent to Value Ratio

Active
$580,000
3
bds
|
2
ba
|
1,486
sqft
|
built
1958
3781 NW 192nd St, Miami Gardens, FL 33055
$-1,999
Cash flow
-18.0%
Cash-on-Cash Return
2.0%
Cap rate
0.4%
Rent to Value Ratio
Active
$590,000
3
bds
|
1
ba
|
1,672
sqft
|
built
1954
17201 NW 37th Ave, Miami Gardens, FL 33056
$-1,574
Cash flow
-13.9%
Cash-on-Cash Return
2.9%
Cap rate
0.5%
Rent to Value Ratio

Active
$399,999
3
bds
|
2
ba
|
1,200
sqft
|
built
1954
16230 NW 27th Ct, Miami Gardens, FL 33054
$-241
Cash flow
-3.1%
Cash-on-Cash Return
5.4%
Cap rate
0.7%
Rent to Value Ratio
Active
$380,000
3
bds
|
2
ba
|
1,292
sqft
|
built
1977
2787 NW 196th St, Miami Gardens, FL 33056
$-543
Cash flow
-7.5%
Cash-on-Cash Return
4.4%
Cap rate
0.8%
Rent to Value Ratio
Active
$580,000
4
bds
|
2
ba
|
1,584
sqft
|
built
1974
3738 NW 207th Dr, Miami Gardens, FL 33055
$-935
Cash flow
-8.4%
Cash-on-Cash Return
4.2%
Cap rate
0.6%
Rent to Value Ratio

Active
$650,000
4
bds
|
3
ba
|
2,174
sqft
|
built
1957
18001 NW 42nd Pl, Miami Gardens, FL 33055
$-733
Cash flow
-5.9%
Cash-on-Cash Return
4.8%
Cap rate
0.7%
Rent to Value Ratio

Active
$749,900
5
bds
|
2
ba
|
2,399
sqft
|
built
1958
4720 NW 179th St, Miami Gardens, FL 33055
$-1,806
Cash flow
-12.6%
Cash-on-Cash Return
3.3%
Cap rate
0.5%
Rent to Value Ratio

Active
$493,000
4
bds
|
2
ba
|
1,465
sqft
|
built
1959
3521 NW 208th Ter, Miami Gardens, FL 33056
$-1,175
Cash flow
-12.4%
Cash-on-Cash Return
3.3%
Cap rate
0.6%
Rent to Value Ratio
Active
$529,000
4
bds
|
2
ba
|
1,323
sqft
|
built
1953
365 NW 188th St, Miami Gardens, FL 33169
$-900
Cash flow
-8.9%
Cash-on-Cash Return
4.1%
Cap rate
0.5%
Rent to Value Ratio
Active
$599,000
4
bds
|
2
ba
|
1,012
sqft
|
built
1971
4521 NW 207th Dr, Miami Gardens, FL 33055
$-1,080
Cash flow
-9.4%
Cash-on-Cash Return
4.0%
Cap rate
0.5%
Rent to Value Ratio

Active
$139,000
bds
|
1
ba
|
450
sqft
|
built
1971
271 NW 177th St, Miami Gardens, FL 33169
$-242
Cash flow
-9.1%
Cash-on-Cash Return
4.1%
Cap rate
0.9%
Rent to Value Ratio

Active
$129,800
bds
|
1
ba
|
440
sqft
|
built
1971
251 NW 177th St, Miami Gardens, FL 33169
$-248
Cash flow
-10.0%
Cash-on-Cash Return
3.9%
Cap rate
0.9%
Rent to Value Ratio

Active
$515,000
4
bds
|
3
ba
|
1,773
sqft
|
built
2022
20381 NW 4th Ct, Miami Gardens, FL 33169
$-1,271
Cash flow
-12.9%
Cash-on-Cash Return
3.2%
Cap rate
0.8%
Rent to Value Ratio
Active
$565,000
3
bds
|
3
ba
|
1,344
sqft
|
built
2022
561 NW 204th St, Miami Gardens, FL 33169
$-1,489
Cash flow
-13.7%
Cash-on-Cash Return
3.0%
Cap rate
0.6%
Rent to Value Ratio
Active
$359,999
3
bds
|
2
ba
|
960
sqft
|
built
1983
18602 NW 46th Ave, Miami Gardens, FL 33055
$-425
Cash flow
-6.2%
Cash-on-Cash Return
4.7%
Cap rate
0.7%
Rent to Value Ratio

Active
$430,000
3
bds
|
1
ba
|
864
sqft
|
built
1955
17701 NW 32nd Ct, Miami Gardens, FL 33056
$-392
Cash flow
-4.8%
Cash-on-Cash Return
5.1%
Cap rate
0.7%
Rent to Value Ratio
Active
$510,000
4
bds
|
2
ba
|
1,216
sqft
|
built
1952
2900 NW 164th St, Miami Gardens, FL 33054
$-580
Cash flow
-5.9%
Cash-on-Cash Return
4.8%
Cap rate
0.6%
Rent to Value Ratio
Active
$420,000
3
bds
|
2
ba
|
1,491
sqft
|
built
1993
19754 NW 34th Ave, Miami Gardens, FL 33056
$-927
Cash flow
-11.5%
Cash-on-Cash Return
3.5%
Cap rate
0.7%
Rent to Value Ratio
Active
$590,000
3
bds
|
2
ba
|
1,164
sqft
|
built
1949
16110 NW 26th Ave, Miami Gardens, FL 33054
$-1,322
Cash flow
-11.7%
Cash-on-Cash Return
3.5%
Cap rate
0.6%
Rent to Value Ratio
Active
$654,900
5
bds
|
3
ba
|
1,963
sqft
|
built
1949
2840 NW 171st St, Miami Gardens, FL 33056
$-1,617
Cash flow
-12.9%
Cash-on-Cash Return
3.2%
Cap rate
0.4%
Rent to Value Ratio

Active
$510,000
4
bds
|
2
ba
|
1,479
sqft
|
built
1956
3351 NW 175th St, Miami Gardens, FL 33056
$-600
Cash flow
-6.1%
Cash-on-Cash Return
4.7%
Cap rate
0.6%
Rent to Value Ratio

Active
$374,999
3
bds
|
1
ba
|
1,057
sqft
|
built
1971
2135 NW 154th St, Miami Gardens, FL 33054
$-266
Cash flow
-3.7%
Cash-on-Cash Return
5.3%
Cap rate
0.8%
Rent to Value Ratio
Active
$550,000
3
bds
|
2
ba
|
1,663
sqft
|
built
1958
19211 NW 37th Ct, Miami Gardens, FL 33055
$-710
Cash flow
-6.7%
Cash-on-Cash Return
4.6%
Cap rate
0.6%
Rent to Value Ratio
Active
$395,000
3
bds
|
2
ba
|
1,152
sqft
|
built
1972
3947 NW 207th Street Rd, Miami Gardens, FL 33055
$-578
Cash flow
-7.6%
Cash-on-Cash Return
4.4%
Cap rate
0.7%
Rent to Value Ratio
Active
$650,000
5
bds
|
5
ba
|
1,543
sqft
|
built
1953
19361 NW 1st Ct, Miami Gardens, FL 33169
$-1,350
Cash flow
-10.8%
Cash-on-Cash Return
3.7%
Cap rate
0.6%
Rent to Value Ratio
Active
$429,000
3
bds
|
3
ba
|
1,442
sqft
|
built
2020
2819 NW 181st St, Miami Gardens, FL 33056
$-829
Cash flow
-10.1%
Cash-on-Cash Return
3.8%
Cap rate
0.7%
Rent to Value Ratio
Active
$158,000
1
bds
|
1
ba
|
730
sqft
|
built
1970
505 NW 177th St, Miami Gardens, FL 33169
$-492
Cash flow
-16.2%
Cash-on-Cash Return
2.4%
Cap rate
1.0%
Rent to Value Ratio

Active
$599,000
3
bds
|
2
ba
|
1,714
sqft
|
built
1961
100 NW 208th St, Miami Gardens, FL 33169
$-1,528
Cash flow
-13.3%
Cash-on-Cash Return
3.1%
Cap rate
0.5%
Rent to Value Ratio

Active
$649,900
4
bds
|
2
ba
|
1,430
sqft
|
built
1960
2831 NW 189th St, Miami Gardens, FL 33056
$-1,343
Cash flow
-10.8%
Cash-on-Cash Return
3.7%
Cap rate
0.6%
Rent to Value Ratio

Active
$495,000
3
bds
|
2
ba
|
1,370
sqft
|
built
1957
17131 NW Miami Ct, Miami Gardens, FL 33169
$-783
Cash flow
-8.3%
Cash-on-Cash Return
4.2%
Cap rate
0.6%
Rent to Value Ratio

Active
$500,000
4
bds
|
2
ba
|
1,314
sqft
|
built
1962
20410 NW 26th Ct, Miami Gardens, FL 33056
$-456
Cash flow
-4.8%
Cash-on-Cash Return
5.1%
Cap rate
0.6%
Rent to Value Ratio

Active
$422,000
2
bds
|
2
ba
|
837
sqft
|
built
1965
1467 NW 154th St, Miami Gardens, FL 33054
$-796
Cash flow
-9.8%
Cash-on-Cash Return
3.9%
Cap rate
0.6%
Rent to Value Ratio