Miami Shores, FL Investment Properties for Sale
Browse homes for sale and investment properties in Miami Shores, FL. Refine your search by price, property type, or more.
Best cash flowing properties in Miami Shores, FL

Active
$439,000
2
bds
|
2
ba
|
1,456
sqft
|
built
1982
4000 Towerside Ter, Miami Shores, FL 33138
$111
Cash flow
1.3%
Cash-on-Cash Return
6.5%
Cap rate
0.9%
Rent to Value Ratio
Active
$850,000
3
bds
|
2
ba
|
1,422
sqft
|
built
1965
10 NW 100th St, Miami Shores, FL 33150
$-105
Cash flow
-0.6%
Cash-on-Cash Return
6.0%
Cap rate
0.7%
Rent to Value Ratio
61 out of 63 properties for sale in Miami Shores, FL
Limited Results Shown
Create a free account, or log in to reveal all property listings and enjoy the complete experience.

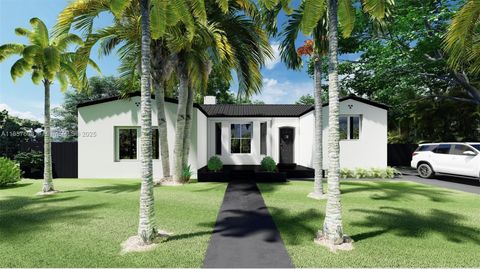
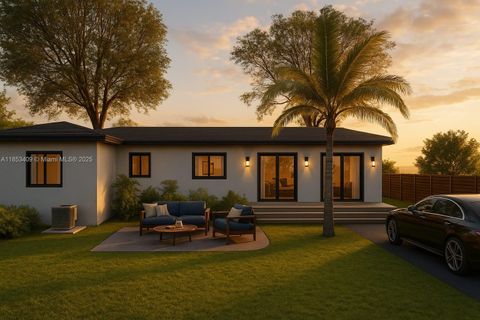
Active
$1,900,000
4
bds
|
4
ba
|
1,713
sqft
|
built
2000
9655 Biscayne Blvd, Miami Shores, FL 33138
$-7,919
Cash flow
-21.7%
Cash-on-Cash Return
1.1%
Cap rate
0.3%
Rent to Value Ratio

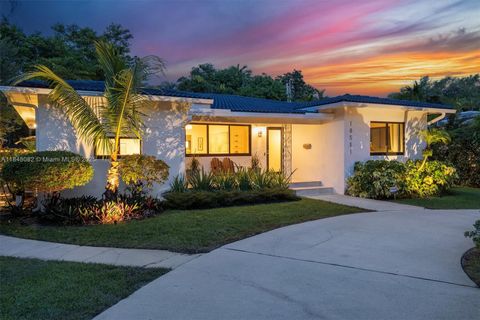
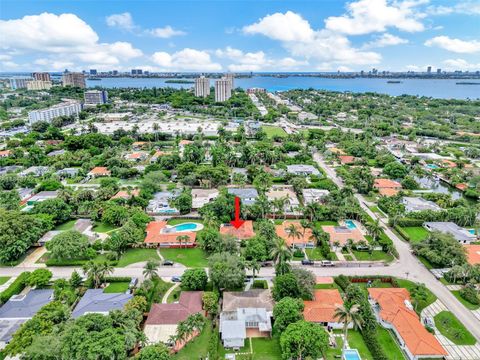
Active
$995,000
4
bds
|
3
ba
|
1,828
sqft
|
built
1954
25 NW 95th St, Miami Shores, FL 33150
$-1,645
Cash flow
-8.6%
Cash-on-Cash Return
4.2%
Cap rate
0.7%
Rent to Value Ratio
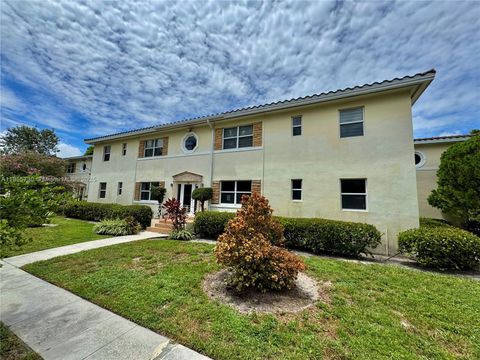
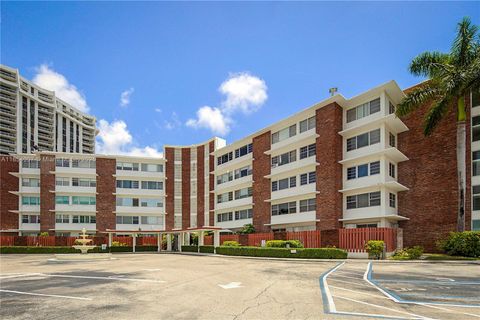
Active
$480,000
2
bds
|
2
ba
|
1,520
sqft
|
built
1981
1000 Quayside Ter, Miami Shores, FL 33138
$-1,973
Cash flow
-21.4%
Cash-on-Cash Return
1.2%
Cap rate
0.8%
Rent to Value Ratio
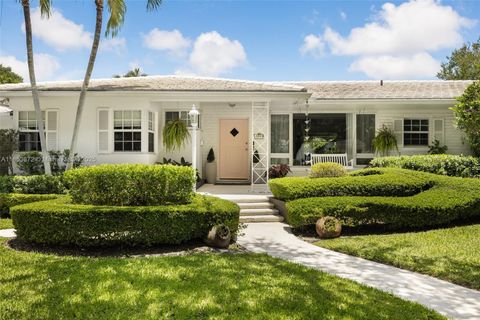
Active
$379,000
1
bds
|
2
ba
|
1,200
sqft
|
built
1981
1000 Quayside Ter, Miami Shores, FL 33138
$-1,821
Cash flow
-25.1%
Cash-on-Cash Return
0.4%
Cap rate
0.7%
Rent to Value Ratio
Active
$2,350,000
3
bds
|
3
ba
|
2,509
sqft
|
built
1955
1361 NE 104th St, Miami Shores, FL 33138
$-6,469
Cash flow
-14.4%
Cash-on-Cash Return
2.8%
Cap rate
0.4%
Rent to Value Ratio
Active
$3,249,000
4
bds
|
3
ba
|
2,934
sqft
|
built
1979
1090 NE 92nd St, Miami Shores, FL 33138
$-13,506
Cash flow
-21.7%
Cash-on-Cash Return
1.2%
Cap rate
0.3%
Rent to Value Ratio
Active
$1,750,000
4
bds
|
3
ba
|
2,521
sqft
|
built
1938
117 NE 95th St, Miami Shores, FL 33138
$-6,536
Cash flow
-19.5%
Cash-on-Cash Return
1.7%
Cap rate
0.4%
Rent to Value Ratio
Active
$1,250,000
3
bds
|
3
ba
|
1,816
sqft
|
built
1950
10551 NE 3rd Ave, Miami Shores, FL 33138
$-3,721
Cash flow
-15.5%
Cash-on-Cash Return
2.6%
Cap rate
0.4%
Rent to Value Ratio
Active
$337,000
2
bds
|
1
ba
|
894
sqft
|
built
1949
726 NE 92nd St, Miami Shores, FL 33138
$-540
Cash flow
-8.4%
Cash-on-Cash Return
4.2%
Cap rate
0.7%
Rent to Value Ratio
Active
$2,195,000
4
bds
|
3
ba
|
2,589
sqft
|
built
1951
575 NE 97th St, Miami Shores, FL 33138
$-6,418
Cash flow
-15.3%
Cash-on-Cash Return
2.6%
Cap rate
0.4%
Rent to Value Ratio
Active
$299,000
2
bds
|
2
ba
|
1,200
sqft
|
built
1965
1700 NE 105th St, Miami Shores, FL 33138
$-755
Cash flow
-13.2%
Cash-on-Cash Return
3.1%
Cap rate
1.1%
Rent to Value Ratio
Active
$1,250,000
3
bds
|
3
ba
|
1,581
sqft
|
built
1950
173 NW 107th St, Miami Shores, FL 33168
$-5,503
Cash flow
-23.0%
Cash-on-Cash Return
0.9%
Cap rate
0.2%
Rent to Value Ratio

Active
$1,111,000
3
bds
|
2
ba
|
0
sqft
|
built
1945
10828 NW 2nd Ave, Miami Shores, FL 33168
$-3,387
Cash flow
-15.9%
Cash-on-Cash Return
2.5%
Cap rate
0.4%
Rent to Value Ratio
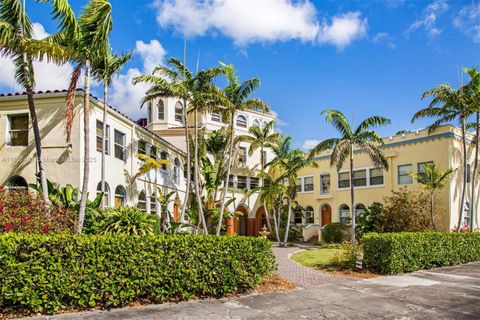
Active
$217,000
bds
|
1
ba
|
449
sqft
|
built
1925
421 Grand Concourse, Miami Shores, FL 33138
$-758
Cash flow
-18.2%
Cash-on-Cash Return
2.0%
Cap rate
0.8%
Rent to Value Ratio
Active
$1,250,000
4
bds
|
3
ba
|
2,463
sqft
|
built
1953
10619 NE 10th Pl, Miami Shores, FL 33138
$-2,592
Cash flow
-10.8%
Cash-on-Cash Return
3.7%
Cap rate
0.6%
Rent to Value Ratio
Active
$1,255,000
3
bds
|
2
ba
|
0
sqft
|
built
1938
318 NE 105th St, Miami Shores, FL 33138
$-3,508
Cash flow
-14.6%
Cash-on-Cash Return
2.8%
Cap rate
0.4%
Rent to Value Ratio
Active
$1,499,000
3
bds
|
2
ba
|
2,337
sqft
|
built
1948
541 NE 105th St, Miami Shores, FL 33138
$-3,320
Cash flow
-11.6%
Cash-on-Cash Return
3.5%
Cap rate
0.6%
Rent to Value Ratio
Active
$1,795,000
3
bds
|
2
ba
|
1,884
sqft
|
built
1950
480 NE 103rd St, Miami Shores, FL 33138
$-6,624
Cash flow
-19.3%
Cash-on-Cash Return
1.7%
Cap rate
0.3%
Rent to Value Ratio
Active
$1,700,000
4
bds
|
4
ba
|
3,008
sqft
|
built
2025
10618 NE 11th Ave, Miami Shores, FL 33138
$-3,072
Cash flow
-9.4%
Cash-on-Cash Return
4.0%
Cap rate
0.6%
Rent to Value Ratio

Active
$1,497,000
2
bds
|
3
ba
|
2,809
sqft
|
built
1971
1634 NE 105th St, Miami Shores, FL 33138
$-7,931
Cash flow
-27.6%
Cash-on-Cash Return
-0.2%
Cap rate
0.3%
Rent to Value Ratio

Active
$328,000
2
bds
|
2
ba
|
1,154
sqft
|
built
1965
1700 NE 105th St, Miami Shores, FL 33138
$-787
Cash flow
-12.5%
Cash-on-Cash Return
3.3%
Cap rate
0.9%
Rent to Value Ratio

Active
$2,100,000
4
bds
|
3
ba
|
2,043
sqft
|
built
2024
501 NE 105th St, Miami Shores, FL 33138
$-8,796
Cash flow
-21.9%
Cash-on-Cash Return
1.1%
Cap rate
0.2%
Rent to Value Ratio

Active
$1,150,000
3
bds
|
2
ba
|
1,824
sqft
|
built
1967
240 NE 97th St, Miami Shores, FL 33138
$-1,476
Cash flow
-6.7%
Cash-on-Cash Return
4.6%
Cap rate
0.7%
Rent to Value Ratio

Active
$4,790,000
5
bds
|
5
ba
|
4,156
sqft
|
built
2013
1009 NE 104th St, Miami Shores, FL 33138
$-23,163
Cash flow
-25.2%
Cash-on-Cash Return
0.3%
Cap rate
0.2%
Rent to Value Ratio

Active
$1,480,000
3
bds
|
2
ba
|
1,758
sqft
|
built
1960
220 NE 105th St, Miami Shores, FL 33138
$-5,093
Cash flow
-18.0%
Cash-on-Cash Return
2.0%
Cap rate
0.3%
Rent to Value Ratio

Active
$1,999,000
5
bds
|
3
ba
|
2,892
sqft
|
built
1948
170 NW 105th St, Miami Shores, FL 33150
$-7,080
Cash flow
-18.5%
Cash-on-Cash Return
1.9%
Cap rate
0.3%
Rent to Value Ratio

Active
$4,280,000
5
bds
|
5
ba
|
3,312
sqft
|
built
1953
1250 NE 87th St, Miami Shores, FL 33138
$-19,619
Cash flow
-23.9%
Cash-on-Cash Return
0.6%
Cap rate
0.2%
Rent to Value Ratio

Active
$1,050,000
2
bds
|
1
ba
|
1,160
sqft
|
built
1948
758 NE 95th St, Miami Shores, FL 33138
$-4,882
Cash flow
-24.3%
Cash-on-Cash Return
0.6%
Cap rate
0.4%
Rent to Value Ratio

Active
$1,800,000
3
bds
|
2
ba
|
2,123
sqft
|
built
1950
1020 NE 98th St, Miami Shores, FL 33138
$-4,164
Cash flow
-12.1%
Cash-on-Cash Return
3.4%
Cap rate
0.5%
Rent to Value Ratio
Active
$1,100,000
2
bds
|
1
ba
|
1,073
sqft
|
built
1925
136 NE 101st St, Miami Shores, FL 33138
$-4,292
Cash flow
-20.4%
Cash-on-Cash Return
1.5%
Cap rate
0.3%
Rent to Value Ratio

Active
$1,800,000
3
bds
|
2
ba
|
0
sqft
|
built
1955
1210 NE 97th St, Miami Shores, FL 33138
$-8,157
Cash flow
-23.6%
Cash-on-Cash Return
0.7%
Cap rate
0.3%
Rent to Value Ratio

Active
$2,495,000
5
bds
|
4
ba
|
3,739
sqft
|
built
1947
210 NE 107th St, Miami Shores, FL 33161
$-12,471
Cash flow
-26.1%
Cash-on-Cash Return
0.1%
Cap rate
0.1%
Rent to Value Ratio
Active
$1,197,700
3
bds
|
3
ba
|
1,562
sqft
|
built
1941
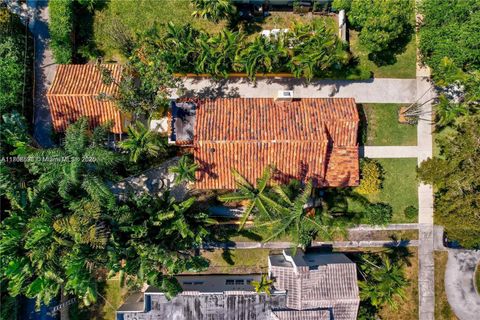
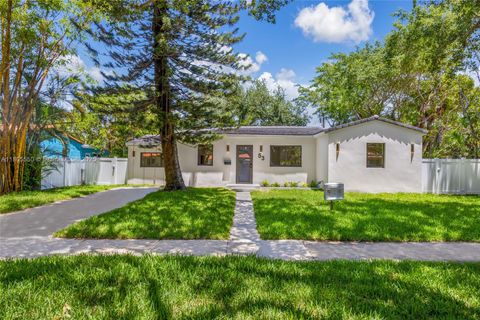
53 NW 107th St, Miami Shores, FL 33168
$-5,121
Cash flow
-22.3%
Cash-on-Cash Return
1.0%
Cap rate
0.3%
Rent to Value Ratio

Active
$1,049,100
2
bds
|
3
ba
|
1,628
sqft
|
built
1951
138 NE 109th St, Miami Shores, FL 33161
$-3,772
Cash flow
-18.8%
Cash-on-Cash Return
1.8%
Cap rate
0.4%
Rent to Value Ratio

Active
$4,499,000
5
bds
|
6
ba
|
5,812
sqft
|
built
1940
1234 NE 96th St, Miami Shores, FL 33138
$-19,506
Cash flow
-22.6%
Cash-on-Cash Return
0.9%
Cap rate
0.1%
Rent to Value Ratio
Active
$1,690,000
2
bds
|
2
ba
|
2,476
sqft
|
built
1939
550 NE 94th St, Miami Shores, FL 33138
$-5,543
Cash flow
-17.1%
Cash-on-Cash Return
2.2%
Cap rate
0.4%
Rent to Value Ratio

Active
$750,000
3
bds
|
3
ba
|
1,924
sqft
|
built
1965
1700 NE 105th St, Miami Shores, FL 33138
$-2,738
Cash flow
-19.0%
Cash-on-Cash Return
1.8%
Cap rate
0.7%
Rent to Value Ratio

Active
$975,000
2
bds
|
2
ba
|
1,473
sqft
|
built
1950
825 NE 98th St, Miami Shores, FL 33138
$-2,618
Cash flow
-14.0%
Cash-on-Cash Return
2.9%
Cap rate
0.5%
Rent to Value Ratio