Milwaukee, WI Investment Properties for Sale
Browse homes for sale and investment properties in Milwaukee, WI. Refine your search by price, property type, or more.
Best cash flowing properties in Milwaukee, WI
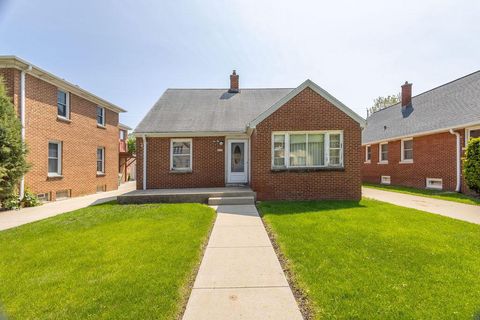
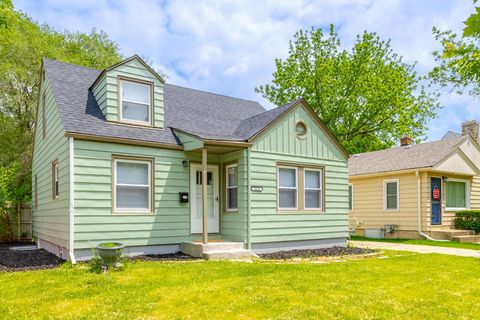
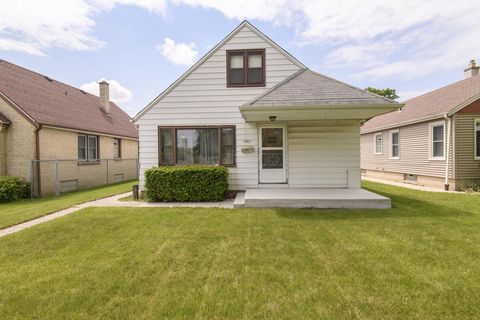
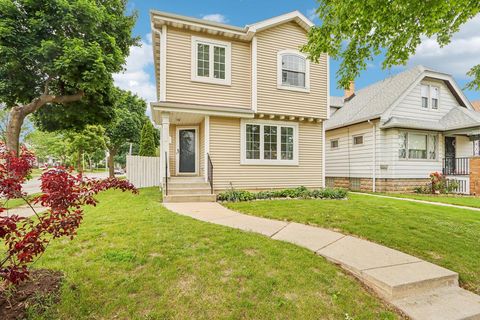
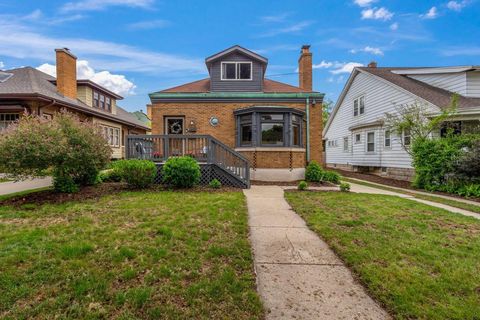
Pending
$105,000
3
bds
|
0
ba
|
1,926
sqft
|
built
1926
4717 N 19th St, Milwaukee, WI 53209
$306
Cash flow
15.2%
Cash-on-Cash Return
9.8%
Cap rate
1.4%
Rent to Value Ratio
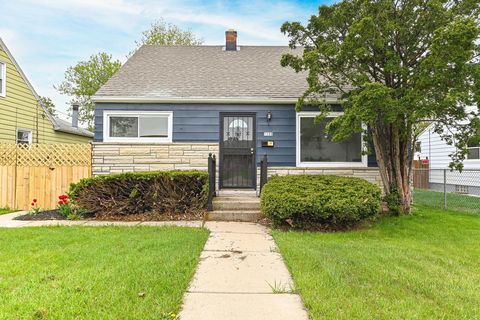
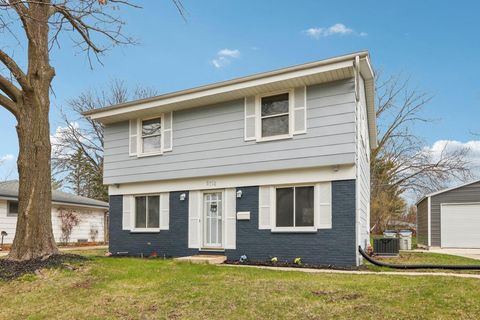
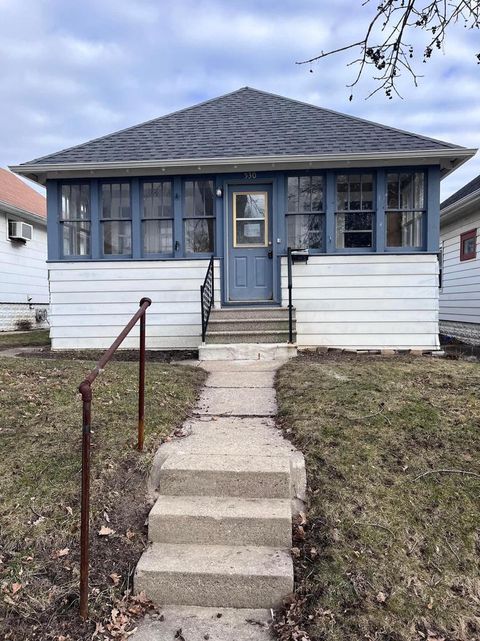
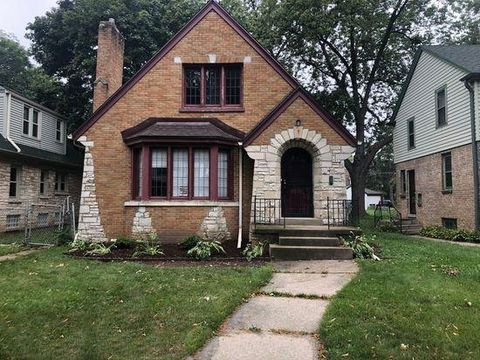
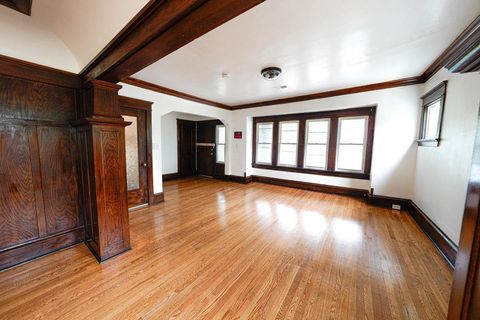
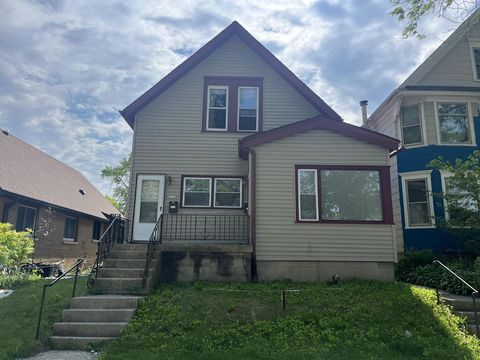
Active
$89,900
5
bds
|
0
ba
|
1,740
sqft
|
built
1922
3715 N 16th St, Milwaukee, WI 53206
$301
Cash flow
17.5%
Cash-on-Cash Return
10.3%
Cap rate
1.4%
Rent to Value Ratio
959 out of 1,102 properties for sale in Milwaukee, WI
Limited Results Shown
Create a free account, or log in to reveal all property listings and enjoy the complete experience.
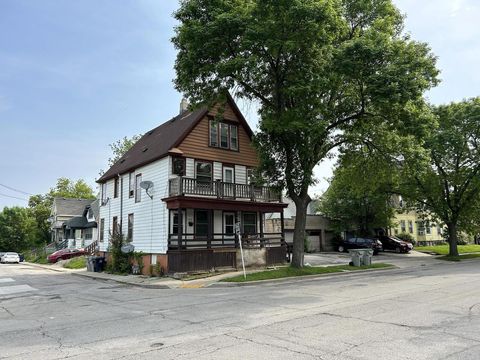
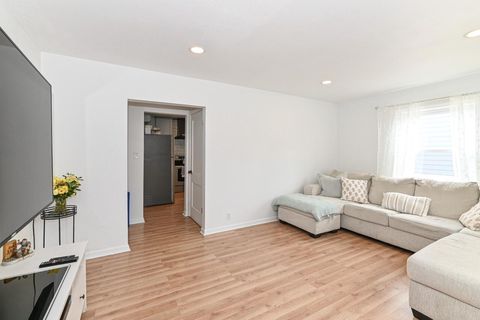
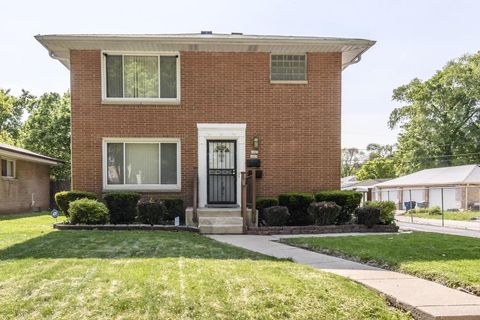
Active
$219,900
3
bds
|
0
ba
|
1,531
sqft
|
built
1951
3150 S 39th St, Milwaukee, WI 53215
$-309
Cash flow
-7.3%
Cash-on-Cash Return
4.6%
Cap rate
0.8%
Rent to Value Ratio
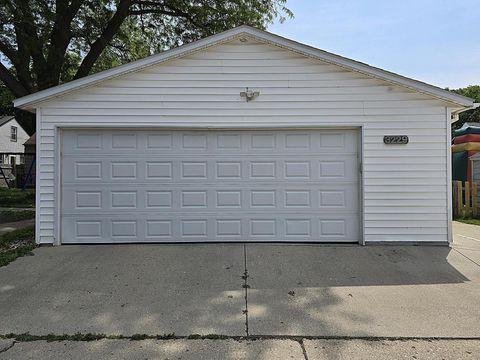
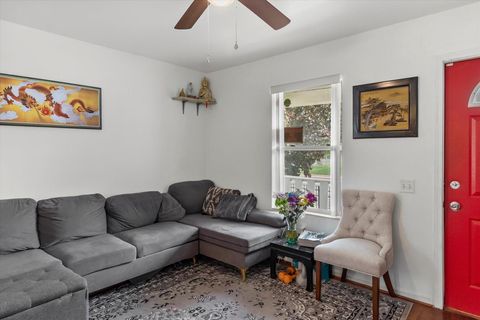
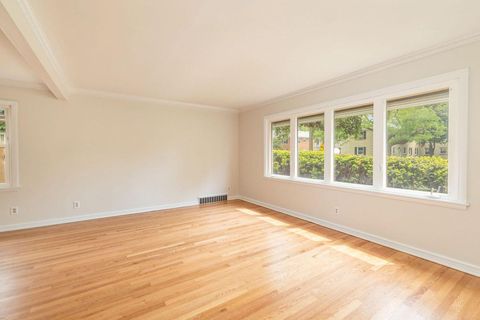
Active
$249,900
4
bds
|
0
ba
|
1,585
sqft
|
built
1955
4155 N 67th St, Milwaukee, WI 53216
$-657
Cash flow
-13.7%
Cash-on-Cash Return
3.1%
Cap rate
0.5%
Rent to Value Ratio
Active
$230,000
2
bds
|
0
ba
|
768
sqft
|
built
1949
177 N 91st St, Milwaukee, WI 53226
$-551
Cash flow
-12.5%
Cash-on-Cash Return
3.4%
Cap rate
0.6%
Rent to Value Ratio
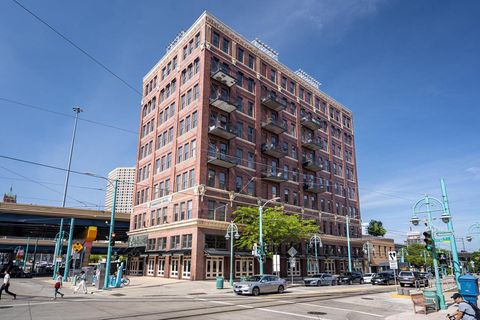
Active
$247,500
2
bds
|
0
ba
|
980
sqft
|
built
1901
270 E Highland Ave, Milwaukee, WI 53202
$-431
Cash flow
-9.1%
Cash-on-Cash Return
4.2%
Cap rate
0.8%
Rent to Value Ratio
Active
$179,000
4
bds
|
0
ba
|
1,369
sqft
|
built
1937
4960 N 58th St, Milwaukee, WI 53218
$-286
Cash flow
-8.3%
Cash-on-Cash Return
4.4%
Cap rate
0.7%
Rent to Value Ratio
Active
$179,000
2
bds
|
0
ba
|
1,363
sqft
|
built
1955
5756 N 79th St, Milwaukee, WI 53218
$-429
Cash flow
-12.5%
Cash-on-Cash Return
3.4%
Cap rate
0.6%
Rent to Value Ratio
Active
$89,900
5
bds
|
0
ba
|
1,740
sqft
|
built
1922
3715 N 16th St, Milwaukee, WI 53206
$301
Cash flow
17.5%
Cash-on-Cash Return
10.3%
Cap rate
1.4%
Rent to Value Ratio

Active
$249,900
2
bds
|
0
ba
|
1,092
sqft
|
built
1980
1818 E Shorewood Blvd, Milwaukee, WI 53211
$-664
Cash flow
-13.9%
Cash-on-Cash Return
3.1%
Cap rate
0.6%
Rent to Value Ratio
Pending
$209,900
4
bds
|
0
ba
|
1,522
sqft
|
built
1952
5030 N 56th St, Milwaukee, WI 53218
$-380
Cash flow
-9.4%
Cash-on-Cash Return
4.1%
Cap rate
0.7%
Rent to Value Ratio

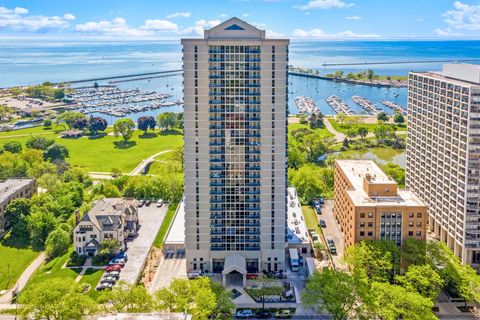
Active
$139,900
1
bds
|
0
ba
|
643
sqft
|
built
1969
2025 E Greenwich Ave, Milwaukee, WI 53211
$-189
Cash flow
-7.0%
Cash-on-Cash Return
4.6%
Cap rate
0.8%
Rent to Value Ratio
Active
$345,000
4
bds
|
0
ba
|
2,150
sqft
|
built
1966
8710 W Dallas St, Milwaukee, WI 53224
$-434
Cash flow
-6.6%
Cash-on-Cash Return
4.8%
Cap rate
0.7%
Rent to Value Ratio
Active
$93,000
bds
|
0
ba
|
2,833
sqft
|
built
1905
1218 W Locust St, Milwaukee, WI 53206
$-139
Cash flow
-7.8%
Cash-on-Cash Return
4.5%
Cap rate
0.8%
Rent to Value Ratio

Active
$474,900
5
bds
|
0
ba
|
2,512
sqft
|
built
1915
2037 N 51st St, Milwaukee, WI 53208
$-1,644
Cash flow
-18.1%
Cash-on-Cash Return
2.1%
Cap rate
0.4%
Rent to Value Ratio
Active
$219,900
2
bds
|
0
ba
|
1,199
sqft
|
built
1950
3229 N 78th St, Milwaukee, WI 53222
$-459
Cash flow
-10.9%
Cash-on-Cash Return
3.8%
Cap rate
0.6%
Rent to Value Ratio
Active
$225,000
3
bds
|
0
ba
|
1,225
sqft
|
built
1952
3861 S 13th St, Milwaukee, WI 53221
$-280
Cash flow
-6.5%
Cash-on-Cash Return
4.8%
Cap rate
0.8%
Rent to Value Ratio
Active
$224,000
3
bds
|
0
ba
|
1,100
sqft
|
built
1925
530 S 66th St, Milwaukee, WI 53214
$-776
Cash flow
-18.1%
Cash-on-Cash Return
2.1%
Cap rate
0.4%
Rent to Value Ratio
Active
$235,000
3
bds
|
0
ba
|
1,169
sqft
|
built
1948
3448 S 84th St, Milwaukee, WI 53227
$-656
Cash flow
-14.6%
Cash-on-Cash Return
2.9%
Cap rate
0.6%
Rent to Value Ratio
Active
$174,900
3
bds
|
0
ba
|
1,344
sqft
|
built
2003
2816 W Vliet St, Milwaukee, WI 53208
$-86
Cash flow
-2.6%
Cash-on-Cash Return
5.7%
Cap rate
0.8%
Rent to Value Ratio

Active
$429,900
3
bds
|
0
ba
|
1,694
sqft
|
built
1921
3018 N Downer Ave, Milwaukee, WI 53211
$-1,212
Cash flow
-14.7%
Cash-on-Cash Return
2.9%
Cap rate
0.6%
Rent to Value Ratio
Active
$300,000
1
bds
|
0
ba
|
1,298
sqft
|
built
2006
601 E Ogden Ave, Milwaukee, WI 53202
$-1,026
Cash flow
-17.8%
Cash-on-Cash Return
2.2%
Cap rate
0.5%
Rent to Value Ratio
Active
$274,900
3
bds
|
0
ba
|
1,885
sqft
|
built
2000
3477 S 14th St, Milwaukee, WI 53215
$-522
Cash flow
-9.9%
Cash-on-Cash Return
4.0%
Cap rate
0.7%
Rent to Value Ratio
Closed
$120,000
2
bds
|
0
ba
|
1,166
sqft
|
built
1937
3853 N 42nd St, Milwaukee, WI 53216
$66
Cash flow
2.9%
Cash-on-Cash Return
6.9%
Cap rate
1.0%
Rent to Value Ratio
Active
$239,900
6
bds
|
0
ba
|
2,423
sqft
|
built
1970
8609 N 106th St, Milwaukee, WI 53224
$-693
Cash flow
-15.1%
Cash-on-Cash Return
2.8%
Cap rate
0.6%
Rent to Value Ratio
Active
$399,900
3
bds
|
0
ba
|
1,905
sqft
|
built
1924
1544 N 58th St, Milwaukee, WI 53208
$-843
Cash flow
-11.0%
Cash-on-Cash Return
3.7%
Cap rate
0.7%
Rent to Value Ratio
Active
$184,900
6
bds
|
0
ba
|
2,936
sqft
|
built
1922
2901 N 37th St, Milwaukee, WI 53210
$-169
Cash flow
-4.8%
Cash-on-Cash Return
5.2%
Cap rate
0.8%
Rent to Value Ratio
Active
$250,000
4
bds
|
0
ba
|
2,184
sqft
|
built
1956
6465 N 54th St, Milwaukee, WI 53223
$-755
Cash flow
-15.8%
Cash-on-Cash Return
2.6%
Cap rate
0.5%
Rent to Value Ratio
Active
$339,900
3
bds
|
0
ba
|
1,970
sqft
|
built
1953
3457 N Dousman St, Milwaukee, WI 53212
$-1,666
Cash flow
-25.6%
Cash-on-Cash Return
0.4%
Cap rate
0.3%
Rent to Value Ratio

Active
$520,000
8
bds
|
0
ba
|
3,336
sqft
|
built
1915
3354 N Oakland Ave, Milwaukee, WI 53211
$-2,451
Cash flow
-24.6%
Cash-on-Cash Return
0.6%
Cap rate
0.2%
Rent to Value Ratio
Active
$319,900
3
bds
|
0
ba
|
1,691
sqft
|
built
1958
8305 W Ohio Ave, Milwaukee, WI 53219
$-807
Cash flow
-13.2%
Cash-on-Cash Return
3.2%
Cap rate
0.6%
Rent to Value Ratio
Active
$150,000
4
bds
|
0
ba
|
1,368
sqft
|
built
1912
2667 N 36th St, Milwaukee, WI 53210
$-93
Cash flow
-3.2%
Cash-on-Cash Return
5.5%
Cap rate
0.8%
Rent to Value Ratio
Active
$160,000
3
bds
|
0
ba
|
1,296
sqft
|
built
1926
4110 N 7th St, Milwaukee, WI 53209
$-54
Cash flow
-1.8%
Cash-on-Cash Return
5.9%
Cap rate
0.9%
Rent to Value Ratio
Active
$259,000
3
bds
|
0
ba
|
1,612
sqft
|
built
1950
9131 W Townsend St, Milwaukee, WI 53222
$-749
Cash flow
-15.1%
Cash-on-Cash Return
2.8%
Cap rate
0.5%
Rent to Value Ratio
Active
$350,000
2
bds
|
0
ba
|
954
sqft
|
built
1990
1660 N Prospect Ave, Milwaukee, WI 53202
$-1,137
Cash flow
-16.9%
Cash-on-Cash Return
2.4%
Cap rate
0.6%
Rent to Value Ratio
Pending
$105,000
3
bds
|
0
ba
|
1,926
sqft
|
built
1926
4717 N 19th St, Milwaukee, WI 53209
$306
Cash flow
15.2%
Cash-on-Cash Return
9.8%
Cap rate
1.4%
Rent to Value Ratio
Active
$419,000
1
bds
|
0
ba
|
1,304
sqft
|
built
1911
400 N Broadway, Milwaukee, WI 53202
$-1,200
Cash flow
-14.9%
Cash-on-Cash Return
2.8%
Cap rate
0.6%
Rent to Value Ratio
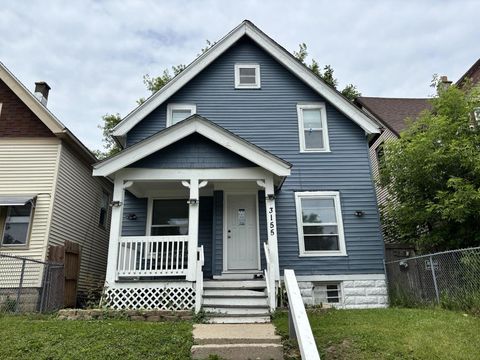
Active
$125,000
3
bds
|
0
ba
|
1,302
sqft
|
built
1908
3155 N 14th St, Milwaukee, WI 53206
$130
Cash flow
5.4%
Cash-on-Cash Return
7.5%
Cap rate
1.0%
Rent to Value Ratio

Active
$759,900
4
bds
|
0
ba
|
2,833
sqft
|
built
1900
2710 N Hackett Ave, Milwaukee, WI 53211
$-2,911
Cash flow
-20.0%
Cash-on-Cash Return
1.7%
Cap rate
0.4%
Rent to Value Ratio
Active
$334,900
5
bds
|
0
ba
|
2,006
sqft
|
built
1910
2928 N Humboldt Blvd, Milwaukee, WI 53212
$-1,302
Cash flow
-20.3%
Cash-on-Cash Return
1.6%
Cap rate
0.4%
Rent to Value Ratio
Pending
$249,900
2
bds
|
0
ba
|
1,178
sqft
|
built
1900
2132 S Woodward St, Milwaukee, WI 53207
$-492
Cash flow
-10.3%
Cash-on-Cash Return
3.9%
Cap rate
0.6%
Rent to Value Ratio