Milwaukee, WI Investment Properties for Sale
Browse homes for sale and investment properties in Milwaukee, WI. Refine your search by price, property type, or more.
Best cash flowing properties in Milwaukee, WI
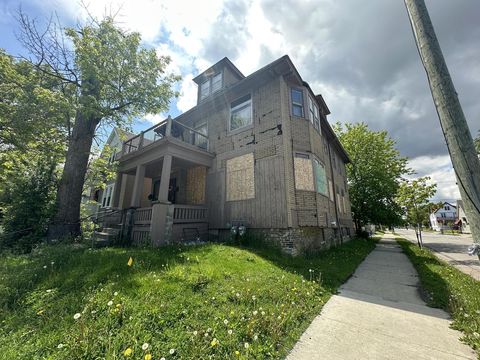
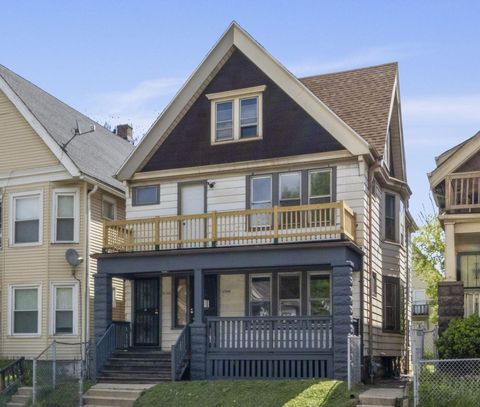
Active
$70,000
6
bds
|
0
ba
|
2,338
sqft
|
built
1911
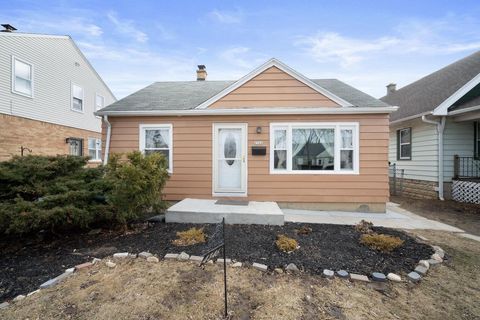
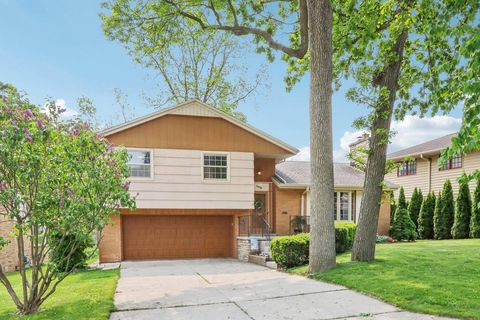
2877 N 23rd St, Milwaukee, WI 53206
$705
Cash flow
11.7%
Cash-on-Cash Return
12.1%
Cap rate
1.6%
Rent to Value Ratio

Active
$77,900
3
bds
|
0
ba
|
2,100
sqft
|
built
1900
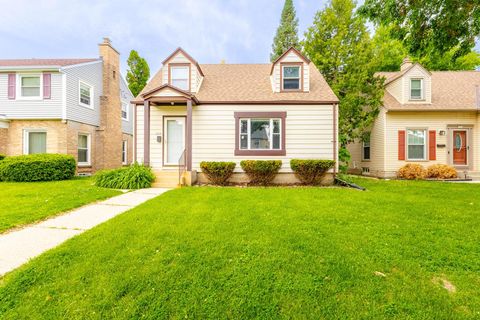
2757 N 11th Ln, Milwaukee, WI 53206
$585
Cash flow
39.2%
Cash-on-Cash Return
15.3%
Cap rate
2.1%
Rent to Value Ratio
959 out of 1,102 properties for sale in Milwaukee, WI
Limited Results Shown
Create a free account, or log in to reveal all property listings and enjoy the complete experience.
Active
$360,000
3
bds
|
0
ba
|
1,228
sqft
|
built
1921
1114 E Manitoba St, Milwaukee, WI 53207
$-1,028
Cash flow
-14.9%
Cash-on-Cash Return
2.8%
Cap rate
0.5%
Rent to Value Ratio

Active
$224,900
2
bds
|
0
ba
|
936
sqft
|
built
1949
2951 S 50th St, Milwaukee, WI 53219
$-589
Cash flow
-13.7%
Cash-on-Cash Return
3.1%
Cap rate
0.5%
Rent to Value Ratio
Active
$249,900
3
bds
|
0
ba
|
1,305
sqft
|
built
1952
5714 W Philip Pl, Milwaukee, WI 53216
$-746
Cash flow
-15.6%
Cash-on-Cash Return
2.7%
Cap rate
0.5%
Rent to Value Ratio
Active
$148,500
6
bds
|
0
ba
|
2,544
sqft
|
built
1912
2162 N 41st St, Milwaukee, WI 53208
$-148
Cash flow
-5.2%
Cash-on-Cash Return
5.1%
Cap rate
0.7%
Rent to Value Ratio
Active
$204,900
3
bds
|
0
ba
|
1,125
sqft
|
built
1953
4346 N 63rd St, Milwaukee, WI 53216
$-131
Cash flow
-3.3%
Cash-on-Cash Return
5.5%
Cap rate
0.8%
Rent to Value Ratio
Active
$179,900
3
bds
|
0
ba
|
1,382
sqft
|
built
1941
3419 N 56th St, Milwaukee, WI 53216
$-332
Cash flow
-9.6%
Cash-on-Cash Return
4.0%
Cap rate
0.7%
Rent to Value Ratio
Active
$214,900
1
bds
|
0
ba
|
621
sqft
|
built
1921
215 W Maple St, Milwaukee, WI 53204
$-672
Cash flow
-16.3%
Cash-on-Cash Return
2.5%
Cap rate
0.5%
Rent to Value Ratio

Active
$800,000
4
bds
|
0
ba
|
3,074
sqft
|
built
1925
3833 N Prospect Ave, Milwaukee, WI 53211
$-2,499
Cash flow
-16.3%
Cash-on-Cash Return
2.5%
Cap rate
0.5%
Rent to Value Ratio
Active
$175,000
3
bds
|
0
ba
|
1,227
sqft
|
built
1951
4950 N 21st St, Milwaukee, WI 53209
$-189
Cash flow
-5.6%
Cash-on-Cash Return
5.0%
Cap rate
0.8%
Rent to Value Ratio
Active
$289,900
3
bds
|
0
ba
|
1,159
sqft
|
built
1953
2506 W Whitaker Ave, Milwaukee, WI 53221
$-659
Cash flow
-11.9%
Cash-on-Cash Return
3.5%
Cap rate
0.6%
Rent to Value Ratio
Active
$329,000
4
bds
|
0
ba
|
1,828
sqft
|
built
1966
8533 W Grantosa Dr, Milwaukee, WI 53225
$-922
Cash flow
-14.6%
Cash-on-Cash Return
2.9%
Cap rate
0.5%
Rent to Value Ratio
Active
$434,900
5
bds
|
0
ba
|
2,464
sqft
|
built
1918
1829 N 52nd St, Milwaukee, WI 53208
$-1,289
Cash flow
-15.5%
Cash-on-Cash Return
2.7%
Cap rate
0.5%
Rent to Value Ratio
Active
$450,000
1
bds
|
0
ba
|
880
sqft
|
built
2004
601 E Erie St, Milwaukee, WI 53202
$-1,721
Cash flow
-20.0%
Cash-on-Cash Return
1.7%
Cap rate
0.4%
Rent to Value Ratio
Active
$70,000
6
bds
|
0
ba
|
2,338
sqft
|
built
1911
2877 N 23rd St, Milwaukee, WI 53206
$705
Cash flow
11.7%
Cash-on-Cash Return
12.1%
Cap rate
1.6%
Rent to Value Ratio
Pending
$369,900
2
bds
|
0
ba
|
1,167
sqft
|
built
1998
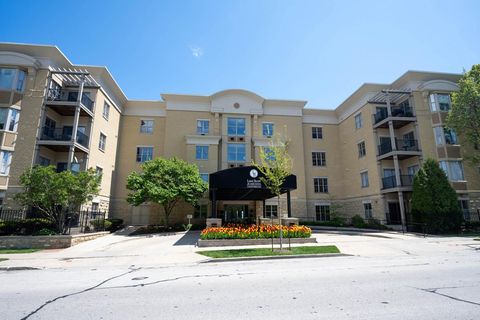
1300 N Prospect Ave, Milwaukee, WI 53202
$-1,018
Cash flow
-14.4%
Cash-on-Cash Return
3.0%
Cap rate
0.6%
Rent to Value Ratio

Active
$299,900
3
bds
|
0
ba
|
1,522
sqft
|
built
1965
8611 W Grantosa Dr, Milwaukee, WI 53225
$-789
Cash flow
-13.7%
Cash-on-Cash Return
3.1%
Cap rate
0.6%
Rent to Value Ratio
Active
$335,000
3
bds
|
0
ba
|
1,625
sqft
|
built
1958
2628 S 49th St, Milwaukee, WI 53219
$-875
Cash flow
-13.6%
Cash-on-Cash Return
3.1%
Cap rate
0.6%
Rent to Value Ratio
Pending
$120,000
3
bds
|
0
ba
|
1,000
sqft
|
built
1928
2721 N 56th St, Milwaukee, WI 53210
$-10
Cash flow
-0.4%
Cash-on-Cash Return
6.2%
Cap rate
1.0%
Rent to Value Ratio
Active
$375,000
3
bds
|
0
ba
|
1,710
sqft
|
built
1940
2912 N 67th St, Milwaukee, WI 53210
$-965
Cash flow
-13.4%
Cash-on-Cash Return
3.2%
Cap rate
0.6%
Rent to Value Ratio
Active
$389,622
3
bds
|
0
ba
|
1,989
sqft
|
built
1991
9312 W Clovernook St, Milwaukee, WI 53224
$-1,100
Cash flow
-14.7%
Cash-on-Cash Return
2.9%
Cap rate
0.6%
Rent to Value Ratio
Active
$80,000
5
bds
|
0
ba
|
2,724
sqft
|
built
1890
1919 N 17th St, Milwaukee, WI 53205
$455
Cash flow
29.7%
Cash-on-Cash Return
13.1%
Cap rate
1.8%
Rent to Value Ratio
Active
$164,500
3
bds
|
0
ba
|
1,264
sqft
|
built
1955
5921 N 66th St, Milwaukee, WI 53218
$-200
Cash flow
-6.3%
Cash-on-Cash Return
4.8%
Cap rate
0.8%
Rent to Value Ratio
Active
$219,000
1
bds
|
0
ba
|
755
sqft
|
built
1982
1633 N Prospect Ave, Milwaukee, WI 53202
$-532
Cash flow
-12.7%
Cash-on-Cash Return
3.3%
Cap rate
0.6%
Rent to Value Ratio

Active
$679,900
5
bds
|
0
ba
|
2,661
sqft
|
built
1889
2846 N Stowell Ave, Milwaukee, WI 53211
$-2,235
Cash flow
-17.2%
Cash-on-Cash Return
2.3%
Cap rate
0.5%
Rent to Value Ratio
Active
$179,900
3
bds
|
0
ba
|
864
sqft
|
built
1954
3609 N 77th St, Milwaukee, WI 53222
$-283
Cash flow
-8.2%
Cash-on-Cash Return
4.4%
Cap rate
0.7%
Rent to Value Ratio
Active
$230,000
7
bds
|
0
ba
|
3,117
sqft
|
built
1941
3240 N Richards St, Milwaukee, WI 53212
$-607
Cash flow
-13.8%
Cash-on-Cash Return
3.1%
Cap rate
0.5%
Rent to Value Ratio
Active
$574,900
4
bds
|
0
ba
|
3,007
sqft
|
built
1928
3448 S Indiana Ave, Milwaukee, WI 53207
$-2,044
Cash flow
-18.5%
Cash-on-Cash Return
2.0%
Cap rate
0.4%
Rent to Value Ratio
Active
$199,900
3
bds
|
0
ba
|
1,067
sqft
|
built
1965
6683 N 58th St, Milwaukee, WI 53223
$-523
Cash flow
-13.7%
Cash-on-Cash Return
3.1%
Cap rate
0.6%
Rent to Value Ratio
Active
$259,900
2
bds
|
0
ba
|
1,214
sqft
|
built
1927
2855 N Hartung Ave, Milwaukee, WI 53210
$-669
Cash flow
-13.4%
Cash-on-Cash Return
3.2%
Cap rate
0.6%
Rent to Value Ratio
Active
$29,500
3
bds
|
0
ba
|
924
sqft
|
built
1905
2511 N 36th St, Milwaukee, WI 53210
$569
Cash flow
22.5%
Cash-on-Cash Return
23.1%
Cap rate
3.4%
Rent to Value Ratio
Active
$229,900
4
bds
|
0
ba
|
1,439
sqft
|
built
1914
2664 S 29th St, Milwaukee, WI 53215
$-491
Cash flow
-11.1%
Cash-on-Cash Return
3.7%
Cap rate
0.7%
Rent to Value Ratio
Active
$224,900
2
bds
|
0
ba
|
689
sqft
|
built
1953
3411 S 63rd St, Milwaukee, WI 53219
$-501
Cash flow
-11.6%
Cash-on-Cash Return
3.6%
Cap rate
0.6%
Rent to Value Ratio
Active
$129,900
4
bds
|
0
ba
|
2,330
sqft
|
built
1916
2544 N 35th St, Milwaukee, WI 53210
$-9
Cash flow
-0.4%
Cash-on-Cash Return
6.2%
Cap rate
0.8%
Rent to Value Ratio
Active
$174,900
5
bds
|
0
ba
|
2,077
sqft
|
built
1961
5723 N 97th St, Milwaukee, WI 53225
$-452
Cash flow
-13.5%
Cash-on-Cash Return
3.2%
Cap rate
0.6%
Rent to Value Ratio
Active
$299,900
3
bds
|
0
ba
|
1,260
sqft
|
built
1956
2675 S 71st St, Milwaukee, WI 53219
$-770
Cash flow
-13.4%
Cash-on-Cash Return
3.2%
Cap rate
0.6%
Rent to Value Ratio
Active
$159,900
5
bds
|
0
ba
|
2,394
sqft
|
built
1919
2977 N 26th St, Milwaukee, WI 53206
$-747
Cash flow
-24.4%
Cash-on-Cash Return
0.7%
Cap rate
0.5%
Rent to Value Ratio
Active
$219,900
3
bds
|
0
ba
|
1,026
sqft
|
built
1955
4349 N 80th St, Milwaukee, WI 53222
$-304
Cash flow
-7.2%
Cash-on-Cash Return
4.6%
Cap rate
0.7%
Rent to Value Ratio
Active
$77,900
3
bds
|
0
ba
|
2,100
sqft
|
built
1900
2757 N 11th Ln, Milwaukee, WI 53206
$585
Cash flow
39.2%
Cash-on-Cash Return
15.3%
Cap rate
2.1%
Rent to Value Ratio

Active
$110,000
3
bds
|
0
ba
|
1,098
sqft
|
built
1960
8594 W Villard Ave, Milwaukee, WI 53225
$7
Cash flow
0.3%
Cash-on-Cash Return
6.3%
Cap rate
0.9%
Rent to Value Ratio

Active
$189,900
3
bds
|
0
ba
|
967
sqft
|
built
1961
7928 W Clovernook St, Milwaukee, WI 53223
$-319
Cash flow
-8.8%
Cash-on-Cash Return
4.2%
Cap rate
0.7%
Rent to Value Ratio