Hennepin County Investment Properties for Sale
Browse homes for sale and investment properties in Hennepin County. Refine your search by price, property type, or more.
Best cash flowing properties in Hennepin County
Active
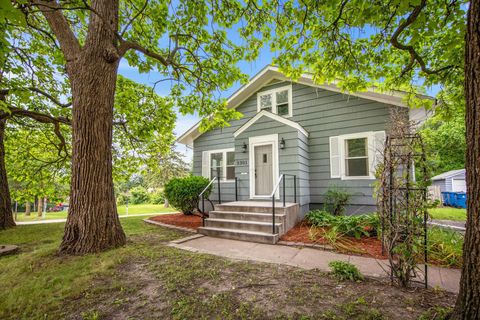
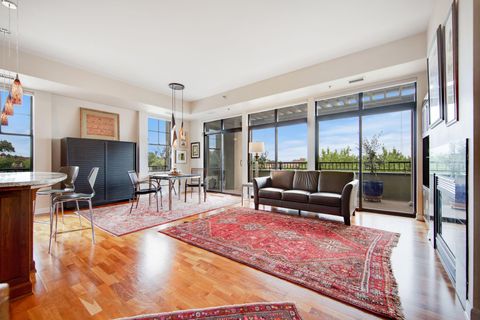
$239,900
3
bds
|
1
ba
|
1,513
sqft
|
built
1924
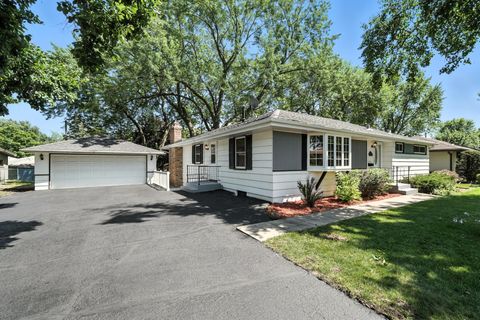
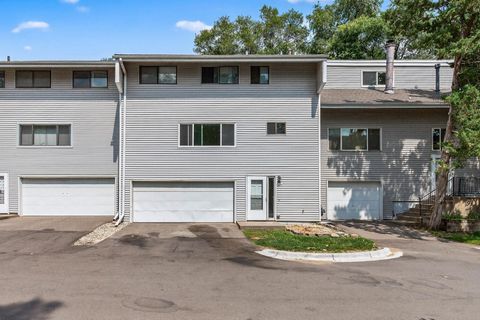
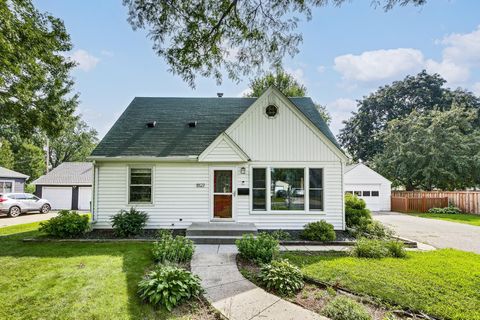
3301 Beard Ave N, Minneapolis, MN 55422
$-113
Cash flow
-2.5%
Cash-on-Cash Return
5.1%
Cap rate
0.8%
Rent to Value Ratio
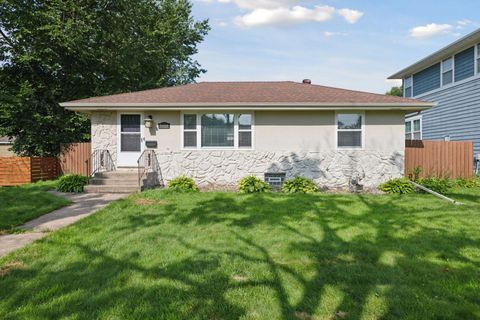
Active
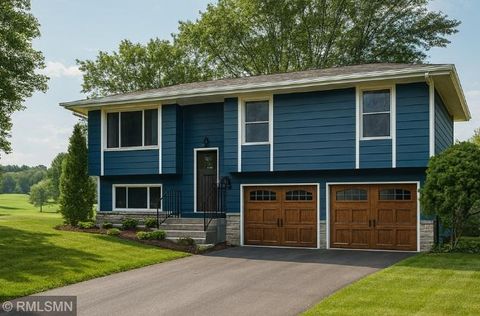
$349,000
3
bds
|
2
ba
|
1,694
sqft
|
built
1956
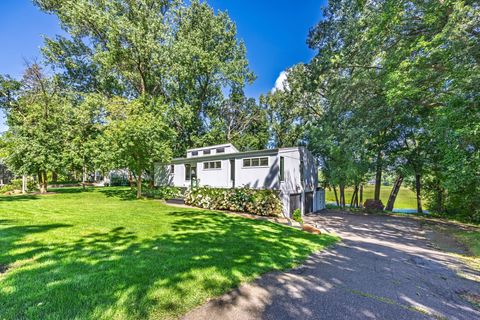
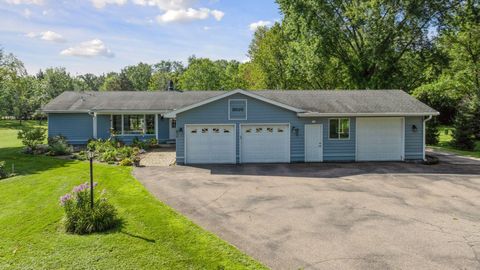
5414 27th Ave S, Minneapolis, MN 55417
$-117
Cash flow
-1.7%
Cash-on-Cash Return
5.3%
Cap rate
0.8%
Rent to Value Ratio
1,937 out of 2,841 properties for sale in Hennepin County
Limited Results Shown
Create a free account, or log in to reveal all property listings and enjoy the complete experience.
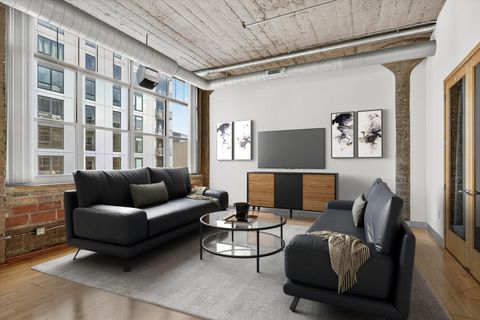
Active
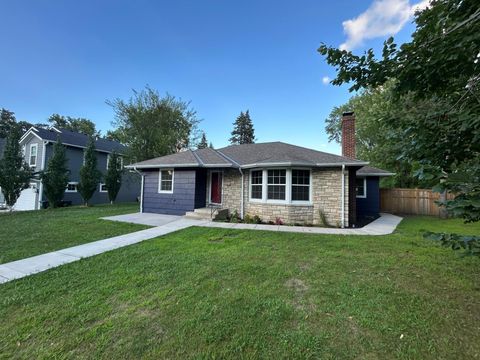
$259,900
2
bds
|
1
ba
|
1,352
sqft
|
built
1926
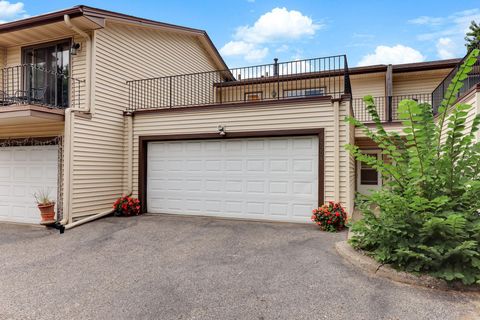
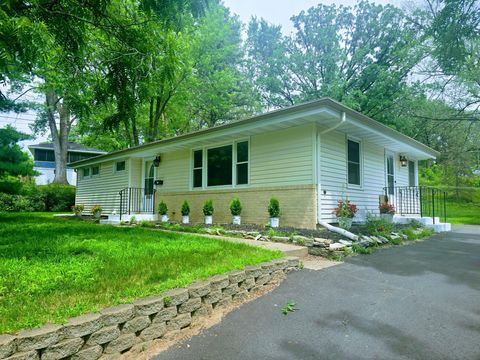
521 S 7th St, Minneapolis, MN 55415
$-1,017
Cash flow
-20.4%
Cash-on-Cash Return
1.0%
Cap rate
0.8%
Rent to Value Ratio
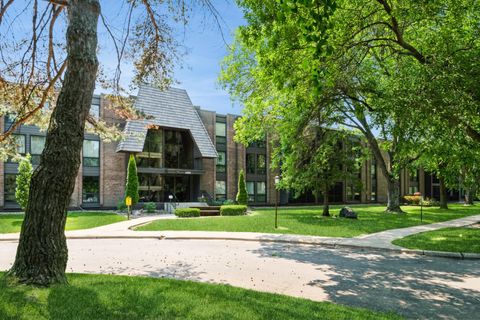
Active
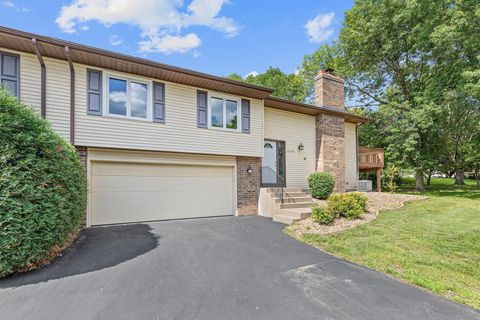
$245,000
1
bds
|
2
ba
|
1,360
sqft
|
built
1975
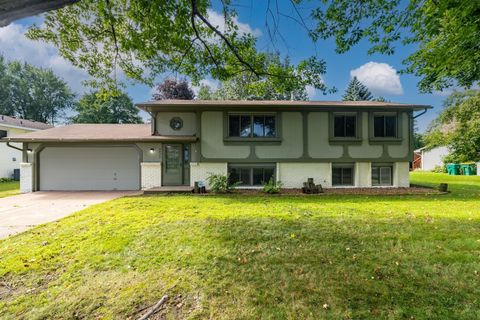
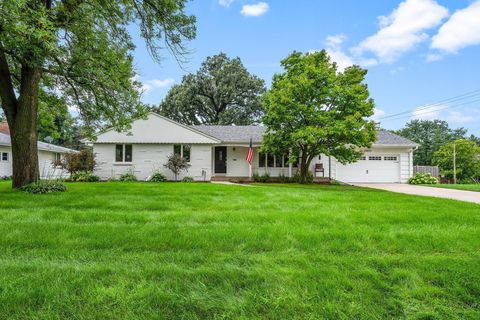
6105 Lincoln Dr, Edina, MN 55436
$-1,143
Cash flow
-24.3%
Cash-on-Cash Return
0.1%
Cap rate
0.7%
Rent to Value Ratio
Active
$460,000
2
bds
|
2
ba
|
1,404
sqft
|
built
2006
317 Groveland Ave, Minneapolis, MN 55403
$-1,726
Cash flow
-19.6%
Cash-on-Cash Return
1.2%
Cap rate
0.6%
Rent to Value Ratio
Active
$340,000
3
bds
|
2
ba
|
1,562
sqft
|
built
1978
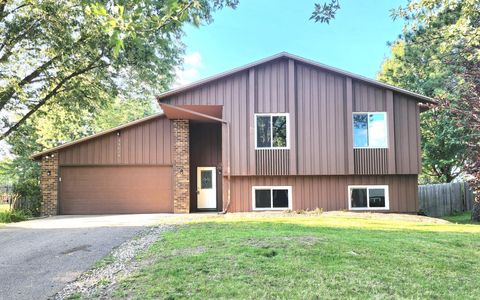
3316 80th Ave N, Brooklyn Park, MN 55443
$-367
Cash flow
-5.6%
Cash-on-Cash Return
4.4%
Cap rate
0.7%
Rent to Value Ratio
Active
$469,900
4
bds
|
2
ba
|
2,107
sqft
|
built
1947
6945 Oliver Ave S, Richfield, MN 55423
$-831
Cash flow
-9.2%
Cash-on-Cash Return
3.6%
Cap rate
0.6%
Rent to Value Ratio
Active
$249,000
2
bds
|
2
ba
|
1,408
sqft
|
built
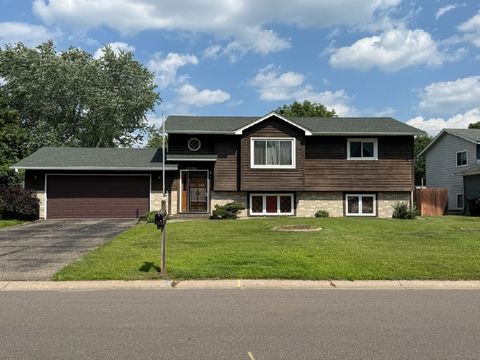
1979
14350 92nd Ave N, Maple Grove, MN 55369
$-122
Cash flow
-2.6%
Cash-on-Cash Return
5.1%
Cap rate
1.0%
Rent to Value Ratio
Active
$485,000
4
bds
|
2
ba
|
2,148
sqft
|
built
1992
7095 Deerwood Ln N, Maple Grove, MN 55369
$-695
Cash flow
-7.5%
Cash-on-Cash Return
4.0%
Cap rate
0.6%
Rent to Value Ratio
Active
$1,995,000
5
bds
|
7
ba
|
6,418
sqft
|
built
1964
27 Circle W, Edina, MN 55436
$-6,179
Cash flow
-16.2%
Cash-on-Cash Return
2.0%
Cap rate
0.4%
Rent to Value Ratio
Active
$285,000
4
bds
|
2
ba
|
1,572
sqft
|
built
1925
4019 Regent Ave N, Robbinsdale, MN 55422
$-208
Cash flow
-3.8%
Cash-on-Cash Return
4.8%
Cap rate
0.7%
Rent to Value Ratio
Active
$279,900
3
bds
|
2
ba
|
1,733
sqft
|
built
1965
4360 Brookside Ct, Edina, MN 55436
$-1,316
Cash flow
-24.5%
Cash-on-Cash Return
0.0%
Cap rate
0.6%
Rent to Value Ratio
Active
$1,365,000
5
bds
|
5
ba
|
4,871
sqft
|
built
1994
18034 Tamarack Dr, Minnetonka, MN 55345
$-4,128
Cash flow
-15.8%
Cash-on-Cash Return
2.1%
Cap rate
0.4%
Rent to Value Ratio
Active
$274,900
3
bds
|
2
ba
|
1,702
sqft
|
built
1984
7106 W 113th St, Bloomington, MN 55438
$-379
Cash flow
-7.2%
Cash-on-Cash Return
4.0%
Cap rate
0.8%
Rent to Value Ratio
Active
$299,900
2
bds
|
1
ba
|
639
sqft
|
built
1952
1660 Blackstone Ave, Saint Louis Park, MN 55416
$-435
Cash flow
-7.6%
Cash-on-Cash Return
3.9%
Cap rate
0.6%
Rent to Value Ratio
Active
$430,000
3
bds
|
3
ba
|
2,290
sqft
|
built
1996
9365 Tewsbury Bnd, Osseo, MN 55311
$-1,066
Cash flow
-12.9%
Cash-on-Cash Return
2.7%
Cap rate
0.6%
Rent to Value Ratio
Active
$330,000
2
bds
|
1
ba
|
986
sqft
|
built
1977
1164 Xene Ln N, Plymouth, MN 55447
$-727
Cash flow
-11.5%
Cash-on-Cash Return
3.0%
Cap rate
0.7%
Rent to Value Ratio
Active
$900,000
5
bds
|
4
ba
|
4,322
sqft
|
built
1994
16035 36th Pl N, Minneapolis, MN 55446
$-2,496
Cash flow
-14.5%
Cash-on-Cash Return
2.4%
Cap rate
0.4%
Rent to Value Ratio
Active
$640,000
4
bds
|
4
ba
|
3,390
sqft
|
built
1994
8310 W 109th St, Bloomington, MN 55438
$-1,246
Cash flow
-10.2%
Cash-on-Cash Return
3.3%
Cap rate
0.5%
Rent to Value Ratio

Active
$400,000
2
bds
|
2
ba
|
1,909
sqft
|
built
1943
8912 W River Rd, Brooklyn Park, MN 55444
$-411
Cash flow
-5.4%
Cash-on-Cash Return
4.4%
Cap rate
0.7%
Rent to Value Ratio
Active
$550,000
4
bds
|
3
ba
|
2,224
sqft
|
built
1972
5900 Timberglade Dr, Bloomington, MN 55438
$-984
Cash flow
-9.3%
Cash-on-Cash Return
3.5%
Cap rate
0.6%
Rent to Value Ratio
Active
$389,900
3
bds
|
2
ba
|
2,164
sqft
|
built
1959
10917 Abbott Ave S, Bloomington, MN 55431
$-454
Cash flow
-6.1%
Cash-on-Cash Return
4.3%
Cap rate
0.6%
Rent to Value Ratio
Active
$650,000
4
bds
|
2
ba
|
2,163
sqft
|
built
1972
2131 Sheridan Hills Rd, Wayzata, MN 55391
$-939
Cash flow
-7.5%
Cash-on-Cash Return
3.9%
Cap rate
0.6%
Rent to Value Ratio
Active
$280,000
3
bds
|
2
ba
|
1,584
sqft
|
built
1975
11004 Trail West Rd, Bloomington, MN 55437
$-364
Cash flow
-6.8%
Cash-on-Cash Return
4.1%
Cap rate
0.8%
Rent to Value Ratio
Active
$349,900
4
bds
|
2
ba
|
2,078
sqft
|
built
1978
8424 Rhode Island Dr N, Brooklyn Park, MN 55445
$-642
Cash flow
-9.6%
Cash-on-Cash Return
3.5%
Cap rate
0.5%
Rent to Value Ratio
Active
$875,000
4
bds
|
3
ba
|
2,580
sqft
|
built
1958
535 W River Pkwy, Champlin, MN 55316
$-2,376
Cash flow
-14.2%
Cash-on-Cash Return
2.4%
Cap rate
0.4%
Rent to Value Ratio
Active
$1,180,000
5
bds
|
4
ba
|
4,900
sqft
|
built
1990
4803 Chantrey Pl, Minnetonka, MN 55345
$-3,063
Cash flow
-13.5%
Cash-on-Cash Return
2.6%
Cap rate
0.4%
Rent to Value Ratio
Active
$449,900
4
bds
|
4
ba
|
2,521
sqft
|
built
1954
7204 Harriet Ave, Richfield, MN 55423
$-535
Cash flow
-6.2%
Cash-on-Cash Return
4.3%
Cap rate
0.6%
Rent to Value Ratio
Active
$800,000
5
bds
|
4
ba
|
4,128
sqft
|
built
2012
3277 Pin Oak Rd, Hamel, MN 55340
$-1,856
Cash flow
-12.1%
Cash-on-Cash Return
2.9%
Cap rate
0.5%
Rent to Value Ratio
Active
$185,000
3
bds
|
2
ba
|
1,404
sqft
|
built
1975
6618 Camden Dr, Brooklyn Center, MN 55430
$-203
Cash flow
-5.7%
Cash-on-Cash Return
4.4%
Cap rate
1.1%
Rent to Value Ratio

Active
$270,000
3
bds
|
3
ba
|
1,669
sqft
|
built
2007
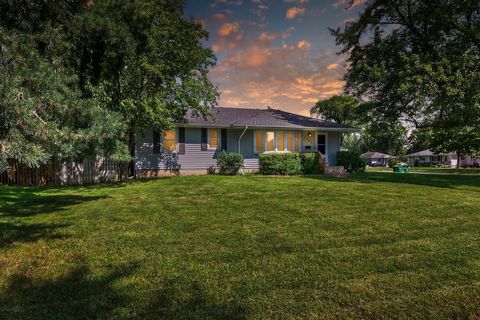
7337 Unity Ln N, Brooklyn Park, MN 55443
$-151
Cash flow
-2.9%
Cash-on-Cash Return
5.0%
Cap rate
0.9%
Rent to Value Ratio
Active
$550,000
4
bds
|
3
ba
|
2,295
sqft
|
built
1978
3310 Red Fox Dr, Hamel, MN 55340
$-613
Cash flow
-5.8%
Cash-on-Cash Return
4.3%
Cap rate
0.6%
Rent to Value Ratio
Active
$410,000
4
bds
|
2
ba
|
2,098
sqft
|
built
1960
11509 Palmer Rd, Bloomington, MN 55437
$-884
Cash flow
-11.2%
Cash-on-Cash Return
3.1%
Cap rate
0.5%
Rent to Value Ratio
Active
$775,000
5
bds
|
3
ba
|
2,921
sqft
|
built
1959
6800 Chapel Ln, Edina, MN 55439
$-1,374
Cash flow
-9.2%
Cash-on-Cash Return
3.6%
Cap rate
0.6%
Rent to Value Ratio
Active
$390,000
4
bds
|
2
ba
|
1,600
sqft
|
built
1979
14624 92nd Pl N, Maple Grove, MN 55369
$-238
Cash flow
-3.2%
Cash-on-Cash Return
4.9%
Cap rate
0.7%
Rent to Value Ratio
Active
$330,000
2
bds
|
2
ba
|
1,771
sqft
|
built
1986
11124 Utah Ave N, Champlin, MN 55316
$-474
Cash flow
-7.5%
Cash-on-Cash Return
4.0%
Cap rate
0.7%
Rent to Value Ratio
Active
$350,000
3
bds
|
2
ba
|
1,706
sqft
|
built
1949
8127 2nd Ave S, Bloomington, MN 55420
$-252
Cash flow
-3.8%
Cash-on-Cash Return
4.8%
Cap rate
0.7%
Rent to Value Ratio
Active
$365,000
3
bds
|
1
ba
|
1,748
sqft
|
built
1922
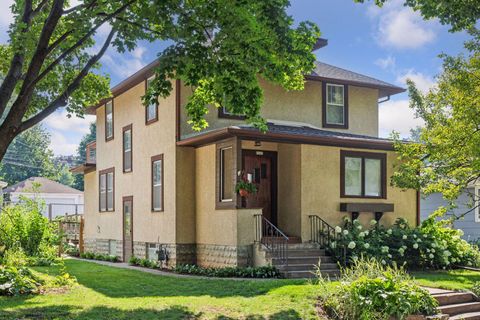
2547 Lincoln St NE, Minneapolis, MN 55418
$-126
Cash flow
-1.8%
Cash-on-Cash Return
5.3%
Cap rate
0.8%
Rent to Value Ratio
Active
$345,000
3
bds
|
2
ba
|
1,680
sqft
|
built
1954
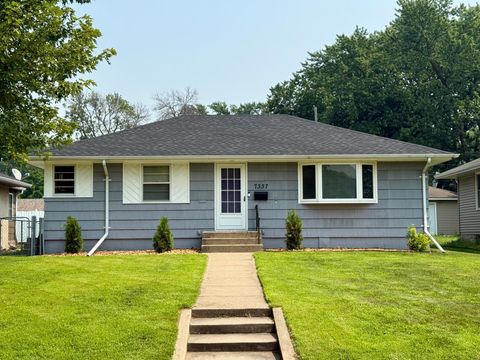
7337 4th Ave S, Richfield, MN 55423
$-543
Cash flow
-8.2%
Cash-on-Cash Return
3.8%
Cap rate
0.6%
Rent to Value Ratio
Active
$355,000
3
bds
|
2
ba
|
2,010
sqft
|
built
1958
6400 Bethia Ln, Brooklyn Park, MN 55428
$-493
Cash flow
-7.2%
Cash-on-Cash Return
4.0%
Cap rate
0.6%
Rent to Value Ratio