Hennepin County Investment Properties for Sale
Browse homes for sale and investment properties in Hennepin County. Refine your search by price, property type, or more.
Best cash flowing properties in Hennepin County
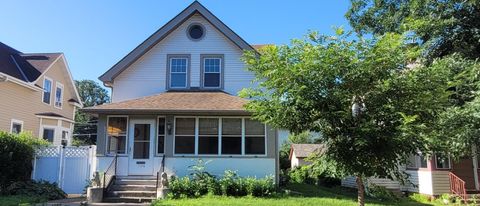
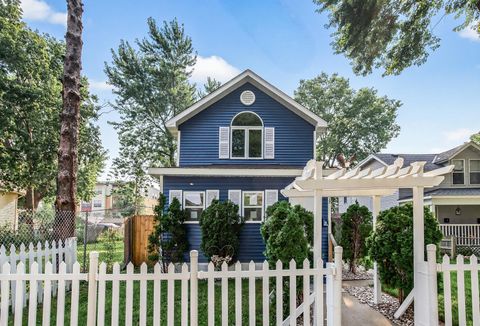
Active
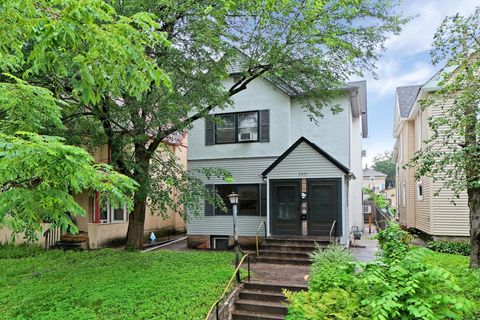
$290,000
3
bds
|
2
ba
|
1,684
sqft
|
built
1900
2804 Pillsbury Ave S, Minneapolis, MN 55408
$140
Cash flow
2.5%
Cash-on-Cash Return
6.3%
Cap rate
0.9%
Rent to Value Ratio
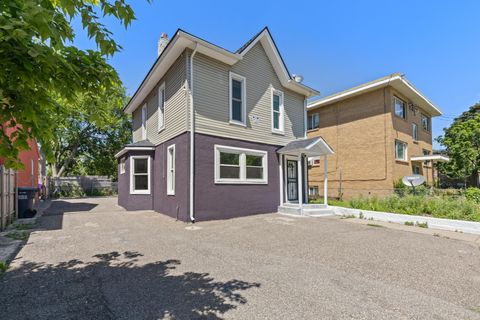
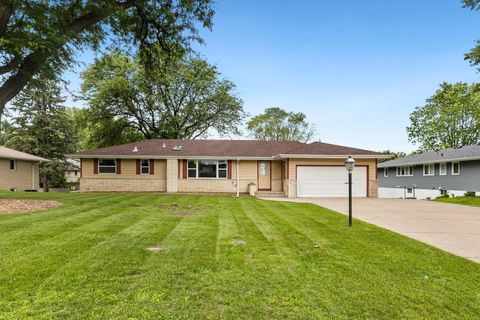
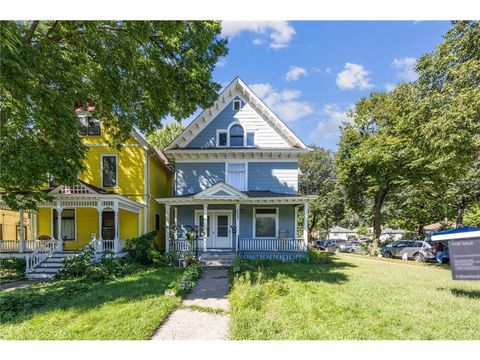
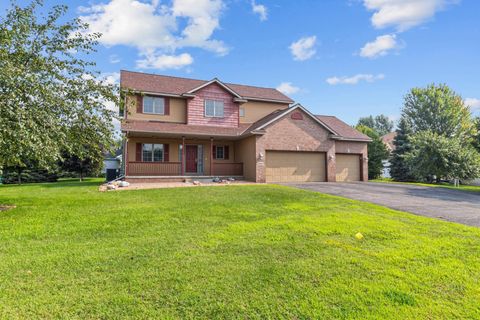
Active
$210,000
3
bds
|
3
ba
|
1,545
sqft
|
built
1924
3715 31st Ave N, Robbinsdale, MN 55422
$78
Cash flow
1.9%
Cash-on-Cash Return
6.1%
Cap rate
1.1%
Rent to Value Ratio
1,641 out of 2,200 properties for sale in Hennepin County
Limited Results Shown
Create a free account, or log in to reveal all property listings and enjoy the complete experience.
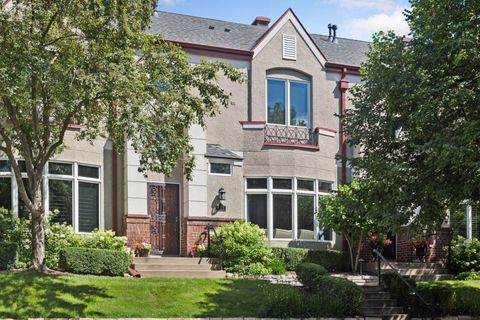
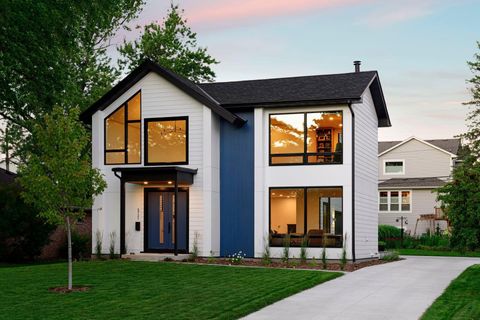
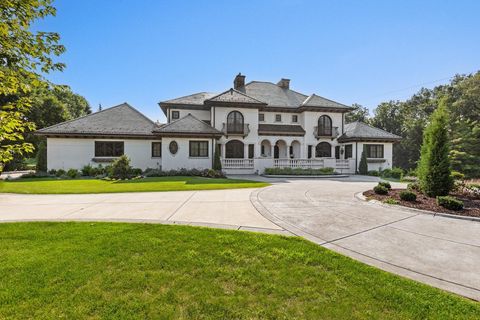
Active
$875,000
2
bds
|
3
ba
|
2,257
sqft
|
built
1999
311 Coventry Ln, Edina, MN 55435
$-2,877
Cash flow
-17.2%
Cash-on-Cash Return
1.7%
Cap rate
0.5%
Rent to Value Ratio
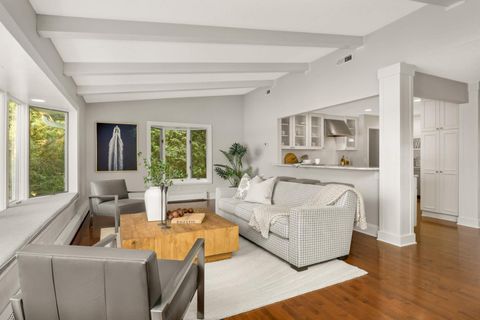
Active
$2,250,000
4
bds
|
5
ba
|
4,172
sqft
|
built
1963
1310 Vine Pl, Mound, MN 55364
$-8,504
Cash flow
-19.7%
Cash-on-Cash Return
1.1%
Cap rate
0.3%
Rent to Value Ratio
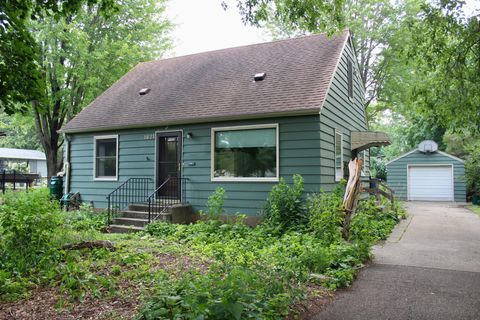
Active
$125,000
3
bds
|
2
ba
|
1,208
sqft
|
built
1926
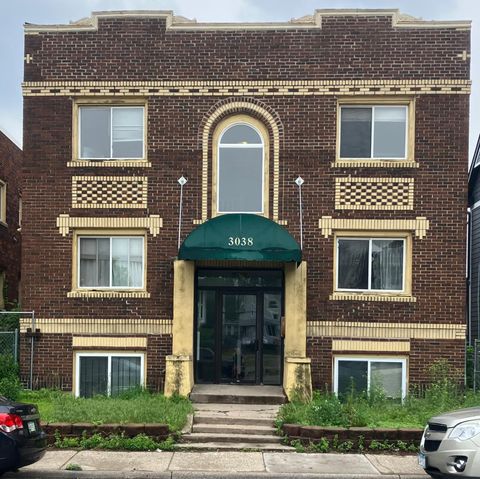
3038 13th Ave S, Minneapolis, MN 55407
$-96
Cash flow
-4.0%
Cash-on-Cash Return
4.8%
Cap rate
1.6%
Rent to Value Ratio
Active
$252,000
3
bds
|
2
ba
|
1,560
sqft
|
built
1979
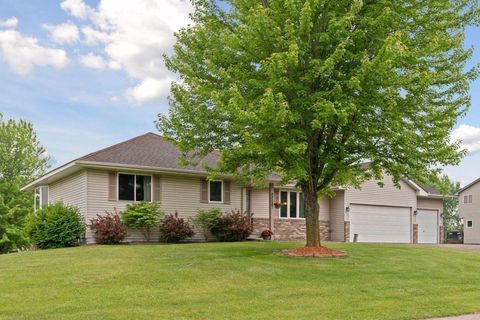
10372 Balsam Ln, Eden Prairie, MN 55347
$-193
Cash flow
-4.0%
Cash-on-Cash Return
4.8%
Cap rate
0.9%
Rent to Value Ratio
Active
$1,195,000
4
bds
|
5
ba
|
3,371
sqft
|
built
1938
4100 Sunset Blvd, Saint Louis Park, MN 55416
$-3,336
Cash flow
-14.6%
Cash-on-Cash Return
2.3%
Cap rate
0.4%
Rent to Value Ratio

Active
$4,950,000
4
bds
|
6
ba
|
5,723
sqft
|
built
1973
3135 N Shore Dr, Wayzata, MN 55391
$-21,775
Cash flow
-23.0%
Cash-on-Cash Return
0.4%
Cap rate
0.1%
Rent to Value Ratio
Active
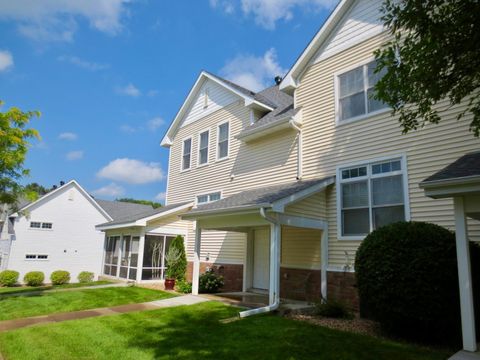
$329,900
2
bds
|
3
ba
|
1,763
sqft
|
built
2002
7850 Garland Ln N, Osseo, MN 55311
$-367
Cash flow
-5.8%
Cash-on-Cash Return
4.3%
Cap rate
0.8%
Rent to Value Ratio
Active
$675,000
4
bds
|
3
ba
|
3,027
sqft
|
built
1958
1031 Toledo Ave N, Golden Valley, MN 55422
$-699
Cash flow
-5.4%
Cash-on-Cash Return
4.4%
Cap rate
0.6%
Rent to Value Ratio
Active
$360,000
3
bds
|
2
ba
|
1,642
sqft
|
built
1913
1104 24th Ave NE, Minneapolis, MN 55418
$-280
Cash flow
-4.1%
Cash-on-Cash Return
4.7%
Cap rate
0.7%
Rent to Value Ratio
Active
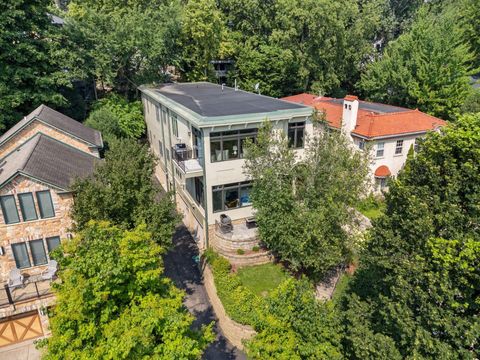
$1,695,000
4
bds
|
4
ba
|
3,039
sqft
|
built
2019
5721 Abbott Ave S, Edina, MN 55410
$-5,759
Cash flow
-17.7%
Cash-on-Cash Return
1.6%
Cap rate
0.3%
Rent to Value Ratio
Active
$399,900
2
bds
|
1
ba
|
1,173
sqft
|
built
1948
1821 W 59th St, Minneapolis, MN 55419
$-273
Cash flow
-3.6%
Cash-on-Cash Return
4.9%
Cap rate
0.8%
Rent to Value Ratio

Active
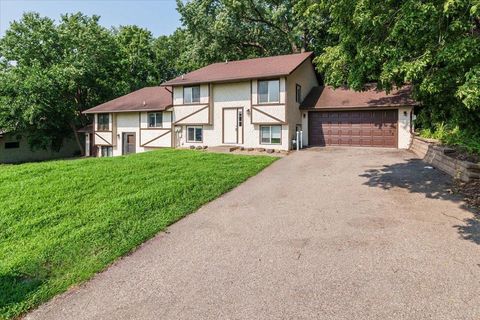
$399,900
4
bds
|
2
ba
|
1,913
sqft
|
built
1958
9124 Knox Ave S, Bloomington, MN 55431
$-171
Cash flow
-2.2%
Cash-on-Cash Return
5.2%
Cap rate
0.8%
Rent to Value Ratio
Active
$449,900
3
bds
|
3
ba
|
3,051
sqft
|
built
2001
22087 Jasmine Way, Rogers, MN 55374
$-425
Cash flow
-4.9%
Cash-on-Cash Return
4.5%
Cap rate
0.7%
Rent to Value Ratio
Active
$289,000
2
bds
|
2
ba
|
1,668
sqft
|
built
2002
5735 Village Trl, Mound, MN 55364
$-384
Cash flow
-6.9%
Cash-on-Cash Return
4.1%
Cap rate
0.8%
Rent to Value Ratio
Active
$1,100,000
2
bds
|
2
ba
|
2,464
sqft
|
built
2005
4436 Thomas Ave S, Minneapolis, MN 55410
$-3,604
Cash flow
-17.1%
Cash-on-Cash Return
1.7%
Cap rate
0.4%
Rent to Value Ratio
Active
$1,290,000
4
bds
|
6
ba
|
5,224
sqft
|
built
2011
12035 Trail Haven Ln, Rogers, MN 55374
$-4,246
Cash flow
-17.2%
Cash-on-Cash Return
1.7%
Cap rate
0.4%
Rent to Value Ratio
Active
$679,900
7
bds
|
4
ba
|
3,572
sqft
|
built
1978
5410 W Old Shakopee Cir, Bloomington, MN 55437
$-2,443
Cash flow
-18.7%
Cash-on-Cash Return
1.4%
Cap rate
0.3%
Rent to Value Ratio
Active
$244,900
3
bds
|
1
ba
|
1,539
sqft
|
built
1978
304 Lakeview Ave, Long Lake, MN 55356
$-249
Cash flow
-5.3%
Cash-on-Cash Return
4.5%
Cap rate
0.9%
Rent to Value Ratio

Active
$210,000
2
bds
|
1
ba
|
925
sqft
|
built
1919
3410 Sheridan Ave N, Minneapolis, MN 55412
$-421
Cash flow
-10.5%
Cash-on-Cash Return
3.3%
Cap rate
0.5%
Rent to Value Ratio
Active
$2,695,000
4
bds
|
5
ba
|
4,639
sqft
|
built
2025
132 Minnetonka Ave N, Wayzata, MN 55391
$-11,143
Cash flow
-21.6%
Cash-on-Cash Return
0.7%
Cap rate
0.1%
Rent to Value Ratio
Active
$395,000
4
bds
|
3
ba
|
2,322
sqft
|
built
1957
36 W 104th St, Bloomington, MN 55420
$-467
Cash flow
-6.2%
Cash-on-Cash Return
4.3%
Cap rate
0.6%
Rent to Value Ratio
Active
$419,900
3
bds
|
3
ba
|
2,010
sqft
|
built
1991
11726 Colorado Ave N, Champlin, MN 55316
$-647
Cash flow
-8.0%
Cash-on-Cash Return
3.8%
Cap rate
0.6%
Rent to Value Ratio
Active
$1,350,000
4
bds
|
4
ba
|
4,324
sqft
|
built
1998
2828 Burnham Blvd, Minneapolis, MN 55416
$-4,737
Cash flow
-18.3%
Cash-on-Cash Return
1.5%
Cap rate
0.3%
Rent to Value Ratio
Active
$1,500,000
5
bds
|
5
ba
|
4,245
sqft
|
built
2025
4044 Merriam Rd, Minnetonka, MN 55305
$-5,521
Cash flow
-19.2%
Cash-on-Cash Return
1.3%
Cap rate
0.2%
Rent to Value Ratio
Active
$315,000
4
bds
|
3
ba
|
2,491
sqft
|
built
1900
2827 Lyndale Ave N, Minneapolis, MN 55411
$-835
Cash flow
-13.8%
Cash-on-Cash Return
2.5%
Cap rate
0.6%
Rent to Value Ratio
Active
$699,000
4
bds
|
2
ba
|
3,074
sqft
|
built
1957
3337 Decatur Ln, Saint Louis Park, MN 55426
$-1,358
Cash flow
-10.1%
Cash-on-Cash Return
3.3%
Cap rate
0.6%
Rent to Value Ratio
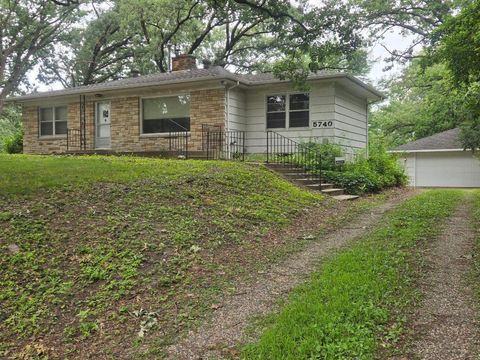
Active
$350,000
3
bds
|
1
ba
|
1,770
sqft
|
built
1946
5740 Golden Valley Rd, Golden Valley, MN 55422
$-486
Cash flow
-7.2%
Cash-on-Cash Return
4.0%
Cap rate
0.7%
Rent to Value Ratio
Active
$899,500
3
bds
|
3
ba
|
1,954
sqft
|
built
1948
5121 Gorgas Ave, Edina, MN 55424
$-2,987
Cash flow
-17.3%
Cash-on-Cash Return
1.7%
Cap rate
0.4%
Rent to Value Ratio
Active
$175,000
1
bds
|
1
ba
|
760
sqft
|
built
1987
3131 Excelsior Blvd, Minneapolis, MN 55416
$-43
Cash flow
-1.3%
Cash-on-Cash Return
5.4%
Cap rate
1.3%
Rent to Value Ratio
Active
$435,000
4
bds
|
3
ba
|
1,962
sqft
|
built
1964
8516 Zenith Cir S, Bloomington, MN 55431
$-516
Cash flow
-6.2%
Cash-on-Cash Return
4.3%
Cap rate
0.6%
Rent to Value Ratio
Active
$550,000
5
bds
|
4
ba
|
2,749
sqft
|
built
2004
4445 Fallgold Pkwy N, Brooklyn Park, MN 55443
$-1,458
Cash flow
-13.8%
Cash-on-Cash Return
2.5%
Cap rate
0.5%
Rent to Value Ratio

Active
$519,900
5
bds
|
4
ba
|
2,729
sqft
|
built
1993
2801 91st Cres N, Minneapolis, MN 55443
$-940
Cash flow
-9.4%
Cash-on-Cash Return
3.5%
Cap rate
0.6%
Rent to Value Ratio

Active
$360,000
2
bds
|
3
ba
|
2,267
sqft
|
built
2002
9260 Blackoaks Ct N, Osseo, MN 55311
$-545
Cash flow
-7.9%
Cash-on-Cash Return
3.9%
Cap rate
0.8%
Rent to Value Ratio
Active
$4,675,000
6
bds
|
8
ba
|
10,017
sqft
|
built
2006
1560 Hunter Dr, Wayzata, MN 55391
$-20,211
Cash flow
-22.6%
Cash-on-Cash Return
0.5%
Cap rate
0.2%
Rent to Value Ratio
Active
$240,000
2
bds
|
1
ba
|
1,046
sqft
|
built
1900
2417 15th Ave S, Minneapolis, MN 55404
$-281
Cash flow
-6.1%
Cash-on-Cash Return
4.3%
Cap rate
0.7%
Rent to Value Ratio
Active
$475,000
4
bds
|
3
ba
|
2,715
sqft
|
built
1985
5539 Village Dr, Edina, MN 55439
$-1,028
Cash flow
-11.3%
Cash-on-Cash Return
3.1%
Cap rate
0.7%
Rent to Value Ratio
Active
$345,000
4
bds
|
2
ba
|
1,549
sqft
|
built
1972
7581 Idaho Ave N, Brooklyn Park, MN 55428
$-425
Cash flow
-6.4%
Cash-on-Cash Return
4.2%
Cap rate
0.6%
Rent to Value Ratio
Active
$459,900
5
bds
|
3
ba
|
2,830
sqft
|
built
1900
2637 Taylor St NE, Minneapolis, MN 55418
$-1,163
Cash flow
-13.2%
Cash-on-Cash Return
2.6%
Cap rate
0.5%
Rent to Value Ratio