Hennepin County Investment Properties for Sale
Browse homes for sale and investment properties in Hennepin County. Refine your search by price, property type, or more.
Best cash flowing properties in Hennepin County
Active
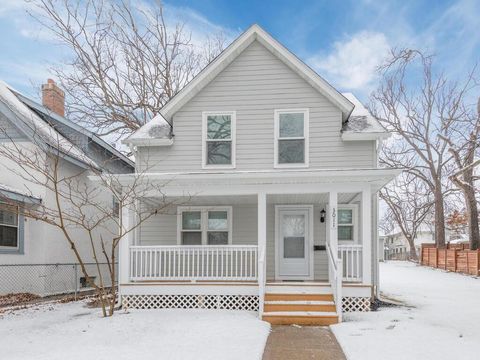
$235,000
3
bds
|
1
ba
|
1,449
sqft
|
built
1909
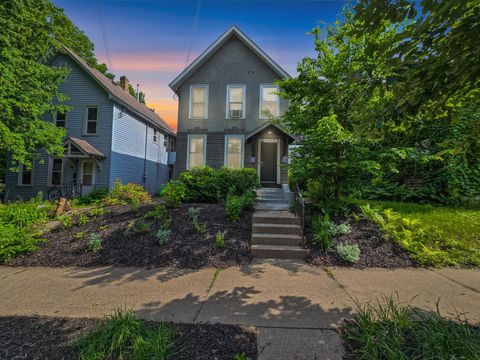
3011 Fremont Ave N, Minneapolis, MN 55411
$192
Cash flow
4.3%
Cash-on-Cash Return
6.7%
Cap rate
0.9%
Rent to Value Ratio
Active
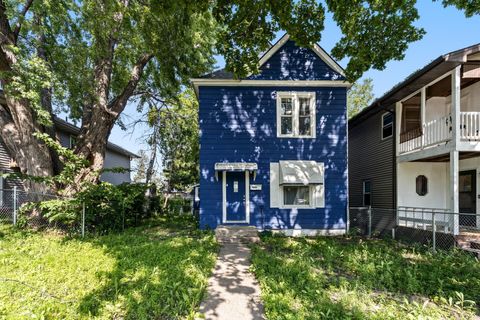
$249,900
4
bds
|
2
ba
|
1,680
sqft
|
built
1900
3114 Russell Ave N, Minneapolis, MN 55411
$-11
Cash flow
-0.2%
Cash-on-Cash Return
5.6%
Cap rate
0.8%
Rent to Value Ratio
955 out of 1,381 properties for sale in Hennepin County
Limited Results Shown
Create a free account, or log in to reveal all property listings and enjoy the complete experience.
Active
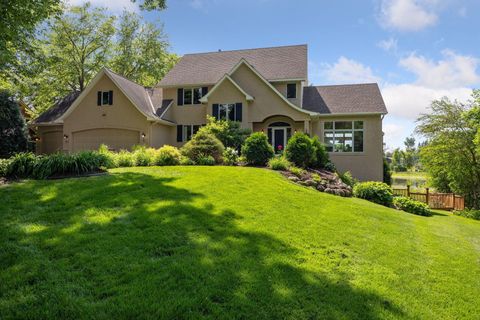
$950,000
4
bds
|
4
ba
|
3,700
sqft
|
built
1996
180 Ranchview Ln S, Wayzata, MN 55391
$-1,772
Cash flow
-9.7%
Cash-on-Cash Return
3.4%
Cap rate
0.6%
Rent to Value Ratio
Active
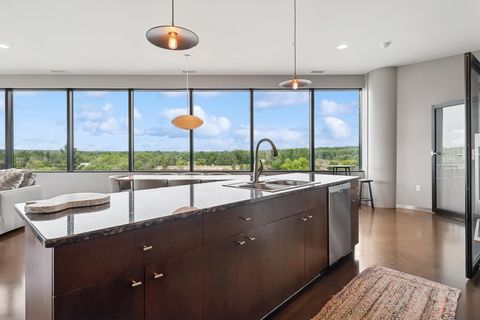
$368,000
2
bds
|
2
ba
|
1,633
sqft
|
built
1986
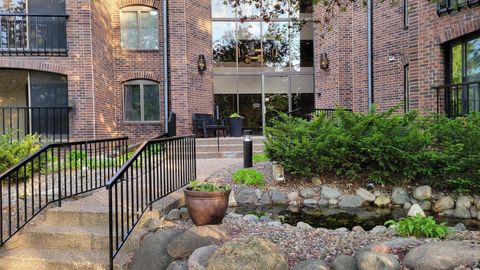
5601 Smetana Dr, Hopkins, MN 55343
$-1,217
Cash flow
-17.3%
Cash-on-Cash Return
1.7%
Cap rate
0.8%
Rent to Value Ratio
Active
$530,000
5
bds
|
4
ba
|
3,653
sqft
|
built
2021
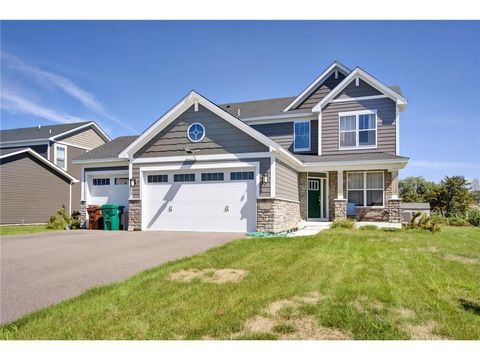
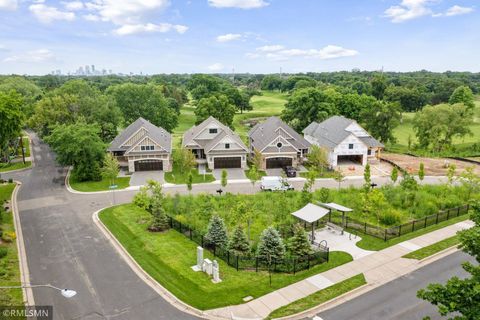
14385 Annapolis Ln N, Dayton, MN 55327
$-534
Cash flow
-5.3%
Cash-on-Cash Return
4.5%
Cap rate
0.7%
Rent to Value Ratio
Active
$389,900
2
bds
|
2
ba
|
1,834
sqft
|
built
1980
8430 Pennsylvania Rd, Bloomington, MN 55438
$-1,439
Cash flow
-19.3%
Cash-on-Cash Return
1.2%
Cap rate
0.7%
Rent to Value Ratio
Active
$410,000
3
bds
|
2
ba
|
1,740
sqft
|
built
1900
2619 S 7th St, Minneapolis, MN 55454
$-858
Cash flow
-10.9%
Cash-on-Cash Return
3.2%
Cap rate
0.5%
Rent to Value Ratio
Active
$619,900
4
bds
|
2
ba
|
2,276
sqft
|
built
1923
4536 Grand Ave S, Minneapolis, MN 55419
$-1,845
Cash flow
-15.5%
Cash-on-Cash Return
2.1%
Cap rate
0.4%
Rent to Value Ratio
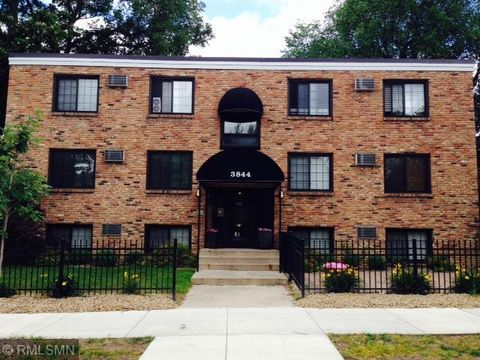
Active
$129,900
1
bds
|
1
ba
|
510
sqft
|
built
1965
3844 Nicollet Ave, Minneapolis, MN 55409
$-241
Cash flow
-9.7%
Cash-on-Cash Return
3.5%
Cap rate
1.1%
Rent to Value Ratio
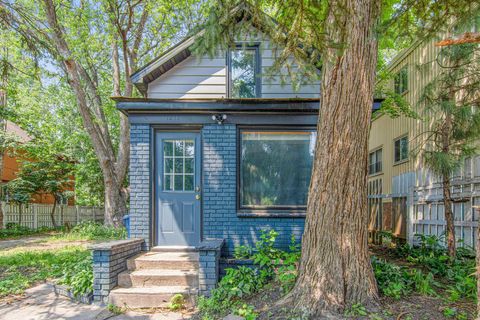
Active
$190,000
2
bds
|
1
ba
|
660
sqft
|
built
1900
1318 E 23rd St, Minneapolis, MN 55404
$-266
Cash flow
-7.3%
Cash-on-Cash Return
4.0%
Cap rate
0.6%
Rent to Value Ratio
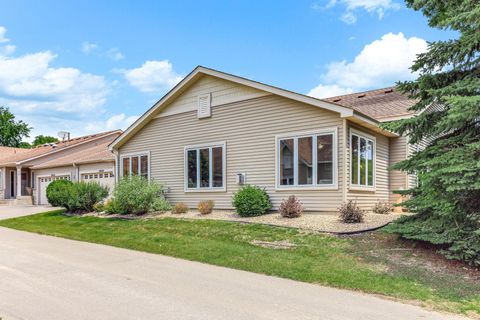
Active
$375,000
2
bds
|
2
ba
|
1,704
sqft
|
built
1999
10630 57th Pl N, Plymouth, MN 55442
$-935
Cash flow
-13.0%
Cash-on-Cash Return
2.7%
Cap rate
0.7%
Rent to Value Ratio
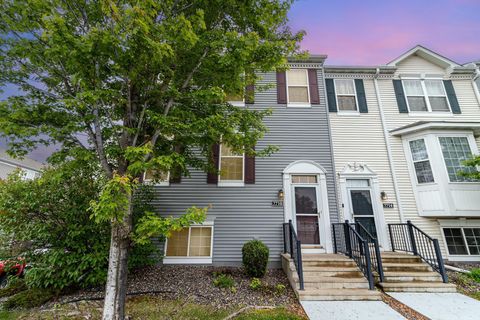
Active
$279,000
3
bds
|
3
ba
|
1,938
sqft
|
built
2004
7710 Elm Grove Ct, New Hope, MN 55428
$-409
Cash flow
-7.6%
Cash-on-Cash Return
3.9%
Cap rate
0.9%
Rent to Value Ratio
Active
$2,300,000
6
bds
|
6
ba
|
7,605
sqft
|
built
1998
4325 Trillium Ln W, Mound, MN 55364
$-9,011
Cash flow
-20.4%
Cash-on-Cash Return
1.0%
Cap rate
0.2%
Rent to Value Ratio
Active
$299,900
3
bds
|
2
ba
|
1,426
sqft
|
built
1928
4245 Welcome Ave N, Crystal, MN 55422
$-24
Cash flow
-0.4%
Cash-on-Cash Return
5.6%
Cap rate
0.8%
Rent to Value Ratio
Active
$275,000
2
bds
|
3
ba
|
1,758
sqft
|
built
2009
7308 Unity Ln N, Brooklyn Park, MN 55443
$-323
Cash flow
-6.1%
Cash-on-Cash Return
4.3%
Cap rate
0.8%
Rent to Value Ratio
Active
$509,900
2
bds
|
2
ba
|
2,095
sqft
|
built
2004
6600 Lyndale Ave S, Richfield, MN 55423
$-2,042
Cash flow
-20.9%
Cash-on-Cash Return
0.9%
Cap rate
0.6%
Rent to Value Ratio
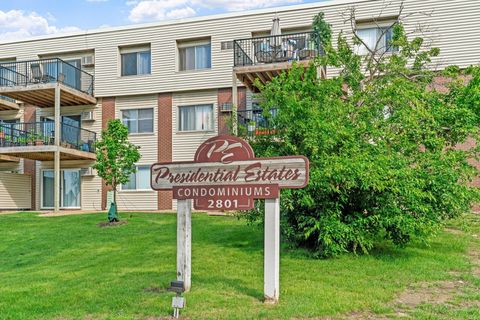
Active
$140,000
2
bds
|
2
ba
|
1,000
sqft
|
built
1970
2801 Flag Ave N, New Hope, MN 55427
$-129
Cash flow
-4.8%
Cash-on-Cash Return
4.6%
Cap rate
1.1%
Rent to Value Ratio
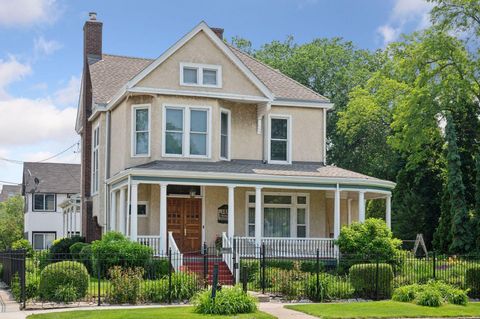
Active
$900,000
6
bds
|
5
ba
|
5,669
sqft
|
built
1889
2601 Portland Ave, Minneapolis, MN 55407
$-2,894
Cash flow
-16.8%
Cash-on-Cash Return
1.8%
Cap rate
0.3%
Rent to Value Ratio
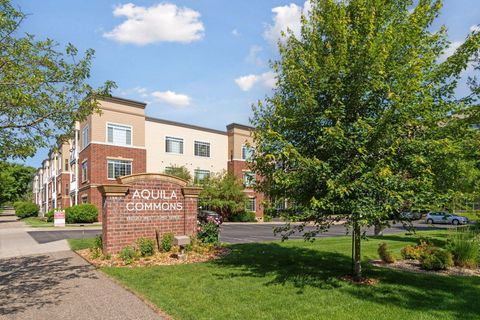
Active
$230,000
2
bds
|
2
ba
|
1,143
sqft
|
built
2007
8200 W 33rd St, Saint Louis Park, MN 55426
$-756
Cash flow
-17.1%
Cash-on-Cash Return
1.7%
Cap rate
0.9%
Rent to Value Ratio
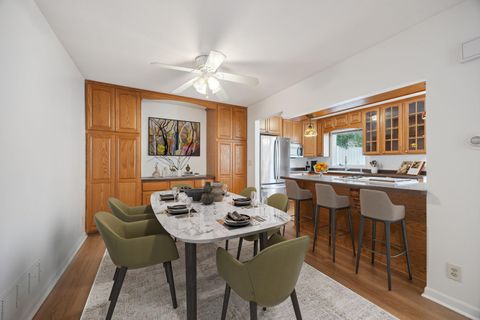
Active
$349,900
4
bds
|
4
ba
|
2,205
sqft
|
built
1975
16410 15th Ave N, Plymouth, MN 55447
$-414
Cash flow
-6.2%
Cash-on-Cash Return
4.3%
Cap rate
0.8%
Rent to Value Ratio
Active
$479,900
4
bds
|
2
ba
|
2,163
sqft
|
built
1922
4520 41st Ave S, Minneapolis, MN 55406
$-561
Cash flow
-6.1%
Cash-on-Cash Return
4.3%
Cap rate
0.6%
Rent to Value Ratio
Active
$123,000
1
bds
|
1
ba
|
704
sqft
|
built
1970
702 Old Settlers Trl, Hopkins, MN 55343
$-264
Cash flow
-11.2%
Cash-on-Cash Return
3.1%
Cap rate
0.9%
Rent to Value Ratio
Active
$479,900
4
bds
|
3
ba
|
2,378
sqft
|
built
1966
8335 W Bush Lake Rd, Bloomington, MN 55438
$-766
Cash flow
-8.3%
Cash-on-Cash Return
3.8%
Cap rate
0.6%
Rent to Value Ratio
Active
$629,900
4
bds
|
3
ba
|
2,904
sqft
|
built
1963
2611 Kyle Ave N, Golden Valley, MN 55422
$-886
Cash flow
-7.3%
Cash-on-Cash Return
4.0%
Cap rate
0.6%
Rent to Value Ratio
Active
$749,900
4
bds
|
4
ba
|
3,199
sqft
|
built
1922
3201 Xenwood Ave S, Saint Louis Park, MN 55416
$-1,867
Cash flow
-13.0%
Cash-on-Cash Return
2.7%
Cap rate
0.4%
Rent to Value Ratio
Active
$1,974,800
3
bds
|
3
ba
|
3,546
sqft
|
built
2024
1230 Greenway Pass, Golden Valley, MN 55427
$-4,803
Cash flow
-12.7%
Cash-on-Cash Return
2.8%
Cap rate
0.4%
Rent to Value Ratio
Active
$184,900
2
bds
|
1
ba
|
726
sqft
|
built
1981
7929 85th Ct N, Brooklyn Park, MN 55445
$-352
Cash flow
-9.9%
Cash-on-Cash Return
3.4%
Cap rate
0.8%
Rent to Value Ratio
Active
$1,799,000
5
bds
|
4
ba
|
4,600
sqft
|
built
1959
940 Brown Rd S, Wayzata, MN 55391
$-5,295
Cash flow
-15.4%
Cash-on-Cash Return
2.1%
Cap rate
0.3%
Rent to Value Ratio
Active
$335,000
6
bds
|
2
ba
|
5,272
sqft
|
built
1900
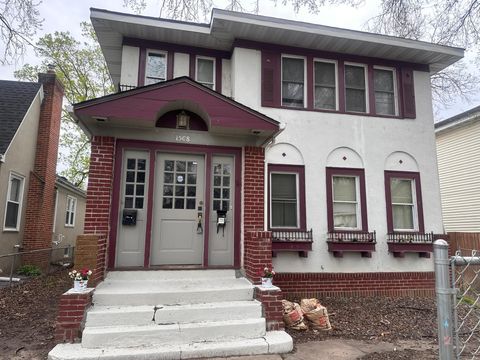
1508 Oliver Ave N, Minneapolis, MN 55411
$-743
Cash flow
-11.6%
Cash-on-Cash Return
3.0%
Cap rate
0.5%
Rent to Value Ratio
Active
$324,900
3
bds
|
1
ba
|
1,667
sqft
|
built
1913
613 W 38th St, Minneapolis, MN 55409
$-168
Cash flow
-2.7%
Cash-on-Cash Return
5.1%
Cap rate
0.7%
Rent to Value Ratio
Active
$500,000
3
bds
|
3
ba
|
2,038
sqft
|
built
1992
15655 17th Pl N, Plymouth, MN 55447
$-856
Cash flow
-8.9%
Cash-on-Cash Return
3.6%
Cap rate
0.6%
Rent to Value Ratio
Active
$534,900
3
bds
|
3
ba
|
2,743
sqft
|
built
2022
14645 Cloquet St, Dayton, MN 55327
$-734
Cash flow
-7.2%
Cash-on-Cash Return
4.0%
Cap rate
0.7%
Rent to Value Ratio
Active
$235,000
2
bds
|
1
ba
|
1,072
sqft
|
built
1916
2545 Bryant Ave S, Minneapolis, MN 55405
$-489
Cash flow
-10.9%
Cash-on-Cash Return
3.2%
Cap rate
0.8%
Rent to Value Ratio
Active
$410,000
3
bds
|
2
ba
|
1,640
sqft
|
built
1952
3025 Rhode Island Ave S, Saint Louis Park, MN 55426
$-417
Cash flow
-5.3%
Cash-on-Cash Return
4.5%
Cap rate
0.7%
Rent to Value Ratio
Active
$209,999
2
bds
|
1
ba
|
1,081
sqft
|
built
1915
1718 Clinton Ave, Minneapolis, MN 55404
$-327
Cash flow
-8.1%
Cash-on-Cash Return
3.8%
Cap rate
0.9%
Rent to Value Ratio
Active
$350,000
2
bds
|
1
ba
|
1,466
sqft
|
built
1928
730 Stinson Blvd, Minneapolis, MN 55413
$-1,111
Cash flow
-16.6%
Cash-on-Cash Return
1.9%
Cap rate
0.8%
Rent to Value Ratio
Active
$2,750,000
5
bds
|
7
ba
|
6,186
sqft
|
built
1926
4232 Fremont Ave S, Minneapolis, MN 55409
$-10,216
Cash flow
-19.4%
Cash-on-Cash Return
1.2%
Cap rate
0.3%
Rent to Value Ratio
Active
$105,000
1
bds
|
1
ba
|
660
sqft
|
built
1985
433 S 7th St, Minneapolis, MN 55415
$-320
Cash flow
-15.9%
Cash-on-Cash Return
2.0%
Cap rate
1.3%
Rent to Value Ratio
Active
$579,900
4
bds
|
2
ba
|
2,552
sqft
|
built
1924
5000 Newton Ave S, Minneapolis, MN 55419
$-1,752
Cash flow
-15.8%
Cash-on-Cash Return
2.1%
Cap rate
0.5%
Rent to Value Ratio
Active
$649,900
5
bds
|
2
ba
|
2,833
sqft
|
built
1913
2213 Nicollet Ave, Minneapolis, MN 55404
$-1,583
Cash flow
-12.7%
Cash-on-Cash Return
2.8%
Cap rate
0.4%
Rent to Value Ratio