Hennepin County Investment Properties for Sale
Browse homes for sale and investment properties in Hennepin County. Refine your search by price, property type, or more.
Best cash flowing properties in Hennepin County
Active
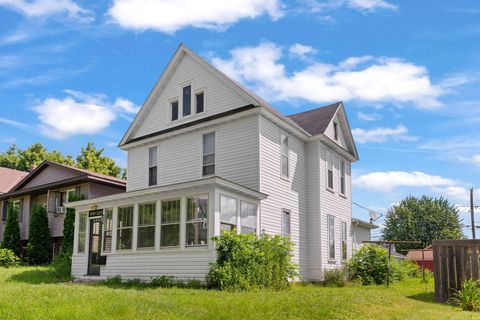
$215,000
4
bds
|
1
ba
|
1,600
sqft
|
built
1909
2114 Sheridan Ave N, Minneapolis, MN 55411
$323
Cash flow
7.8%
Cash-on-Cash Return
7.5%
Cap rate
1.1%
Rent to Value Ratio
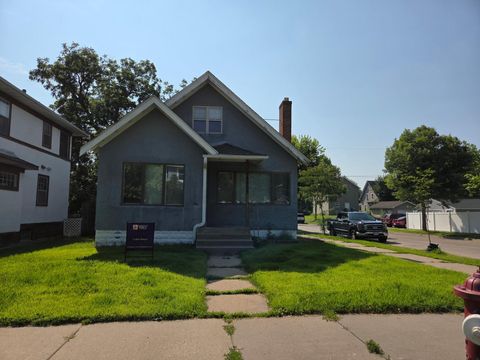
Active
$245,000
3
bds
|
1
ba
|
1,324
sqft
|
built
1928
2959 Knox Ave N, Minneapolis, MN 55411
$128
Cash flow
2.7%
Cash-on-Cash Return
6.3%
Cap rate
0.9%
Rent to Value Ratio
1,548 out of 2,082 properties for sale in Hennepin County
Limited Results Shown
Create a free account, or log in to reveal all property listings and enjoy the complete experience.
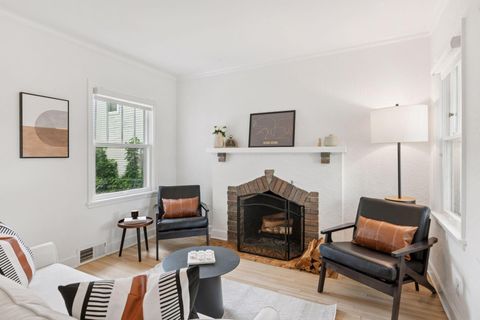
Active
$524,000
2
bds
|
2
ba
|
1,707
sqft
|
built
1930
3937 Ewing Ave S, Minneapolis, MN 55410
$-542
Cash flow
-5.4%
Cash-on-Cash Return
4.4%
Cap rate
0.7%
Rent to Value Ratio

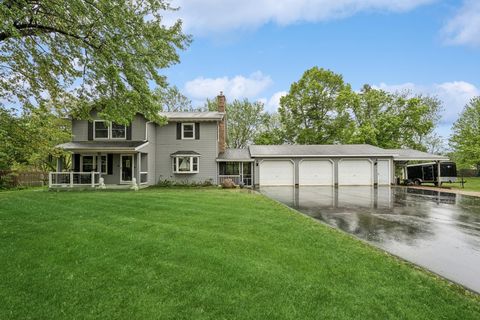
Active
$124,900
1
bds
|
1
ba
|
720
sqft
|
built
1972
6710 Vernon Ave S, Edina, MN 55436
$-139
Cash flow
-5.8%
Cash-on-Cash Return
4.3%
Cap rate
1.3%
Rent to Value Ratio
Active
$514,900
3
bds
|
2
ba
|
2,162
sqft
|
built
1950
18701 Delton Ave, Minnetonka, MN 55345
$-1,078
Cash flow
-10.9%
Cash-on-Cash Return
3.2%
Cap rate
0.5%
Rent to Value Ratio
Active
$300,000
3
bds
|
1
ba
|
1,550
sqft
|
built
1908
2112 Emerson Ave S, Minneapolis, MN 55405
$-684
Cash flow
-11.9%
Cash-on-Cash Return
2.9%
Cap rate
0.8%
Rent to Value Ratio
Active
$525,000
6
bds
|
3
ba
|
2,624
sqft
|
built
1900
735 Madison St NE, Minneapolis, MN 55413
$-1,487
Cash flow
-14.8%
Cash-on-Cash Return
2.3%
Cap rate
0.5%
Rent to Value Ratio
Active
$189,900
1
bds
|
1
ba
|
742
sqft
|
built
2006
15 E Franklin Ave, Minneapolis, MN 55404
$-366
Cash flow
-10.1%
Cash-on-Cash Return
3.4%
Cap rate
0.8%
Rent to Value Ratio
Active
$399,900
4
bds
|
1
ba
|
1,500
sqft
|
built
1918
4105 Columbus Ave, Minneapolis, MN 55407
$-702
Cash flow
-9.2%
Cash-on-Cash Return
3.6%
Cap rate
0.6%
Rent to Value Ratio

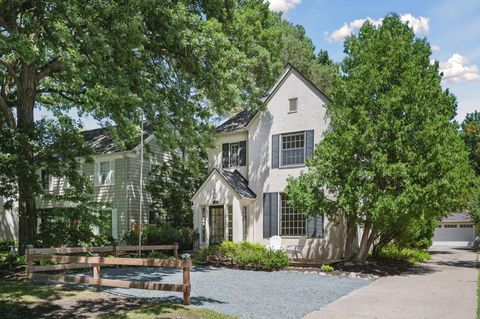
Active
$985,000
3
bds
|
3
ba
|
2,715
sqft
|
built
1916
1726 Irving Ave S, Minneapolis, MN 55403
$-2,096
Cash flow
-11.1%
Cash-on-Cash Return
3.1%
Cap rate
0.6%
Rent to Value Ratio

Active
$264,000
2
bds
|
2
ba
|
990
sqft
|
built
2005
100 Clydesdale Trl, Hamel, MN 55340
$-293
Cash flow
-5.8%
Cash-on-Cash Return
4.3%
Cap rate
0.9%
Rent to Value Ratio

Active
$2,875,000
3
bds
|
3
ba
|
2,623
sqft
|
built
2022
1111 W River Pkwy, Minneapolis, MN 55415
$-16,599
Cash flow
-30.1%
Cash-on-Cash Return
-1.2%
Cap rate
0.1%
Rent to Value Ratio
Active
$279,500
2
bds
|
2
ba
|
1,499
sqft
|
built
2002
13876 52nd Ave N, Plymouth, MN 55446
$-355
Cash flow
-6.6%
Cash-on-Cash Return
4.2%
Cap rate
0.8%
Rent to Value Ratio
Active
$260,000
2
bds
|
2
ba
|
1,268
sqft
|
built
1986
8775 Maplebrook Pkwy N, Brooklyn Park, MN 55445
$-479
Cash flow
-9.6%
Cash-on-Cash Return
3.5%
Cap rate
0.8%
Rent to Value Ratio
Active
$539,900
3
bds
|
3
ba
|
1,908
sqft
|
built
1994
8463 Zanzibar Ln N, Osseo, MN 55311
$-621
Cash flow
-6.0%
Cash-on-Cash Return
4.3%
Cap rate
0.6%
Rent to Value Ratio
Active
$599,900
3
bds
|
2
ba
|
2,287
sqft
|
built
1973
27015 123rd Ave N, Rogers, MN 55374
$-1,336
Cash flow
-11.6%
Cash-on-Cash Return
3.0%
Cap rate
0.5%
Rent to Value Ratio
Active
$750,000
4
bds
|
3
ba
|
2,800
sqft
|
built
1900
1909 E River Pkwy, Minneapolis, MN 55414
$-1,649
Cash flow
-11.5%
Cash-on-Cash Return
3.0%
Cap rate
0.5%
Rent to Value Ratio
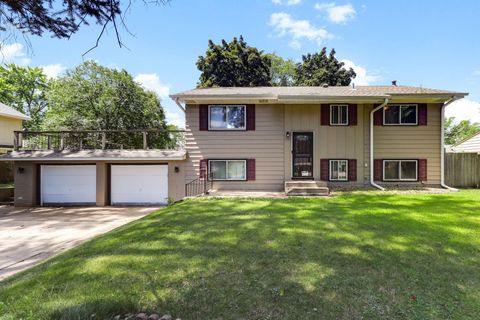
Active
$334,900
4
bds
|
2
ba
|
1,862
sqft
|
built
1963
7849 Sierra Pkwy, Brooklyn Park, MN 55444
$-171
Cash flow
-2.7%
Cash-on-Cash Return
5.1%
Cap rate
0.7%
Rent to Value Ratio
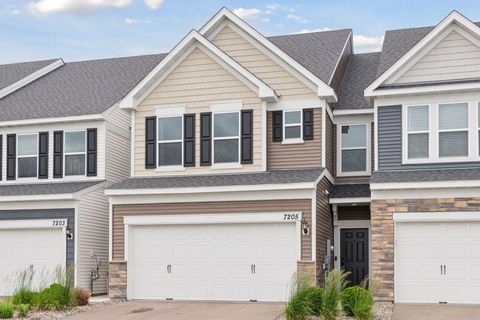
Active
$415,000
3
bds
|
3
ba
|
1,874
sqft
|
built
2022
7205 Walnut Grove Way N, Maple Grove, MN 55311
$-962
Cash flow
-12.1%
Cash-on-Cash Return
2.9%
Cap rate
0.6%
Rent to Value Ratio
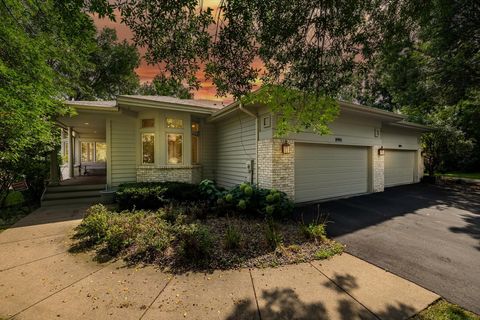
Active
$725,000
2
bds
|
3
ba
|
3,605
sqft
|
built
1990
8991 Ferndale Ln, Eden Prairie, MN 55347
$-1,883
Cash flow
-13.6%
Cash-on-Cash Return
2.6%
Cap rate
0.6%
Rent to Value Ratio
Active
$599,000
5
bds
|
3
ba
|
2,495
sqft
|
built
1968
6501 Aspen Rd, Edina, MN 55436
$-351
Cash flow
-3.1%
Cash-on-Cash Return
5.0%
Cap rate
0.6%
Rent to Value Ratio
Active
$895,000
3
bds
|
4
ba
|
2,955
sqft
|
built
2012
5782 Bartlett Blvd, Mound, MN 55364
$-2,396
Cash flow
-14.0%
Cash-on-Cash Return
2.5%
Cap rate
0.4%
Rent to Value Ratio
Active
$399,900
3
bds
|
2
ba
|
1,980
sqft
|
built
1954
11908 James Rd, Minnetonka, MN 55343
$-352
Cash flow
-4.6%
Cash-on-Cash Return
4.6%
Cap rate
0.7%
Rent to Value Ratio
Active
$569,000
2
bds
|
2
ba
|
1,353
sqft
|
built
2006
100 3rd Ave S, Minneapolis, MN 55401
$-2,022
Cash flow
-18.5%
Cash-on-Cash Return
1.4%
Cap rate
0.6%
Rent to Value Ratio
Active
$374,900
4
bds
|
2
ba
|
1,850
sqft
|
built
1987
12769 88th Ave N, Maple Grove, MN 55369
$-147
Cash flow
-2.0%
Cash-on-Cash Return
5.2%
Cap rate
0.8%
Rent to Value Ratio
Active
$2,295,000
4
bds
|
4
ba
|
3,579
sqft
|
built
2025
4513 Laguna Dr, Edina, MN 55435
$-9,796
Cash flow
-22.3%
Cash-on-Cash Return
0.6%
Cap rate
0.1%
Rent to Value Ratio
Active
$750,000
2
bds
|
1
ba
|
1,212
sqft
|
built
1924
3046 Julia Way, Mound, MN 55364
$-2,015
Cash flow
-14.0%
Cash-on-Cash Return
2.5%
Cap rate
0.4%
Rent to Value Ratio
Active
$365,000
4
bds
|
2
ba
|
2,032
sqft
|
built
1900
2628 14th Ave S, Minneapolis, MN 55407
$-209
Cash flow
-3.0%
Cash-on-Cash Return
5.0%
Cap rate
0.6%
Rent to Value Ratio
Active
$600,000
3
bds
|
3
ba
|
2,449
sqft
|
built
1991
7040 Ximines Ln N, Maple Grove, MN 55369
$-912
Cash flow
-7.9%
Cash-on-Cash Return
3.9%
Cap rate
0.6%
Rent to Value Ratio
Active
$109,000
1
bds
|
1
ba
|
525
sqft
|
built
1970
3729 Snelling Ave, Minneapolis, MN 55406
$-70
Cash flow
-3.4%
Cash-on-Cash Return
4.9%
Cap rate
1.2%
Rent to Value Ratio
Active
$619,900
4
bds
|
3
ba
|
3,000
sqft
|
built
1900
2742 Dupont Ave S, Minneapolis, MN 55408
$-1,048
Cash flow
-8.8%
Cash-on-Cash Return
3.7%
Cap rate
0.6%
Rent to Value Ratio
Active
$249,000
3
bds
|
2
ba
|
1,486
sqft
|
built
1975
10411 Cedar Lake Rd, Minnetonka, MN 55305
$-665
Cash flow
-13.9%
Cash-on-Cash Return
2.5%
Cap rate
0.8%
Rent to Value Ratio

Active
$434,900
6
bds
|
3
ba
|
3,063
sqft
|
built
1900
709 7th St SE, Minneapolis, MN 55414
$-324
Cash flow
-3.9%
Cash-on-Cash Return
4.8%
Cap rate
0.7%
Rent to Value Ratio
Active
$84,900
1
bds
|
1
ba
|
671
sqft
|
built
1965
1405 E 40th St, Minneapolis, MN 55407
$-30
Cash flow
-1.8%
Cash-on-Cash Return
5.3%
Cap rate
1.5%
Rent to Value Ratio

Active
$349,000
3
bds
|
2
ba
|
1,642
sqft
|
built
1953
417 4th St NE, Osseo, MN 55369
$-263
Cash flow
-3.9%
Cash-on-Cash Return
4.8%
Cap rate
0.7%
Rent to Value Ratio
Active
$1,995,000
4
bds
|
4
ba
|
4,296
sqft
|
built
1929
5300 Piper Rd, Mound, MN 55364
$-7,290
Cash flow
-19.1%
Cash-on-Cash Return
1.3%
Cap rate
0.2%
Rent to Value Ratio
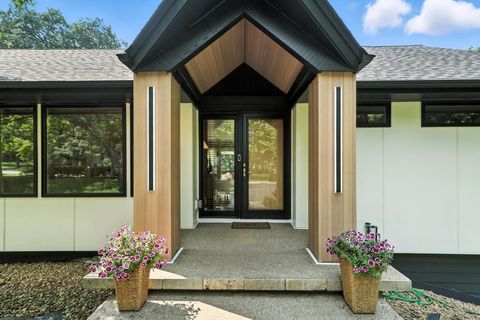
Active
$429,900
3
bds
|
2
ba
|
1,944
sqft
|
built
1978
9865 Garrison Way, Eden Prairie, MN 55347
$-480
Cash flow
-5.8%
Cash-on-Cash Return
4.3%
Cap rate
0.7%
Rent to Value Ratio
Active
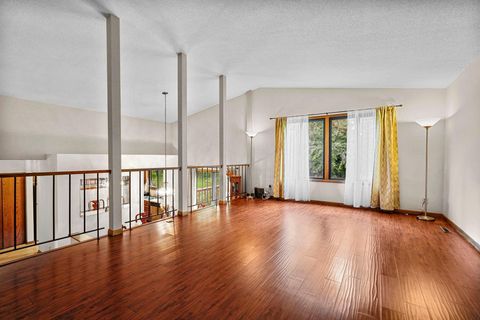
$1,299,000
5
bds
|
3
ba
|
3,688
sqft
|
built
1996
16515 Hilltop Ter, Minnetonka, MN 55345
$-2,697
Cash flow
-10.8%
Cash-on-Cash Return
3.2%
Cap rate
0.4%
Rent to Value Ratio
Active
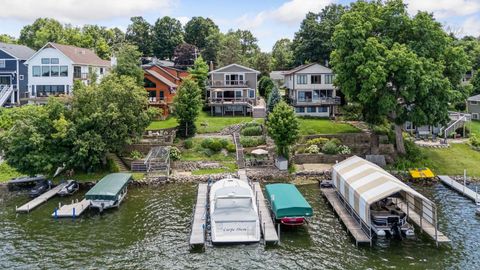
$599,000
4
bds
|
4
ba
|
4,307
sqft
|
built
1980
2901 Hazelwood Ln, Mound, MN 55364
$-1,672
Cash flow
-14.6%
Cash-on-Cash Return
2.3%
Cap rate
0.4%
Rent to Value Ratio
Active
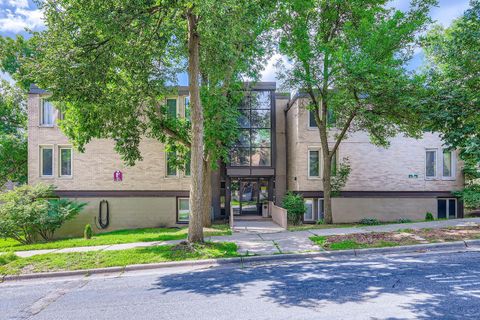
$185,000
2
bds
|
2
ba
|
996
sqft
|
built
1964
6301 Barrie Rd, Edina, MN 55435
$-287
Cash flow
-8.1%
Cash-on-Cash Return
3.8%
Cap rate
1.0%
Rent to Value Ratio