Hennepin County Investment Properties for Sale
Browse homes for sale and investment properties in Hennepin County. Refine your search by price, property type, or more.
Best cash flowing properties in Hennepin County
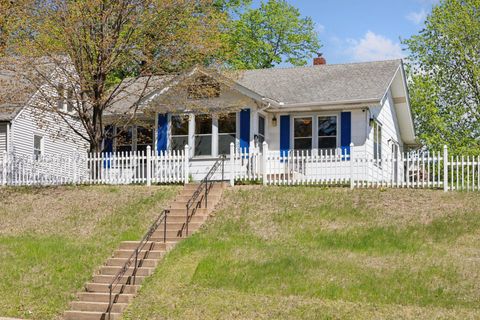
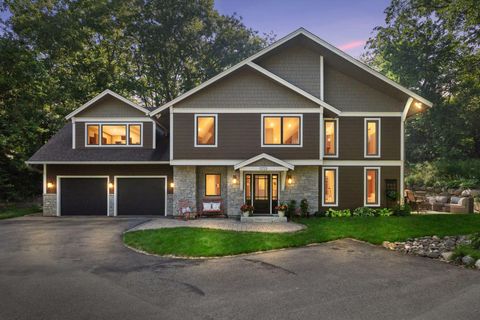
Active
$349,900
3
bds
|
2
ba
|
1,645
sqft
|
built
1946
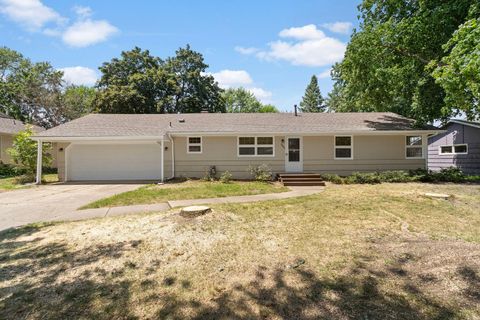
7545 Blaisdell Ave, Richfield, MN 55423
$-4
Cash flow
-0.1%
Cash-on-Cash Return
5.7%
Cap rate
0.9%
Rent to Value Ratio
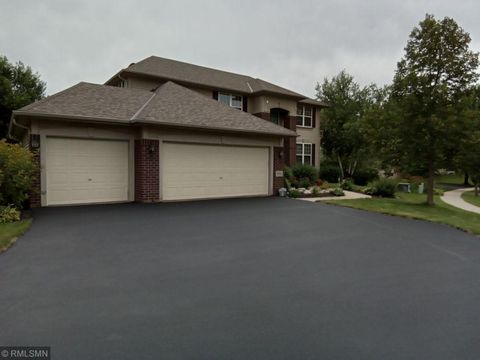
Active
$295,000
2
bds
|
2
ba
|
1,169
sqft
|
built
1982
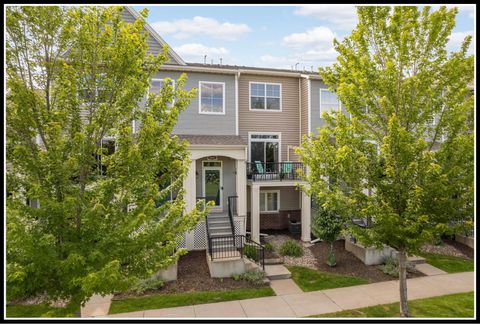
8983 Vinewood Ln N, Maple Grove, MN 55369
$-134
Cash flow
-2.4%
Cash-on-Cash Return
5.1%
Cap rate
0.8%
Rent to Value Ratio
1,548 out of 2,082 properties for sale in Hennepin County
Limited Results Shown
Create a free account, or log in to reveal all property listings and enjoy the complete experience.
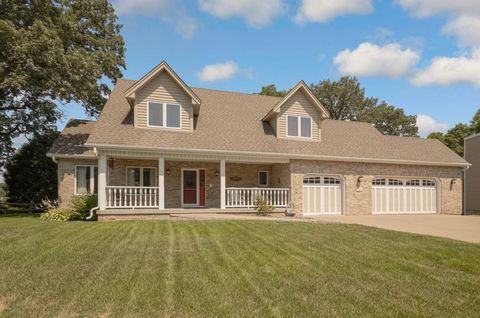
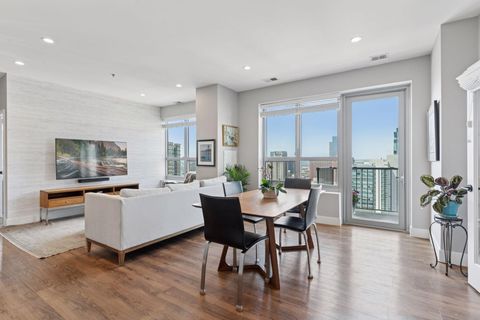
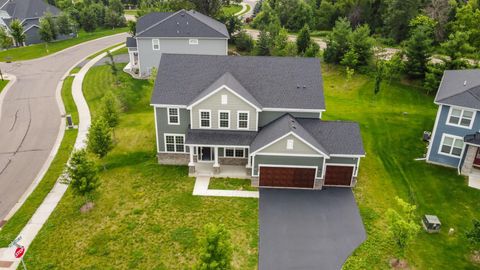
Active
$924,900
5
bds
|
4
ba
|
4,115
sqft
|
built
1984
14451 Wellington Rd, Wayzata, MN 55391
$-2,633
Cash flow
-14.9%
Cash-on-Cash Return
2.3%
Cap rate
0.4%
Rent to Value Ratio
Active
$6,900,000
6
bds
|
6
ba
|
7,181
sqft
|
built
1903
2462 Lafayette Rd, Wayzata, MN 55391
$-31,404
Cash flow
-23.7%
Cash-on-Cash Return
0.2%
Cap rate
0.1%
Rent to Value Ratio
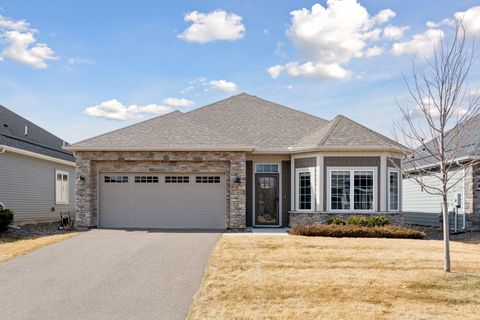
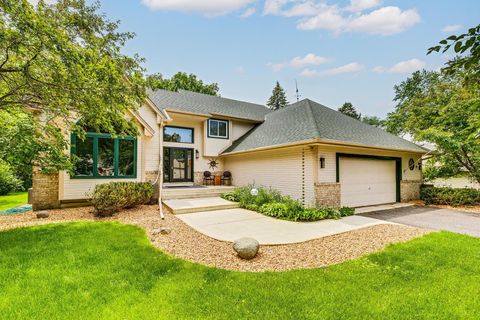
Active
$375,000
3
bds
|
3
ba
|
1,972
sqft
|
built
2011
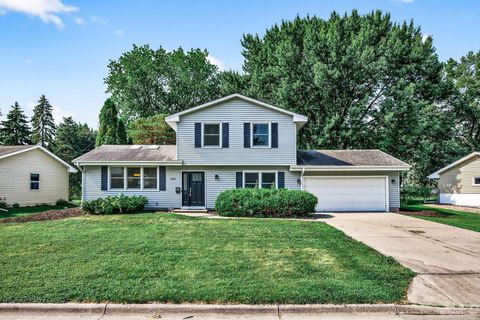
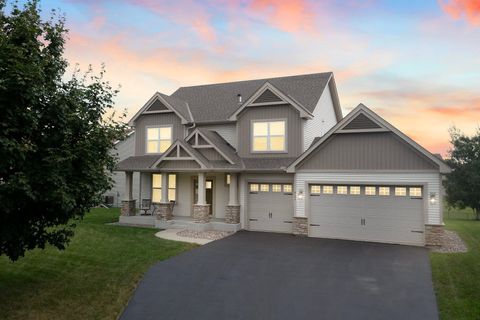
8065 Kirkwood Ln N, Maple Grove, MN 55369
$-556
Cash flow
-7.7%
Cash-on-Cash Return
3.9%
Cap rate
0.7%
Rent to Value Ratio
Active
$449,900
4
bds
|
3
ba
|
2,009
sqft
|
built
1957
10212 Xerxes Ave S, Bloomington, MN 55431
$-382
Cash flow
-4.4%
Cash-on-Cash Return
4.7%
Cap rate
0.7%
Rent to Value Ratio
Active
$395,000
4
bds
|
2
ba
|
1,417
sqft
|
built
1967
9225 Northwood Pkwy, New Hope, MN 55427
$-372
Cash flow
-4.9%
Cash-on-Cash Return
4.5%
Cap rate
0.7%
Rent to Value Ratio
Active
$279,900
1
bds
|
1
ba
|
854
sqft
|
built
1922
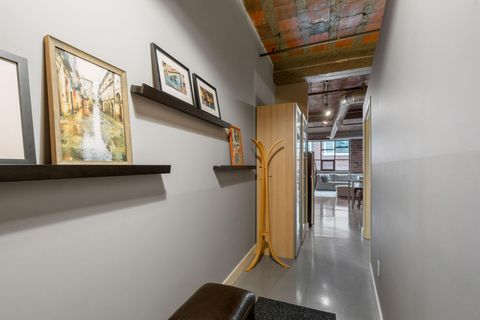
718 Washington Ave N, Minneapolis, MN 55401
$-324
Cash flow
-6.0%
Cash-on-Cash Return
4.3%
Cap rate
0.8%
Rent to Value Ratio
Active
$340,000
4
bds
|
2
ba
|
1,815
sqft
|
built
1968
11525 Wisconsin Ave N, Champlin, MN 55316
$-207
Cash flow
-3.2%
Cash-on-Cash Return
4.9%
Cap rate
0.7%
Rent to Value Ratio
Active
$700,000
5
bds
|
4
ba
|
3,212
sqft
|
built
1966
10325 10th Avenue Cir S, Minneapolis, MN 55420
$-1,372
Cash flow
-10.2%
Cash-on-Cash Return
3.3%
Cap rate
0.5%
Rent to Value Ratio
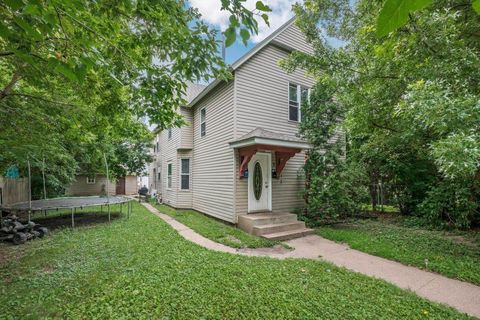
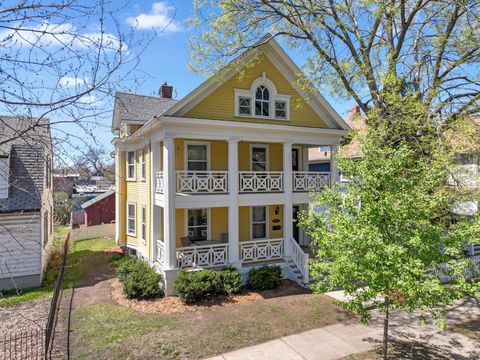
Active
$359,000
6
bds
|
3
ba
|
2,298
sqft
|
built
1900
1912 Columbus Ave, Minneapolis, MN 55404
$-886
Cash flow
-12.9%
Cash-on-Cash Return
2.7%
Cap rate
0.5%
Rent to Value Ratio

Active
$7,990,000
5
bds
|
7
ba
|
8,930
sqft
|
built
2018
2505 E Lake Of The Isles Pkwy, Minneapolis, MN 55405
$-38,346
Cash flow
-25.0%
Cash-on-Cash Return
-0.1%
Cap rate
0.1%
Rent to Value Ratio
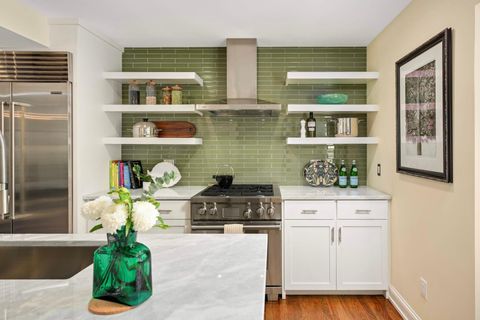
Active
$449,900
3
bds
|
3
ba
|
2,336
sqft
|
built
2020
6921 Huckleberry Dr, Excelsior, MN 55331
$-481
Cash flow
-5.6%
Cash-on-Cash Return
4.4%
Cap rate
0.7%
Rent to Value Ratio
Active
$1,525,000
5
bds
|
5
ba
|
6,167
sqft
|
built
2005
6294 Bluestem Rd S, Hamel, MN 55340
$-5,055
Cash flow
-17.3%
Cash-on-Cash Return
1.7%
Cap rate
0.3%
Rent to Value Ratio
Active
$525,000
4
bds
|
4
ba
|
2,713
sqft
|
built
2012
4584 Merganser Dr, Saint Bonifacius, MN 55375
$-731
Cash flow
-7.3%
Cash-on-Cash Return
4.0%
Cap rate
0.6%
Rent to Value Ratio
Active
$1,795,000
5
bds
|
5
ba
|
4,954
sqft
|
built
2025
6133 Chowen Ave S, Edina, MN 55410
$-6,562
Cash flow
-19.1%
Cash-on-Cash Return
1.3%
Cap rate
0.2%
Rent to Value Ratio
Active
$480,000
4
bds
|
2
ba
|
2,029
sqft
|
built
1977
19720 Jackie Ln, Rogers, MN 55374
$-662
Cash flow
-7.2%
Cash-on-Cash Return
4.0%
Cap rate
0.6%
Rent to Value Ratio
Active
$399,900
2
bds
|
3
ba
|
1,606
sqft
|
built
2006
2828 Aldrich Ave S, Minneapolis, MN 55408
$-862
Cash flow
-11.2%
Cash-on-Cash Return
3.1%
Cap rate
0.8%
Rent to Value Ratio
Active
$1,195,000
4
bds
|
4
ba
|
3,101
sqft
|
built
1963
5 S Brown Rd, Long Lake, MN 55356
$-2,115
Cash flow
-9.2%
Cash-on-Cash Return
3.6%
Cap rate
0.5%
Rent to Value Ratio
Active
$505,900
3
bds
|
3
ba
|
2,103
sqft
|
built
2006
10025 Toledo Dr N, Brooklyn Park, MN 55443
$-1,066
Cash flow
-11.0%
Cash-on-Cash Return
3.2%
Cap rate
0.6%
Rent to Value Ratio
Active
$370,000
2
bds
|
2
ba
|
1,736
sqft
|
built
1999
13019 Brookside Ln N, Rogers, MN 55374
$-368
Cash flow
-5.2%
Cash-on-Cash Return
4.5%
Cap rate
0.7%
Rent to Value Ratio
Active
$850,000
4
bds
|
4
ba
|
5,744
sqft
|
built
2000
17397 73rd Pl N, Osseo, MN 55311
$-2,110
Cash flow
-13.0%
Cash-on-Cash Return
2.7%
Cap rate
0.5%
Rent to Value Ratio

Active
$895,000
4
bds
|
5
ba
|
2,582
sqft
|
built
1938
5446 Bartlett Blvd, Mound, MN 55364
$-1,940
Cash flow
-11.3%
Cash-on-Cash Return
3.1%
Cap rate
0.5%
Rent to Value Ratio
Active
$389,995
4
bds
|
3
ba
|
2,105
sqft
|
built
1982
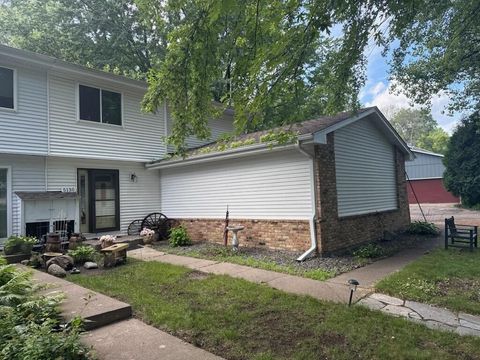
5130 Clear Spring Rd, Minnetonka, MN 55345
$-457
Cash flow
-6.1%
Cash-on-Cash Return
4.3%
Cap rate
0.6%
Rent to Value Ratio
Active
$2,395,000
5
bds
|
5
ba
|
7,877
sqft
|
built
2004
130 Bergamot Dr, Medina, MN 55340
$-9,067
Cash flow
-19.8%
Cash-on-Cash Return
1.1%
Cap rate
0.3%
Rent to Value Ratio
Active
$899,000
4
bds
|
3
ba
|
3,110
sqft
|
built
1977
3900 Hillcrest Way, Wayzata, MN 55391
$-2,449
Cash flow
-14.2%
Cash-on-Cash Return
2.4%
Cap rate
0.4%
Rent to Value Ratio
Active
$1,199,000
3
bds
|
3
ba
|
3,233
sqft
|
built
1965
220 Glenbrook Rd N, Wayzata, MN 55391
$-3,070
Cash flow
-13.4%
Cash-on-Cash Return
2.6%
Cap rate
0.4%
Rent to Value Ratio

Active
$949,000
3
bds
|
2
ba
|
2,160
sqft
|
built
2009
222 2nd St SE, Minneapolis, MN 55414
$-5,464
Cash flow
-30.0%
Cash-on-Cash Return
-1.2%
Cap rate
0.3%
Rent to Value Ratio
Active
$285,000
4
bds
|
2
ba
|
2,170
sqft
|
built
1895
4111 Bryant Ave N, Minneapolis, MN 55412
$-312
Cash flow
-5.7%
Cash-on-Cash Return
4.4%
Cap rate
0.8%
Rent to Value Ratio
Active
$750,000
5
bds
|
4
ba
|
3,923
sqft
|
built
1991
251 Revere Ln N, Champlin, MN 55316
$-1,519
Cash flow
-10.6%
Cash-on-Cash Return
3.2%
Cap rate
0.5%
Rent to Value Ratio
Active
$595,000
1
bds
|
2
ba
|
1,875
sqft
|
built
1978
28 Greenway Gables, Minneapolis, MN 55403
$-724
Cash flow
-6.3%
Cash-on-Cash Return
4.2%
Cap rate
0.8%
Rent to Value Ratio
Active
$435,000
2
bds
|
2
ba
|
1,463
sqft
|
built
1915
5153 Penn Ave S, Minneapolis, MN 55419
$-707
Cash flow
-8.5%
Cash-on-Cash Return
3.7%
Cap rate
0.7%
Rent to Value Ratio
Active
$860,000
4
bds
|
4
ba
|
3,197
sqft
|
built
1982
3715 Huntingdon Dr, Minnetonka, MN 55305
$-2,562
Cash flow
-15.5%
Cash-on-Cash Return
2.1%
Cap rate
0.4%
Rent to Value Ratio
Active
$760,000
4
bds
|
3
ba
|
3,200
sqft
|
built
2005
6640 Fountain Ct N, Osseo, MN 55311
$-1,519
Cash flow
-10.4%
Cash-on-Cash Return
3.3%
Cap rate
0.5%
Rent to Value Ratio
Active
$450,000
2
bds
|
2
ba
|
1,366
sqft
|
built
2006
929 Portland Ave, Minneapolis, MN 55404
$-2,480
Cash flow
-28.8%
Cash-on-Cash Return
-0.9%
Cap rate
0.4%
Rent to Value Ratio
Active
$545,000
2
bds
|
2
ba
|
1,890
sqft
|
built
2018
7461 Fir Ln N, Hamel, MN 55340
$-1,080
Cash flow
-10.3%
Cash-on-Cash Return
3.3%
Cap rate
0.6%
Rent to Value Ratio
Active
$861,000
5
bds
|
3
ba
|
3,146
sqft
|
built
2021
5390 Everest Ln N, Plymouth, MN 55446
$-2,137
Cash flow
-12.9%
Cash-on-Cash Return
2.7%
Cap rate
0.5%
Rent to Value Ratio

Active
$1,345,000
3
bds
|
3
ba
|
2,201
sqft
|
built
1973
4832 Longford Rd, Mound, MN 55364
$-4,716
Cash flow
-18.3%
Cash-on-Cash Return
1.5%
Cap rate
0.3%
Rent to Value Ratio
Active
$539,900
6
bds
|
2
ba
|
2,632
sqft
|
built
1909
2724 Garfield Ave, Minneapolis, MN 55408
$-1,651
Cash flow
-16.0%
Cash-on-Cash Return
2.0%
Cap rate
0.4%
Rent to Value Ratio
Active
$479,900
4
bds
|
3
ba
|
2,440
sqft
|
built
1990
201 75th Ave N, Brooklyn Park, MN 55444
$-616
Cash flow
-6.7%
Cash-on-Cash Return
4.1%
Cap rate
0.6%
Rent to Value Ratio