Hennepin County Investment Properties for Sale
Browse homes for sale and investment properties in Hennepin County. Refine your search by price, property type, or more.
Best cash flowing properties in Hennepin County
Active
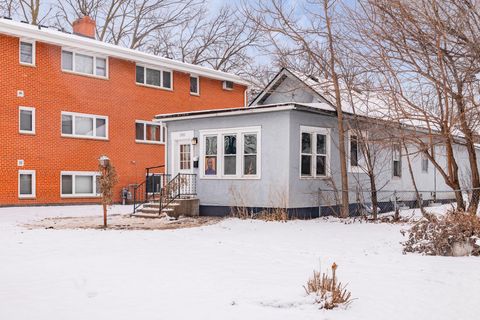
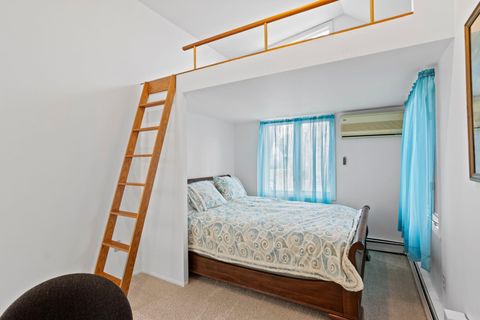
$229,900
2
bds
|
1
ba
|
956
sqft
|
built
1900
2928 34th Ave S, Minneapolis, MN 55406
$-67
Cash flow
-1.5%
Cash-on-Cash Return
5.3%
Cap rate
0.8%
Rent to Value Ratio

Active
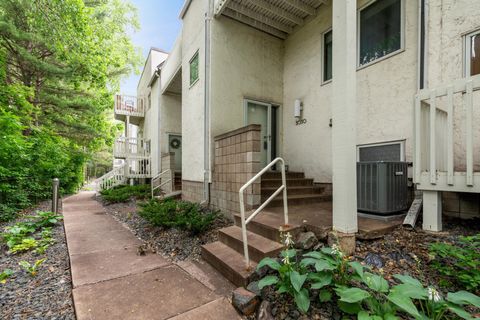
$119,900
1
bds
|
1
ba
|
707
sqft
|
built
1968
6400 York Ave S, Edina, MN 55435
$-108
Cash flow
-4.7%
Cash-on-Cash Return
4.6%
Cap rate
1.4%
Rent to Value Ratio
2,038 out of 3,101 properties for sale in Hennepin County
Limited Results Shown
Create a free account, or log in to reveal all property listings and enjoy the complete experience.
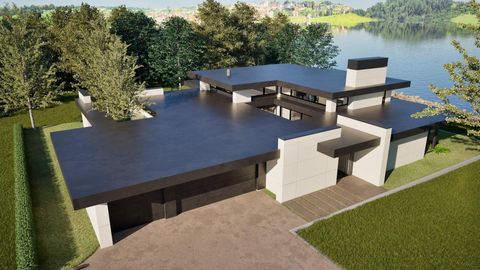
Active
$4,895,000
3
bds
|
4
ba
|
3,713
sqft
|
built
2025
4330 Manitou Rd, Excelsior, MN 55331
$-21,102
Cash flow
-22.5%
Cash-on-Cash Return
0.5%
Cap rate
0.1%
Rent to Value Ratio
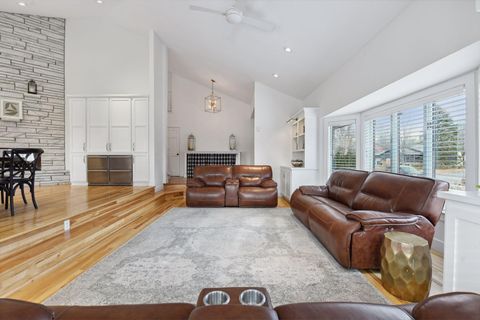
Active
$997,777
5
bds
|
5
ba
|
6,123
sqft
|
built
1985
4335 Kirkwood Ln N, Plymouth, MN 55442
$-2,716
Cash flow
-14.2%
Cash-on-Cash Return
2.4%
Cap rate
0.4%
Rent to Value Ratio

Active
$2,096,000
5
bds
|
5
ba
|
4,781
sqft
|
built
2024
6008 Oaklawn Ave, Edina, MN 55424
$-4,093
Cash flow
-10.2%
Cash-on-Cash Return
3.3%
Cap rate
0.4%
Rent to Value Ratio
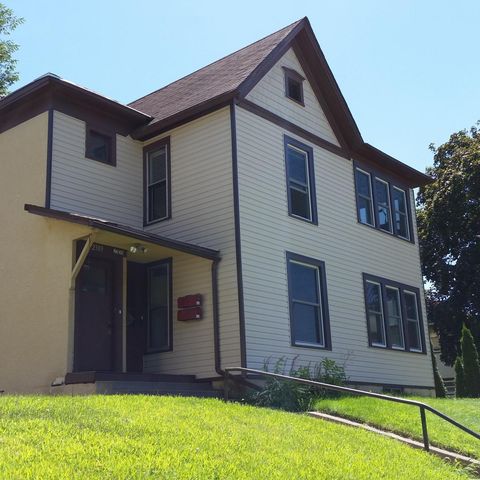
Active
$449,900
6
bds
|
2
ba
|
2,474
sqft
|
built
1900
2309 Buchanan St NE, Minneapolis, MN 55418
$-1,260
Cash flow
-14.6%
Cash-on-Cash Return
2.3%
Cap rate
0.5%
Rent to Value Ratio
Active
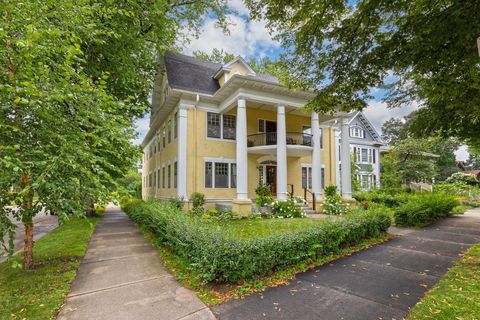
$399,900
2
bds
|
1
ba
|
1,000
sqft
|
built
1910
2101 Newton Ave S, Minneapolis, MN 55405
$-1,245
Cash flow
-16.2%
Cash-on-Cash Return
1.9%
Cap rate
0.6%
Rent to Value Ratio
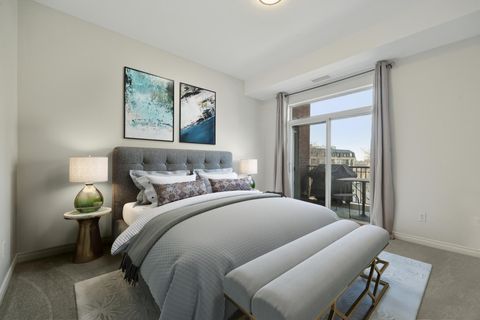
Active
$365,000
2
bds
|
2
ba
|
1,920
sqft
|
built
1984
3030 Lake Shore Dr, Minneapolis, MN 55416
$-1,002
Cash flow
-14.3%
Cash-on-Cash Return
2.4%
Cap rate
0.7%
Rent to Value Ratio

Active
$315,000
2
bds
|
2
ba
|
1,338
sqft
|
built
1964
6417 Colony Way, Edina, MN 55435
$-713
Cash flow
-11.8%
Cash-on-Cash Return
3.0%
Cap rate
0.8%
Rent to Value Ratio
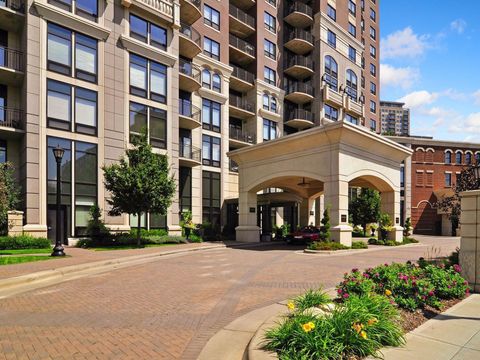
Active
$330,000
2
bds
|
2
ba
|
1,214
sqft
|
built
2003
301 Clifton Ave, Minneapolis, MN 55403
$-1,147
Cash flow
-18.1%
Cash-on-Cash Return
1.5%
Cap rate
0.7%
Rent to Value Ratio
Active
$725,000
2
bds
|
3
ba
|
1,942
sqft
|
built
2004
500 E Grant St, Minneapolis, MN 55404
$-2,203
Cash flow
-15.9%
Cash-on-Cash Return
2.0%
Cap rate
0.6%
Rent to Value Ratio
Active
$3,650,000
5
bds
|
7
ba
|
10,321
sqft
|
built
1998
781 Ferndale Rd N, Wayzata, MN 55391
$-14,335
Cash flow
-20.5%
Cash-on-Cash Return
1.0%
Cap rate
0.2%
Rent to Value Ratio

Active
$149,900
1
bds
|
1
ba
|
840
sqft
|
built
1975
10401 Cedar Lake Rd, Minnetonka, MN 55305
$-154
Cash flow
-5.4%
Cash-on-Cash Return
4.4%
Cap rate
1.0%
Rent to Value Ratio
Active
$599,900
4
bds
|
4
ba
|
2,818
sqft
|
built
1913
2735 Garfield Ave, Minneapolis, MN 55408
$-2,266
Cash flow
-19.7%
Cash-on-Cash Return
1.1%
Cap rate
0.3%
Rent to Value Ratio
Active
$385,000
2
bds
|
3
ba
|
1,424
sqft
|
built
2006
2828 Aldrich Ave S, Minneapolis, MN 55408
$-608
Cash flow
-8.2%
Cash-on-Cash Return
3.8%
Cap rate
0.8%
Rent to Value Ratio

Active
$545,000
3
bds
|
2
ba
|
1,553
sqft
|
built
1948
4500 Parkside Ln, Edina, MN 55436
$-1,013
Cash flow
-9.7%
Cash-on-Cash Return
3.4%
Cap rate
0.5%
Rent to Value Ratio
Active
$87,000
2
bds
|
1
ba
|
730
sqft
|
built
1891
1801 Elliot Ave, Minneapolis, MN 55404
$-649
Cash flow
-38.9%
Cash-on-Cash Return
-3.3%
Cap rate
1.3%
Rent to Value Ratio
Active
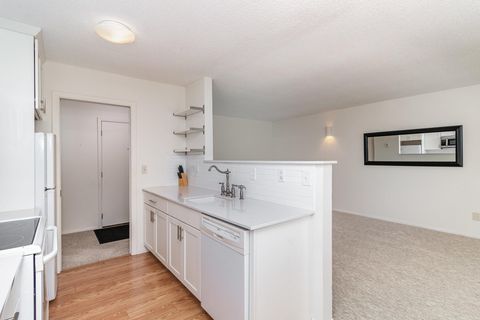
$119,900
1
bds
|
1
ba
|
707
sqft
|
built
1968
6400 York Ave S, Edina, MN 55435
$-108
Cash flow
-4.7%
Cash-on-Cash Return
4.6%
Cap rate
1.4%
Rent to Value Ratio
Active
$325,000
2
bds
|
1
ba
|
1,143
sqft
|
built
1989
401 S 1st St, Minneapolis, MN 55401
$-752
Cash flow
-12.1%
Cash-on-Cash Return
2.9%
Cap rate
0.9%
Rent to Value Ratio
Active
$1,395,000
4
bds
|
4
ba
|
3,459
sqft
|
built
2013
297 Glenbrook Rd N, Wayzata, MN 55391
$-4,868
Cash flow
-18.2%
Cash-on-Cash Return
1.5%
Cap rate
0.3%
Rent to Value Ratio
Active
$824,995
5
bds
|
4
ba
|
4,224
sqft
|
built
2008
11338 Parkside Trl, Maple Grove, MN 55369
$-1,073
Cash flow
-6.8%
Cash-on-Cash Return
4.1%
Cap rate
0.6%
Rent to Value Ratio

Active
$199,500
2
bds
|
2
ba
|
1,220
sqft
|
built
1984
3801 W 98th St, Bloomington, MN 55431
$-304
Cash flow
-8.0%
Cash-on-Cash Return
3.8%
Cap rate
1.0%
Rent to Value Ratio
Active
$355,000
2
bds
|
2
ba
|
1,334
sqft
|
built
2004
500 E Grant St, Minneapolis, MN 55404
$-1,183
Cash flow
-17.4%
Cash-on-Cash Return
1.7%
Cap rate
0.8%
Rent to Value Ratio
Active
$229,900
2
bds
|
1
ba
|
956
sqft
|
built
1900
2928 34th Ave S, Minneapolis, MN 55406
$-67
Cash flow
-1.5%
Cash-on-Cash Return
5.3%
Cap rate
0.8%
Rent to Value Ratio

Active
$130,000
1
bds
|
1
ba
|
854
sqft
|
built
1966
6450 York Ave S, Edina, MN 55435
$-176
Cash flow
-7.1%
Cash-on-Cash Return
4.1%
Cap rate
1.3%
Rent to Value Ratio
Active
$157,500
1
bds
|
1
ba
|
680
sqft
|
built
2004
111 E Franklin Ave, Minneapolis, MN 55404
$-432
Cash flow
-14.3%
Cash-on-Cash Return
2.4%
Cap rate
0.9%
Rent to Value Ratio
Active
$899,000
4
bds
|
5
ba
|
3,939
sqft
|
built
1991
4790 Bayswater Rd, Excelsior, MN 55331
$-2,778
Cash flow
-16.1%
Cash-on-Cash Return
2.0%
Cap rate
0.4%
Rent to Value Ratio
Active
$119,900
2
bds
|
2
ba
|
1,150
sqft
|
built
1972
7520 Cahill Rd, Edina, MN 55439
$-304
Cash flow
-13.2%
Cash-on-Cash Return
2.6%
Cap rate
1.7%
Rent to Value Ratio
Active
$539,000
1
bds
|
2
ba
|
1,754
sqft
|
built
1913
801 Washington Ave N, Minneapolis, MN 55401
$-1,367
Cash flow
-13.2%
Cash-on-Cash Return
2.6%
Cap rate
0.6%
Rent to Value Ratio

Active
$3,600,000
6
bds
|
5
ba
|
5,898
sqft
|
built
1984
2070 Shoreline Dr, Wayzata, MN 55391
$-12,167
Cash flow
-17.6%
Cash-on-Cash Return
1.6%
Cap rate
0.3%
Rent to Value Ratio
Active
$1,795,000
5
bds
|
5
ba
|
4,976
sqft
|
built
1994
2314 Old Beach Rd, Wayzata, MN 55391
$-3,617
Cash flow
-10.5%
Cash-on-Cash Return
3.3%
Cap rate
0.5%
Rent to Value Ratio

Active
$1,369,000
4
bds
|
3
ba
|
4,325
sqft
|
built
1969
1875 Troy Ln N, Plymouth, MN 55447
$-2,518
Cash flow
-9.6%
Cash-on-Cash Return
3.5%
Cap rate
0.5%
Rent to Value Ratio
Active
$1,249,900
4
bds
|
4
ba
|
3,312
sqft
|
built
2013
5613 Abbott Ave S, Edina, MN 55410
$-2,833
Cash flow
-11.8%
Cash-on-Cash Return
3.0%
Cap rate
0.5%
Rent to Value Ratio
Active
$699,000
4
bds
|
3
ba
|
2,077
sqft
|
built
1927
3515 W 22nd St, Minneapolis, MN 55416
$-1,033
Cash flow
-7.7%
Cash-on-Cash Return
3.9%
Cap rate
0.6%
Rent to Value Ratio

Active
$695,000
4
bds
|
3
ba
|
2,600
sqft
|
built
1978
2805 Alvarado Ln N, Plymouth, MN 55447
$-1,333
Cash flow
-10.0%
Cash-on-Cash Return
3.4%
Cap rate
0.5%
Rent to Value Ratio
Active
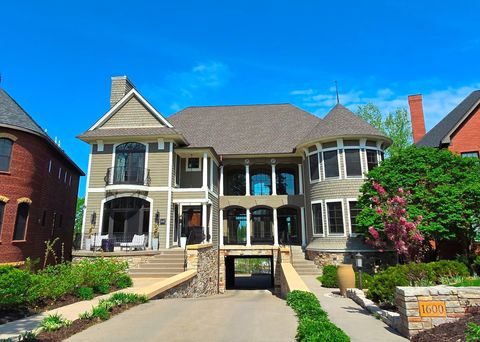
$1,140,000
3
bds
|
4
ba
|
3,460
sqft
|
built
2002
1600 Kenwood Pkwy, Minneapolis, MN 55405
$-3,285
Cash flow
-15.0%
Cash-on-Cash Return
2.2%
Cap rate
0.5%
Rent to Value Ratio
Active
$1,345,000
4
bds
|
5
ba
|
5,584
sqft
|
built
2006
9730 Sky Ln, Eden Prairie, MN 55347
$-2,395
Cash flow
-9.3%
Cash-on-Cash Return
3.5%
Cap rate
0.6%
Rent to Value Ratio

Active
$2,290,000
4
bds
|
3
ba
|
3,320
sqft
|
built
2016
1990 Shadywood Rd, Wayzata, MN 55391
$-6,297
Cash flow
-14.3%
Cash-on-Cash Return
2.4%
Cap rate
0.4%
Rent to Value Ratio

Active
$315,000
2
bds
|
2
ba
|
1,592
sqft
|
built
1986
4550 Minnetonka Blvd, Saint Louis Park, MN 55416
$-432
Cash flow
-7.2%
Cash-on-Cash Return
4.0%
Cap rate
0.9%
Rent to Value Ratio
Active
$137,500
2
bds
|
2
ba
|
1,010
sqft
|
built
1970
10113 W 34th St, Hopkins, MN 55305
$-455
Cash flow
-17.3%
Cash-on-Cash Return
1.7%
Cap rate
1.3%
Rent to Value Ratio

Active
$174,900
2
bds
|
1
ba
|
980
sqft
|
built
1965
5440 Three Points Blvd, Mound, MN 55364
$-555
Cash flow
-16.6%
Cash-on-Cash Return
1.9%
Cap rate
0.9%
Rent to Value Ratio

Active
$3,200,000
6
bds
|
7
ba
|
10,582
sqft
|
built
1996
18313 Nicklaus Way, Eden Prairie, MN 55347
$-12,086
Cash flow
-19.7%
Cash-on-Cash Return
1.1%
Cap rate
0.3%
Rent to Value Ratio