Rice County Investment Properties for Sale
Browse homes for sale and investment properties in Rice County. Refine your search by price, property type, or more.
Best cash flowing properties in Rice County
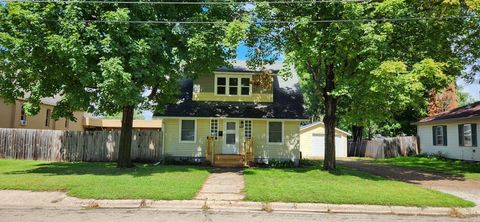
Active
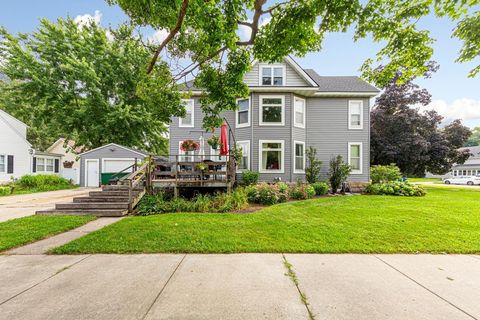
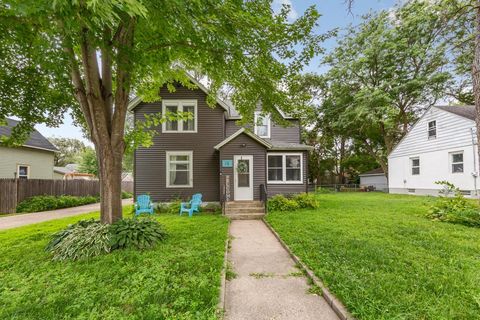
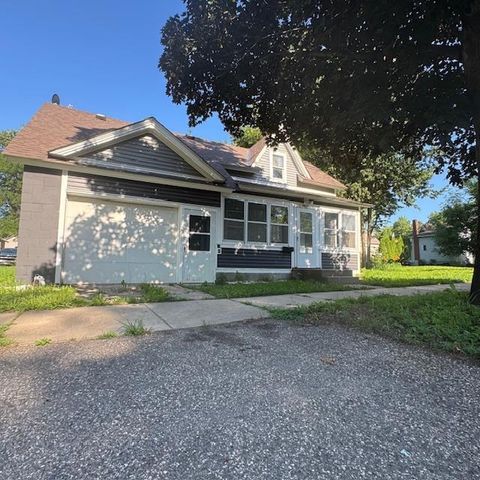
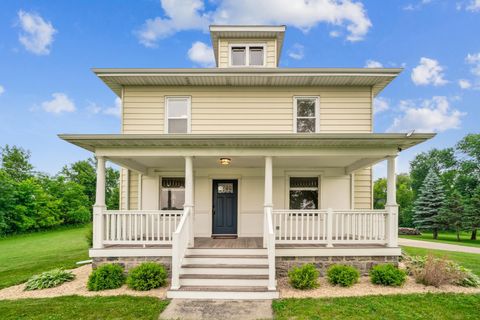
$260,000
4
bds
|
2
ba
|
2,462
sqft
|
built
1900
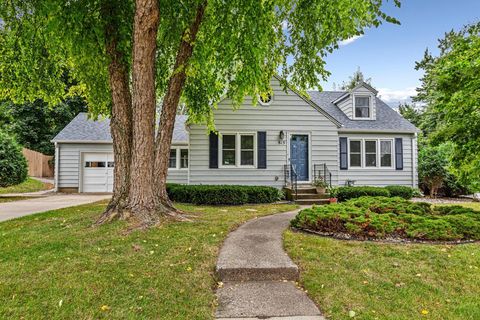
426 1st St NW, Faribault, MN 55021
$133
Cash flow
2.7%
Cash-on-Cash Return
6.3%
Cap rate
0.9%
Rent to Value Ratio
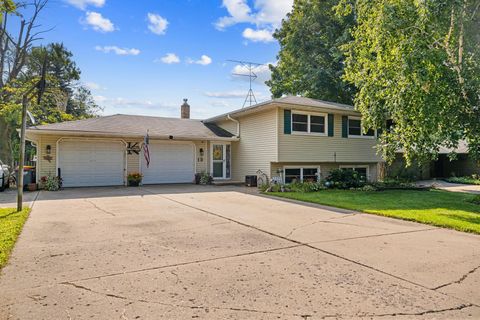
Active
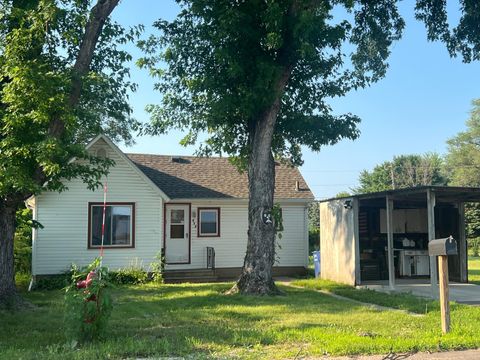
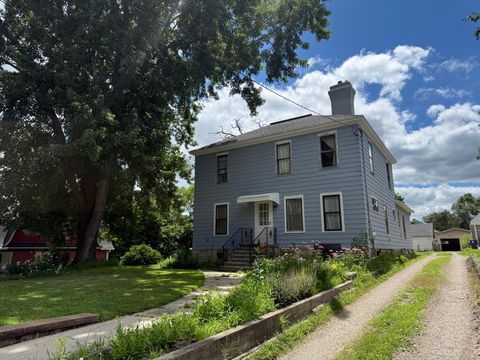
$149,500
2
bds
|
1
ba
|
708
sqft
|
built
1941
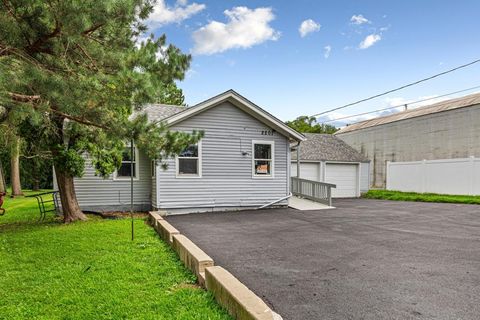
406 21st St NW, Faribault, MN 55021
$8
Cash flow
0.3%
Cash-on-Cash Return
5.7%
Cap rate
0.8%
Rent to Value Ratio
93 out of 167 properties for sale in Rice County
Limited Results Shown
Create a free account, or log in to reveal all property listings and enjoy the complete experience.
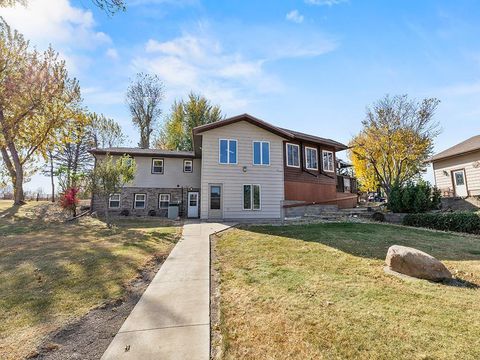
Active
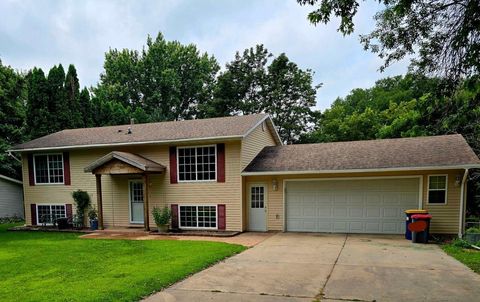
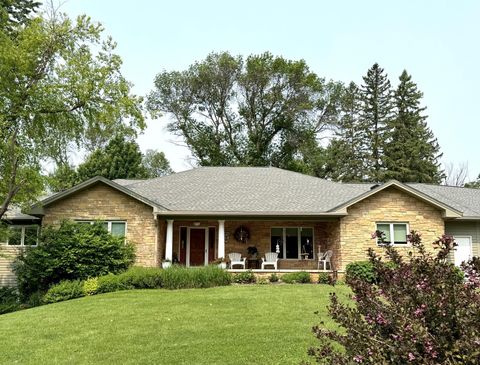
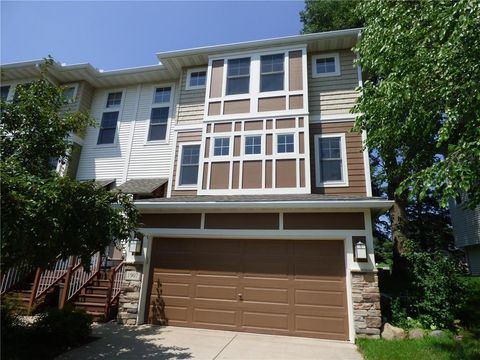
$315,000
4
bds
|
2
ba
|
1,940
sqft
|
built
1978
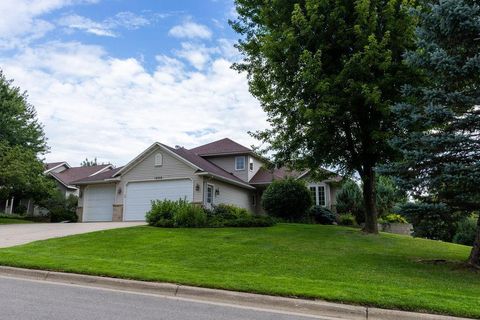
24 12th Ave SE, Faribault, MN 55021
$-90
Cash flow
-1.5%
Cash-on-Cash Return
5.3%
Cap rate
0.8%
Rent to Value Ratio
Active
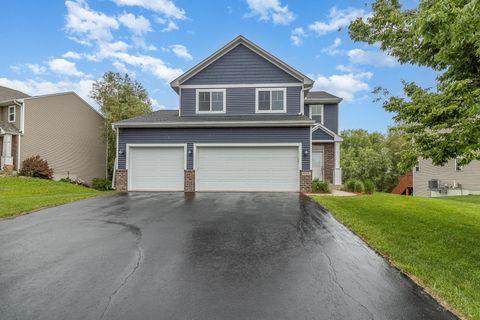
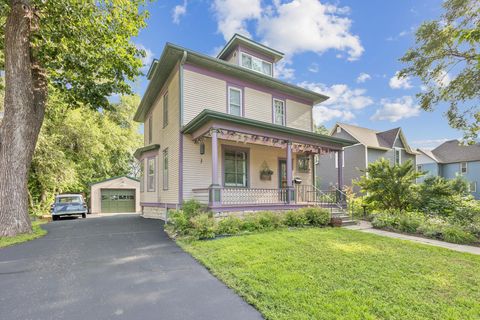
$389,900
4
bds
|
4
ba
|
2,474
sqft
|
built
2009
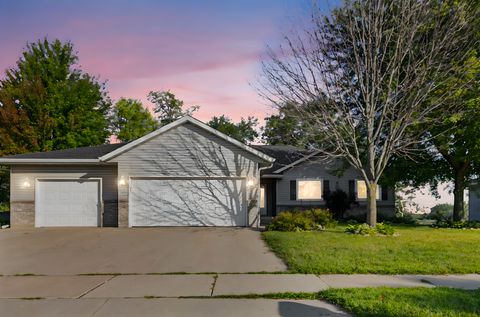
657 Golden Oak St NE, Lonsdale, MN 55046
$-475
Cash flow
-6.4%
Cash-on-Cash Return
4.2%
Cap rate
0.6%
Rent to Value Ratio
Active
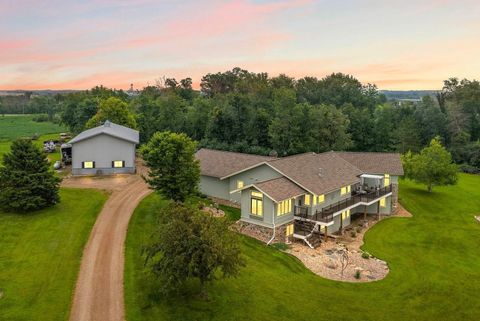
$695,000
4
bds
|
3
ba
|
3,462
sqft
|
built
1973
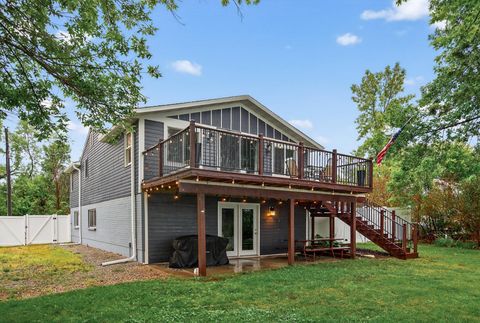
17965 Eiler Ave, Faribault, MN 55021
$-936
Cash flow
-7.0%
Cash-on-Cash Return
4.1%
Cap rate
0.5%
Rent to Value Ratio
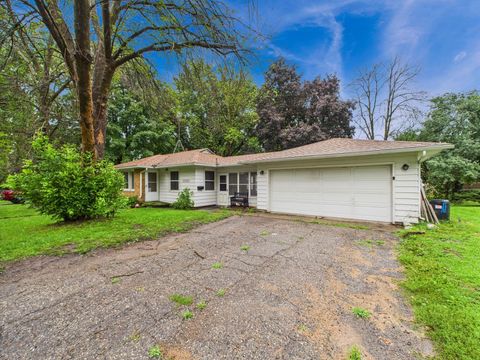
Active
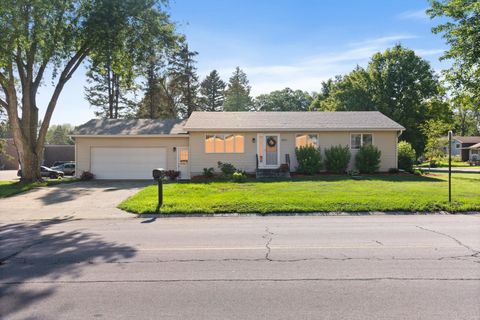
$265,000
2
bds
|
1
ba
|
1,147
sqft
|
built
1950
1117 Carlton Ave, Faribault, MN 55021
$-277
Cash flow
-5.5%
Cash-on-Cash Return
4.4%
Cap rate
0.6%
Rent to Value Ratio
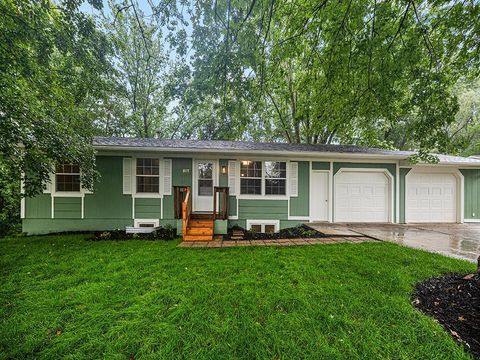
Active
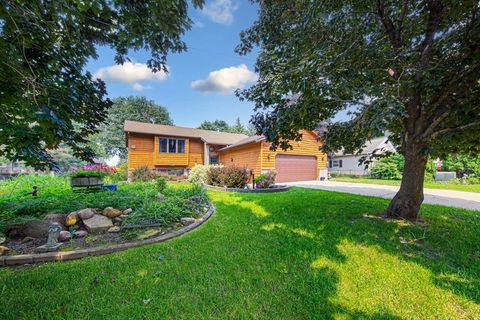
$325,000
5
bds
|
3
ba
|
2,080
sqft
|
built
1976
517 Ladonna Ln, Faribault, MN 55021
$-387
Cash flow
-6.2%
Cash-on-Cash Return
4.2%
Cap rate
0.6%
Rent to Value Ratio
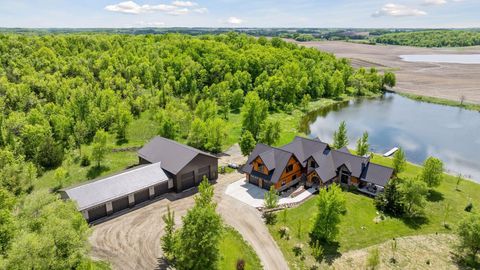
Active
$1,725,000
4
bds
|
3
ba
|
3,393
sqft
|
built
2018
12052 150th St W, Montgomery, MN 56069
$-6,421
Cash flow
-19.4%
Cash-on-Cash Return
1.2%
Cap rate
0.2%
Rent to Value Ratio
Active
$1,290,000
3
bds
|
3
ba
|
3,611
sqft
|
built
1994
12326 Falk Trl, Northfield, MN 55057
$-4,168
Cash flow
-16.9%
Cash-on-Cash Return
1.8%
Cap rate
0.3%
Rent to Value Ratio
Active
$250,000
3
bds
|
1
ba
|
1,400
sqft
|
built
1930
1128 6th St NW, Faribault, MN 55021
$-35
Cash flow
-0.7%
Cash-on-Cash Return
5.5%
Cap rate
0.7%
Rent to Value Ratio
Active
$399,900
3
bds
|
3
ba
|
2,435
sqft
|
built
2016
546 Cannon Way, Dundas, MN 55019
$-841
Cash flow
-11.0%
Cash-on-Cash Return
3.2%
Cap rate
0.6%
Rent to Value Ratio
Active
$329,000
4
bds
|
2
ba
|
2,094
sqft
|
built
1975
13 Mitchell Dr, Faribault, MN 55021
$-107
Cash flow
-1.7%
Cash-on-Cash Return
5.3%
Cap rate
0.8%
Rent to Value Ratio
Active
$419,000
5
bds
|
4
ba
|
2,796
sqft
|
built
1997
1255 Cuylle Bay, Faribault, MN 55021
$-396
Cash flow
-4.9%
Cash-on-Cash Return
4.5%
Cap rate
0.7%
Rent to Value Ratio
Active
$199,000
2
bds
|
1
ba
|
928
sqft
|
built
1940
2201 2nd Ave NW, Faribault, MN 55021
$-233
Cash flow
-6.1%
Cash-on-Cash Return
4.3%
Cap rate
0.7%
Rent to Value Ratio
Active
$320,000
3
bds
|
2
ba
|
2,085
sqft
|
built
1954
815 Rogers Row, Faribault, MN 55021
$-32
Cash flow
-0.5%
Cash-on-Cash Return
5.6%
Cap rate
0.8%
Rent to Value Ratio
Active
$429,000
5
bds
|
3
ba
|
3,024
sqft
|
built
2005
3102 8th Ave NW, Faribault, MN 55021
$-678
Cash flow
-8.2%
Cash-on-Cash Return
3.8%
Cap rate
0.6%
Rent to Value Ratio
Active
$599,000
3
bds
|
2
ba
|
2,112
sqft
|
built
1940
17603 177th St W, Faribault, MN 55021
$-952
Cash flow
-8.3%
Cash-on-Cash Return
3.8%
Cap rate
0.5%
Rent to Value Ratio
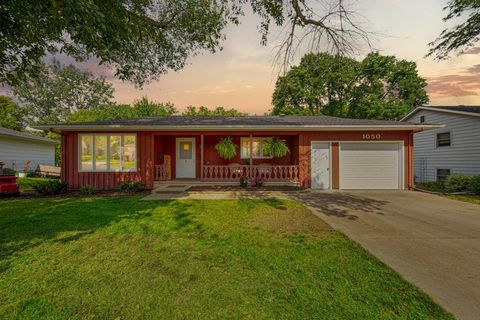
Active
$249,900
3
bds
|
2
ba
|
1,203
sqft
|
built
1971
1050 Westwood Dr, Faribault, MN 55021
$-14
Cash flow
-0.3%
Cash-on-Cash Return
5.6%
Cap rate
0.8%
Rent to Value Ratio
Active
$279,500
4
bds
|
2
ba
|
2,162
sqft
|
built
2003
320 20th St NW, Faribault, MN 55021
$-301
Cash flow
-5.6%
Cash-on-Cash Return
4.4%
Cap rate
0.6%
Rent to Value Ratio
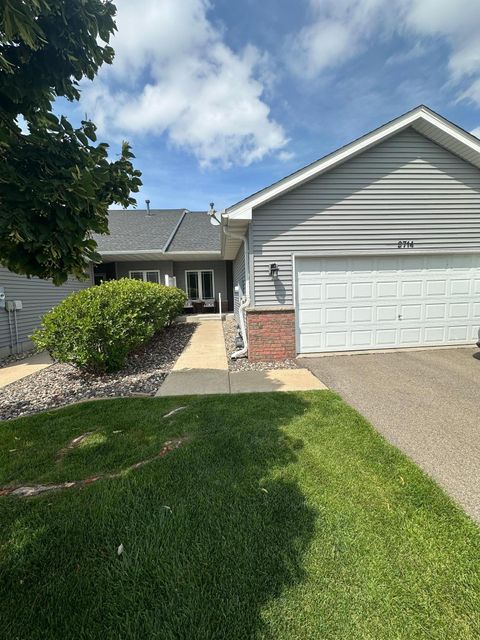
Active
$275,000
2
bds
|
2
ba
|
1,577
sqft
|
built
2006
2714 Village Dr, Faribault, MN 55021
$-498
Cash flow
-9.4%
Cash-on-Cash Return
3.5%
Cap rate
0.7%
Rent to Value Ratio
Active
$250,000
3
bds
|
2
ba
|
1,205
sqft
|
built
1900
15 14th St NE, Faribault, MN 55021
$-362
Cash flow
-7.6%
Cash-on-Cash Return
3.9%
Cap rate
0.8%
Rent to Value Ratio
Active
$1,150,000
4
bds
|
4
ba
|
3,512
sqft
|
built
1998
2312 Becker Trl, Faribault, MN 55021
$-3,645
Cash flow
-16.5%
Cash-on-Cash Return
1.9%
Cap rate
0.3%
Rent to Value Ratio
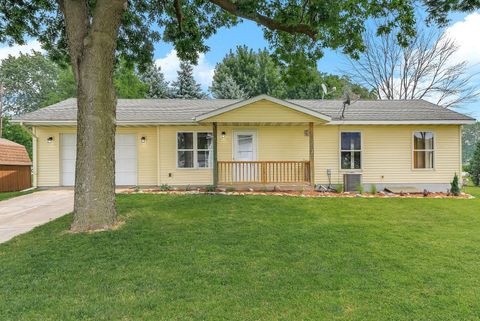
Active
$280,000
3
bds
|
2
ba
|
1,176
sqft
|
built
1980
1304 Prairie Ave SW, Faribault, MN 55021
$-147
Cash flow
-2.7%
Cash-on-Cash Return
5.0%
Cap rate
0.7%
Rent to Value Ratio
Active
$374,999
4
bds
|
2
ba
|
2,068
sqft
|
built
1989
2026 Paulis Dr, Faribault, MN 55021
$-430
Cash flow
-6.0%
Cash-on-Cash Return
4.3%
Cap rate
0.6%
Rent to Value Ratio
Active
$685,000
4
bds
|
4
ba
|
4,238
sqft
|
built
2014
1900 Hiersche Rd, Faribault, MN 55021
$-1,881
Cash flow
-14.3%
Cash-on-Cash Return
2.4%
Cap rate
0.4%
Rent to Value Ratio
Active
$749,900
3
bds
|
3
ba
|
2,761
sqft
|
built
2016
5827 154th St E, Faribault, MN 55021
$-1,671
Cash flow
-11.6%
Cash-on-Cash Return
3.0%
Cap rate
0.5%
Rent to Value Ratio
Active
$399,900
6
bds
|
3
ba
|
2,815
sqft
|
built
1975
1270 Aldrich Way, Faribault, MN 55021
$-611
Cash flow
-8.0%
Cash-on-Cash Return
3.8%
Cap rate
0.6%
Rent to Value Ratio
Active
$369,900
4
bds
|
2
ba
|
2,414
sqft
|
built
2006
1844 Patricks Bay, Faribault, MN 55021
$-389
Cash flow
-5.5%
Cash-on-Cash Return
4.4%
Cap rate
0.6%
Rent to Value Ratio
Active
$650,000
4
bds
|
3
ba
|
2,694
sqft
|
built
1884
25990 Gates Ave, Faribault, MN 55021
$-1,215
Cash flow
-9.8%
Cash-on-Cash Return
3.4%
Cap rate
0.5%
Rent to Value Ratio
Active
$239,999
3
bds
|
1
ba
|
1,458
sqft
|
built
1860
915 3rd Ave NW, Faribault, MN 55021
$-68
Cash flow
-1.5%
Cash-on-Cash Return
5.3%
Cap rate
0.8%
Rent to Value Ratio
Active
$299,900
2
bds
|
3
ba
|
1,769
sqft
|
built
2004
1907 Red Maple Ln, Northfield, MN 55057
$-635
Cash flow
-11.0%
Cash-on-Cash Return
3.1%
Cap rate
0.7%
Rent to Value Ratio
Active
$320,000
5
bds
|
2
ba
|
2,100
sqft
|
built
1909
616 7th St NW, Faribault, MN 55021
$-426
Cash flow
-6.9%
Cash-on-Cash Return
4.1%
Cap rate
0.6%
Rent to Value Ratio
Active
$535,000
4
bds
|
4
ba
|
3,842
sqft
|
built
1989
6 Greenhaven Bay, Faribault, MN 55021
$-740
Cash flow
-7.2%
Cash-on-Cash Return
4.0%
Cap rate
0.6%
Rent to Value Ratio
Active
$395,000
4
bds
|
3
ba
|
2,291
sqft
|
built
2004
1514 Sun Bird Ln, Faribault, MN 55021
$-438
Cash flow
-5.8%
Cash-on-Cash Return
4.3%
Cap rate
0.7%
Rent to Value Ratio
Active
$349,900
5
bds
|
2
ba
|
2,052
sqft
|
built
1959
1118 Home Pl, Faribault, MN 55021
$-514
Cash flow
-7.7%
Cash-on-Cash Return
3.9%
Cap rate
0.6%
Rent to Value Ratio
Active
$544,000
3
bds
|
3
ba
|
2,576
sqft
|
built
1995
5077 Dudley Lake Path, Faribault, MN 55021
$-857
Cash flow
-8.2%
Cash-on-Cash Return
3.8%
Cap rate
0.5%
Rent to Value Ratio

Active
$1,150,000
5
bds
|
4
ba
|
3,969
sqft
|
built
1981
15494 Camp Winona Trl, Faribault, MN 55021
$-3,488
Cash flow
-15.8%
Cash-on-Cash Return
2.0%
Cap rate
0.3%
Rent to Value Ratio
Active
$450,000
3
bds
|
3
ba
|
1,617
sqft
|
built
1920
18160 Echo Ave, Faribault, MN 55021
$-358
Cash flow
-4.2%
Cash-on-Cash Return
4.7%
Cap rate
0.6%
Rent to Value Ratio
Active
$434,500
4
bds
|
4
ba
|
3,188
sqft
|
built
1999
1404 19th Ave NW, Faribault, MN 55021
$-364
Cash flow
-4.4%
Cash-on-Cash Return
4.7%
Cap rate
0.7%
Rent to Value Ratio
Active
$220,000
3
bds
|
2
ba
|
1,988
sqft
|
built
1875
15 1st St SE, Faribault, MN 55021
$-246
Cash flow
-5.8%
Cash-on-Cash Return
4.3%
Cap rate
0.6%
Rent to Value Ratio